Wireless Earthquakes Feature Monitoring Based on
Acceleration and Magnetic Measurements
Using MEMS Sensor
M. Andang Novianta
Department of Electrical Engineering Intitute of Science & Tech. AKPRINDYogyakarta, Indonesia [email protected]
MS. Hendriyawan Achmad
Department of Electrical EngineeringYogyakarta University of Technology Yogyakarta, Indonesia [email protected]
Emy Setyaningsih
Department of Computer Science Intitute of Science & Tech. AKPRINDYogyakarta, Indonesia [email protected]
Abstract—Indonesia is one of country in the Ring of Fire area. Earthquakes becoming one of the greatest dangers that threaten people's lives. So it takes the instrument that can record natural anomaly data before the earthquake to be learned. Several previous studies have successfully done, but it requires a high cost. In this work, a natural anomaly before an earthquake is detected by the method of seismic waves and magnetic measurements using a 6-DoF MEMS (micro electro-mechanical systems) sensors. Seismic wave measured with an accelerometer sensor, and geomagnetic-ULF waves measured by the magnetometer sensor. Measurement data is transmitted using a wireless sensor network based on IEEE 802.15.4 ZigBee protocol, which is controlled by an 8-bit microcontroller device. All data were collected on a PC master observations in the form of a graph using the graphical user interface (GUI). The visual appearance of the seismic and magnetic signal help researcher to study the natural characteristics that could relate to the incidence of subsequent earthquakes.
Keywords: Earthquake; Seismic; ULF-geomagnetic; wireless sensor network; ZigBee IEEE 802.15.4; graphical user interface(GUI)
I. INTRODUCTION
Earthquake is the one of the natural disaster that could potentially cause large casualties. For years the researchers attempted to find a method to estimate when the earthquake will occur. It takes knowledge of natural phenomena prior to the earthquake. Thus we need the full information of natural characteristics prior and post the earthquake. There are natural features that appear before the earthquake occurred, such as geomagnetic; gravity; infrasound; ionosphere; etc. In 1975 China was able to save thousands of lives in Haicheng from major earthquakes 7.3 magnitude by observing animal behavior oddities around the epicenter before [1].
This study will use two natural phenomena as a subject of observation, namely seismic and magnetic. This is because these parameters are easy to obtain and inexpensive when compared with other parameters. Earthquake will produce seismic waves, which includes shear-wave, longitudinal wave and surface wave [2]. Seismic data is used to observe characteristics of whole earthquake waves that arise. Geomagnetic data is used to study the characteristics of the earth's electromagnetic waves at a lower frequency (ULF – ultra low frequency). ULF geomagnetic commonly used by researchers as an
indicator of activity of the earth's crust while the occurrence of earthquakes [3].
The primary objective of this study is getting a recording of seismic and geomagnetic characteristics as features of earthquake, prior-shortly-after events. From that information can be studied and used as a reference to create an earthquake early warning system.
II. DESIGN PRINCIPLES
In every occurrence of earthquake is always accompanied by a natural anomaly that features can be extracted. The natural phenomenon can be observed in 3 stages, that is prior-shortly-after the earthquake occurre. Observations were made at some point. Parameters are the seismic and magnetic measurements. All data were measured in the 3-axis (X, Y, Z) and transmitted through wireless communication to the collector. And lets be built multi-node with the concept of wireless sensor network.
All data measurements are used to obtain the features of natural phenomena before an earthquake. That feature can be used as an early warning system input of large earthquakes and save many live.
III. SYSTEM CONFIGURATION
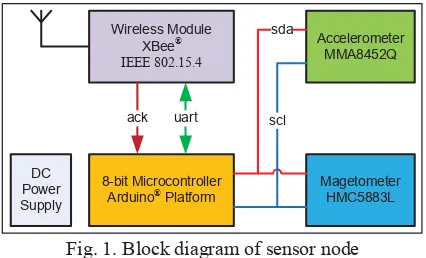
There are several part in every node, such as 2 sensor (accelerometer+magnetometer), main controller based on AVR 8-bit microcontroller and RF wireless Transceiver. Diagram block of sensor node as can be seen on Fig. 1.
8-bit Microcontroller Arduino® Platform
Magetometer HMC5883L Accelerometer
MMA8452Q
uart
sda
scl
DC Power Supply
Wireless Module XBee®
IEEE 802.15.4
ack
Fig. 1. Block diagram of sensor node
8-bit microcontroller based on Arduino platform is reading the sensor with I2C fast communication bus, this is to avoid errors in the analog readings by the ADC as commonly done. The main controller requires the most power when compared with the other parts,
Page 189 of 436
so that implementing sleep and wake up mode to save power.
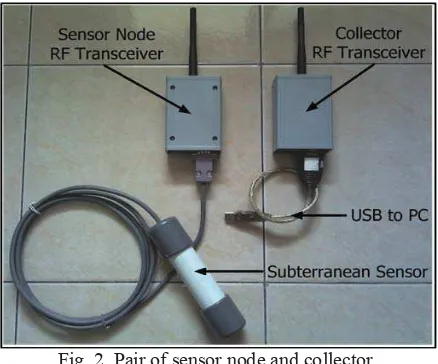
Data transmitted via RF transceiver XBee modules, which run the ZigBee IEEE 802.15.4 communication protocol commonly used in wireless sensor networks (WSN). Package design of sensor node can be seen on Fig. 2.
Fig. 2. Pair of sensor node and collector
IV. METHODOLOGY
A. MEMS Sensor
The sensors which used are based on MEMS technology. Accuracy, speed, and low power consumption to be a major factor for assessing the performance of a sensor. In this study used two types of sensors, namely: seismic sensor, and magnetic sensor.
1) Seismic Sensor
Seismic sensors are used to detect and measure the vibrations of the earthquake waves. 3-axis accelerometer as the main part of the seismic sensor, to be able to measure earthquake vibration of 3-axis based on changes in the measured gravity value for each axis. Technology of MEMS (micro electro-mechanical system) applied to the accelerometer to measure the acceleration of the Earth's movement that occurs in each axis (x, y, z) and can be applied to earthquake hazard mitigation [1][4]. Acceleration data can be integrated became a speed data and displacement data. In other words, using the accelerometer sensor can be obtained 3 informations at once. The formula below shows the relationship between these three scales.
ܣ݈ܿܿ݁݁ݎܽݐ݅݊ൌ݀ʹ݀ݐݑሺݐሻʹ (1)
ܵ݁݁݀ൌ݀ݑ݀ݐሺݐሻ (2)
ܦ݅ݏ݈ܽܿ݁݉݁݊ݐൌݑሺݐሻ (3)
Accelerometer used in this study is manufactured by Freescale. MMA8452Q is a smart sensor devices, capable of measuring acceleration in 3-axis motion and requires very little power (W) [5]. MMA8452Q has several facilities that help researchers gain
information that is accurate, fast, and easy. The following facilities are mentioned in [5]:
P & S seismic waves (body wave) is the fastest propagating wave with frequency between 0.5Hz - 10Hz [6]. This wave has small amplitude, and always precedes surface waves which have greater amplitude (earthquake events). To be able to read properly seismic body wave at frequency fn, at least MMA8452Q accelerometer is set with ODR value of 2*fn, according to the Shannon sampling theorem [7].
2) Magnetic Sensor
Some researchers have conducted a study on the relationship between the Earth's electromagnetic waves with the occurrence of large earthquakes [3][8][9][10][11]. Nowedays geomagnetic sensor technologies are already using MEMS technology to detect changes in the orientation of Earth's magnetic field of 3-axis measurement with high resolution and low power consumption. Activity of tectonic plates prior to the earthquake issued the electromagnetic wave spectrum frequency with ULF, ELF, VLF bands [12][13]. Magnetic waves in the ULF band (0.01Hz-1 Hz) tend to be more frequently detected in comparison with the other bands. This is because the ULF spectrum refers to the activity of the earth's crust at lower depths, thus the energy of ULF spectrum more powerful and can be detected before a large earthquake (M>4.5R) with meet the criteria 0.025R<M-4.5 [3]. This is proven by the electromagnetic wave attenuation formula follows:
݁ݔൣȂሺߨ݂ߤߪሻͲǤͷݔ൧ (4)
Where f is the frequency of the magnetic, ȝ is the magnetic permeability, and x is the distance of the sensor to the center of the earthquake. Equation (4) shows that attenuation values are linear with frequencies of electromagnetic waves, more higher frequencies more greater attenuation [8].
This study was conducted to observe the existence of ULF geomagnetic waves as a major aspect to estimated occurrence of earthquake above M4.5. We were using magnetometer manufactured by Honeywell namely HMC5883L. This electromagnetic sensor uses a technology called Anisotropic Magneto-Resistive (AMR) and is able to detect changes in the magnetic field every 200nT [14].
Magnetometer HMC5883L has several facilities that help researchers gain information that is accurate, fast, and easy. The following facilities are mentioned in [14].
With output data rate (ODR) at 160Hz, HMC5883L able to read ULF geomagnetic waves accurately. Several earlier studies using the geomagnetic sampling rate of 1Hz to observe the existence of ULF geomagnetic waves before large earthquake [15].
B. Arduino Base Microcontroller
Aduino is a small computer that uses 8-bit CPU in the form of the AVR microcontroller, utilized with an analog input interface known as analog to digital converter (ADC) 10-bit internally, analog outputs
Page 190 of 436
interface with pulse width modulation method (PWM), digital output interface, and data communications, namely universal asynchronous receiver-transmitter (UART) and serial peripheral interface (SPI) and
inter-integrated circuit (I2C) [16][17].
C. Wireless Network
This study uses the XBee devices, which run the ZigBee protocol communication standard IEEE 802.15.4. establishment of a new network, network membership, network addressing, the choice of network security, synchronization, time slot guarantee, portability, backup coordinator, conflict resolution identifier on a Personal Area Network (PAN), dynamic channel selection and linking and combining network. ZigBee network supports three network topologies, namely: Star, Mesh and Cluster Tree [18].
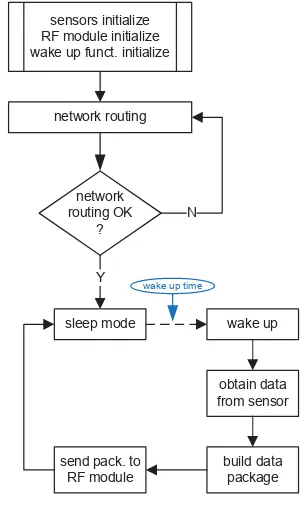
D. Software Diagram
The diagram illustrates the software workflow of MCU and facilitate in developing software as seen on Fig. 3. Wireless network is a critical part, and it must be ensured that the network has been successfully routing, otherwise telemetry function will fail. MCU is awake and slept alternately and continuously in a specified duration (sensor sampling rate). This condition is executed in order to save energy so that consume smaller power, and power life is getting longer (ie. using battery).
sensors initialize RF module initialize wake up funct. initialize
network routing OK
?
Y
sleep mode wake up
obtain data from sensor
build data package send pack. to
RF module
wake up time network routing
N
Fig. 3. Software workflow of sensor node
The structure of the data packet (application layer) delivered to the RF modules, arranged in a simple form as seen on Fig. 4.
PRE
*
Node IDACCELEROMETER
raw data (x-axis)
raw data (y-axis)
raw data (z-axis)
MAGNETOMETER
raw data (x-axis)
raw data (y-axis)
raw data (z-axis)
delimiter (SPACE)
POS
#
Fig. 4. Data packet structure of sensor node
V. EXPERIMENT AND RESULT
A. Graphical User Interface (GUI)
Raw data transmitted by the sensor nodes to be visualized using a GUI on a PC. The visual appearance of the seismic and magnetic signal help observers to study the natural characteristics that could relate to the incidence of subsequent earthquakes. Fig. 5 shows visual appearance of captured signal on PC, known as graphical user interface.
Fig. 5. GUI display seismic and magentic signal
This study starts from building infrastructure for wireless sensor networks, and then ended up on the presentation of seismic and magnetic waves visually using a GUI on a PC. Based on the graph shown by Fig. 5 can be applied mathematical operations as feature extraction and prove the correlation between seismic-magnetic anomalies with earthquakes that occur afterwards.
B. Power Consumption
Any current power consumption by the sensor node must be considered to ensure the main power supply capable of providing energy for the desired time. MCU implement efficient methods to reduce power consumption as low as possible during operation. Methods of sleep-wake up alternately by the MCU will reduce power consumption significantly compared with continuous operation. Fig. 6 shows the discrete operations of the sleep-wake up the MCU by sampling time.
sampling interval t_sleep t_wake up
I_wake up (A)
I_sleep (A)
Fig. 6. MCU timing diagram
Equation (5) below is used to calculate the average current consumption (ܫ#8 )) at discrete operation during
the measurement interval [19].
+#8 )ൌ
k+O HA A LൈPO HA A Lok+S =G AQLൈPS =G AQ Lo O = I LH E J CE J P AN R = H (5)
Page 191 of 436
Power consumption (Watts) and Energy (Joule) can be calculated by the following formula (6) and (7) [19].
ܲ
ൌ
ܫ
ܣܸܩכ ܸ
ݏݑ݈ݕ(6)
ܧ
ൌ
ܲ כ ݏ݈ܽ݉݅݊݃
݅݊ݐ݁ݎݒ݈ܽ
(7) Based on the experimental results on current measurements of sensor node with ܸݏݑ݈ݕ= +5Volt and 10 second sampling time, result can be shown on Table 1.
TABLE I. SUMMARIZE OF POWER CONSUMPTION
STATUS CURRENT (AMP)* P(WATT) E(JOULE)
WAKE UP
(STAND BY) 22 mA 110 mW 1.1 KJ
WAKE UP
(TRANSMIT) 237 mA 1185 mW 11.85 KJ
SLEEP 0.8 mA 4 mW 0.04 KJ
* average value
In next experiment, sensor node run on discrete operation with sampling interval = 50mS (20Hz), t wake up = 5mS, and t sleep = 45mS. Based on Formula (5) could be calculatedܫܣܸܩ of sensor node when transmitted data packet.
ܫܣܸܩ ൌሺͲǤͺ݉ܣൈͶͷ݉ܵሻͷͲ݉ܵሺʹ͵ͷ݉ܣൈͷ݉ܵሻൌ ʹͶǤʹʹ݉ܣ
Based on result above, we need power supply which is provide at least 121 miliwatt with 5 volt supply voltage to ensure sensor node run properly.
VI. CONCLUSION AND FUTURE WORK The purpose of this research is how to develop complex instrument both hardware and software to help researcher in recognizing the characteristics of natural phenomena such as seismic anomalies and geomagnetic anomalies that accompany the occurrence of large earthquakes, both before-shortly-after events. Acquired Characteristics related to the timing of the anomaly and its magnitude. The goal is to look for signs of nature which can be measured and valid long before the great earthquake occurred, so that it can be applied to the development of earthquake early warning system. For further research, applying mathematical analysis to extract the features of earthquake based on seismic and magnetic data on a PC prior-shortly-after, which can be used as input to an artificial intelligence system to recognize the signs long before the earthquake occurred.
ACKNOWLEDGEMENTS
This Research is the second year of a 2-year research plan. Research was founded by DIKTI-competitive grants program in 2014 from the Ministry of Education and Culture, Republic of Indonesia.
REFERENCES
[1] Y. Wu and H. Kanamori, “Development of an Earthquake Early Warning System Using Real-Time Strong Motion Signals,” in Sensors, 2008, pp. 1–9.
[2] H. Zheng, G. Shi, T. Zeng, and B. Li, “Wireless earthquake alarm design based on MEMS accelerometer,” 2011 Int. Conf. Consum. Electron. Commun. Networks, pp. 5481–5484, Apr. 2011.
[3] K. Hattori, “ULF Geomagnetic Changes Associated with Large Earthquakes,” Terrestial, Atmos. Ocean. Sci., vol. 15, no. 3, pp. 329–360, 2004.
[4] Y. Zhu and F. B. Zhan, “Medium-Term Earthquake Forecast Using Gravity Monitoring Data: Evidence from the Yutian and Wenchuan Earthquakes in China,” Int. J. Geophys., vol. 2012, no. Figure 1, pp. 1–6, 2012. [5] Freescale, “3-Axis, 12-bit/8-bit Digital Accelerometer.”
Freescale Semiconductor, pp. 1–47, 2011.
[6] Gutenberg, Jeffrey’s, Bullen, Macelwane, and Richter, Seismogram Analysis. Texas: The Geotechnical Corporation, 1960, pp. 1–32.
[7] J. A. Tropp, J. N. Laska, S. Member, M. F. Duarte, J. K. Romberg, and R. G. Baraniuk, “Beyond Nyquis: Efficient Sampling of Sparse Bandlimited Signals,” IEEE Trans. Inf. Theory, vol. 56, no. 1, pp. 520–544, 2010. [8] M. Parrot, “Electromagnetic Disturbances Associated
With Earthquakes: An Analysis of Ground-Based and Satellite Data,” J. Sci. Explor., vol. 4, no. 2, pp. 203–211, 1990.
[9] S. S. De, B. K. De, B. Bandyopadhyay, S. Paul, D. De, S. Barui, M. Sanfui, P. Pal, and T. K. Das, “Studies on the precursors of an earthquake as the vlf electromagnetic sferics,” Rome J. Phys., vol. 56, no. 9–10, pp. 1208–1227, 2011.
[10] S. Pulinets, “Ionospheric Precursors of Earthquakes; Recent Advances in Theory,” Terrestial, Atmos. Ocean. Sci., vol. 15, no. 3, pp. 413–435, 2004.
[11] M. Tsutsui, “Behaviors of Electromagnetic Waves Directly Excited by Earthquakes,” IEEE Geosci. Remote Sens. Lett., vol. 11, no. 11, pp. 1961–1965, 2014. [12] T. Yoshida, K. Yabu, and M. Nishi, “Observation of
co-seismic electromagnetic waves associated with the Geiyo earthquake in 2001,” IEEE Antennas Propag. Soc. Int. Symp. (IEEE Cat. No.02CH37313), vol. 4, pp. 318–321, 2001.
[13] T. Yoshida, M. Nishi, S. Takahashi, M. Kobayashi, and a. Kaneda, “Observation of Co-seismic Electromagnetic Waves in VHF Band Associated with Earthquakes,” 2006 IEEE Antennas Propag. Soc. Int. Symp., pp. 4671–4674, 2006.
[14] Honeywell, “3-Axis Magnetoresistive Sensor.” Honeywell, Minnesota, pp. 1–20, 2010.
[15] I. Takahashi, K. Hattori, M. Harada, C. Yoshino, and N. Isezaki, “Anomalous geoelectrical and geomagnetic signals observed at Southern Boso Peninsula , Japan,” Ann. Geophys., vol. 50, no. February, pp. 123–135, 2007. [16] M. Margolis, Arduino Cookbook, 1st ed. Gravenstein
Highway North, Sebastopol, CA 95472: O’Reilly Media, Inc., 2011, pp. 1–658.
[17] B. Evans, Begining Arduino Programming. Springer Science & Business Media, 2011, pp. 1–271. [18] J. Li, X. Zhu, N. Tang, and J. Sui, “Study on ZigBee
network architecture and routing algorithm,” 2010 2nd Int. Conf. Signal Process. Syst., no. c, pp. V2–389–V2– 393, Jul. 2010.
[19] P. Thanutong, D. Thanapatay, K. Kaemarungsi, and T. Isshiki, “Implementation of Low Cost Data Logger Using Flash Disk with File Allocation Table,” Int. Conf. Inf. Commun. Technol. Embed. Syst., no. Januari, 2010.