43 RESEARCH METHODOLOGY
In this chapter, the researcher will elaborate the methodology of the measurements. This chapter emphasize about the research methodology, data source, population and sampling, data collection, data measurement method, operational definition, analysis method.
3.1. Research Methodology
3.1.1. Research Purpose
Based on the purpose of the study, this research is a hypothesis testing research. According to Sekaran and Bougie (2013), the definition of hypothesis testing is a means of testing if-then- statements generated from the theoretical framework hold true when subjected to rigous examination. This kind of research explains a particular relationship between the dependent and the independent variable, or other factor that influence one variable to another.
3.1.2. Research Type
horizon, this research also classified to be a one shot or a cross-sectional study. The definition of a cross-sectional study is a research that conducted only within one time through a period of time to answer the research question (Sekaran and Bougie, 2013). This research is conducted by using a quantitative data.
3.2. Operational Definition
Peer evaluation will act as the dependent variable. The result of peer evaluation will be the researcher’s primary objectives. The peer evaluation
systems will be the tool and also the primary source to determine the social loafing behavior and self-monitoring. Self-monitoring will be act as a moderating variables, because it has a strong contingent effect on independent variable and dependent variable relationship. In this case social loafing will act as the independent variable because it influences the dependent variable in either a positive or negative. The control variables that will be included are gender and age.
3.3. Data Source
3.3.1. Primary Data
respondent to give accurate information about the variable that being observed by the researcher. The data that the researcher use for further research come from the student who participate in certain subject that involving Peer Evaluation Systems in the class. Genuinely, the researcher collecting the data from the questionnaire that distributed to selected class.
3.4. Population and Sampling
3.4.1. Population
According to Sekaran and Bougie (2013), population refers to the entire group of people, events, or things of interest for which the researcher wants to make inferences. The populations of this research are students that involve in group project from selected class and under the supervision of Peer Evaluation Systems to determine the performance in the class. In total of 221 undergraduate students from faculty of economics in Universitas Atma Jaya Yogyakarta become the population for this study.
3.4.2. Sampling
3.5. Data Collection
The data of the research will be conducted by questionnaire. The questionnaire will consist of four parts. The first and the second part will consist of list of questions regarding the Peer evaluation systems (PES). The third part is a questionnaire to measure self-monitoring. The forth part of the questionnaire will be consist of a list of questions to measure overall social loafing behavior within the group. The scale that used in the first and second is 5-point Likert scale. The data will be collected during the last week of class before the final exam. The researcher will contact the lecture to give time for approximately 20 minutes before the class had ended. The choice of course that the researcher will be selecting is a course that involve group process. The student will have a brief introduction about the research and the questionnaire that they will be answered.
3.6. Data Measurement Method
In this research, questionnaire is the main tool to collect the data. According to Sekaran and Bougie (2013) Likert scale is an interval scale that specifically uses the 5 point scale.
1. Section A
Section A will consist of the demographic information of the respondent;
2. Section B
The questionnaire is adapted from the Concordia University. The questionnaire consists of that consist of twelve six questions. The questions consist of four parts. The first and second part is a questionnaire to measure Peer Evaluation systems (PES). The first parts will consist of the Peer Evaluation Systems first dimension which is the Awareness of Peer Evaluation Systems. The second parts will consist of the second dimension which is the Perceive Importance of Peer Evaluation Systems. The forth part of the questionnaire will fill with the questions regarding of social loafing. The third parts of the questionnaire consist of question regarding self-monitoring. Thirteen questions are put in the questionnaire to measure self-monitoring. The forth part of the questionnaire consist of seven questions that focus on the judgment by the group members about the degree of social loafing in their group.
The entire questionnaire is using 5-point Likert scale. The first, the second, and the third questionnaire are using 5-point Likert scale that labeled:
1. Strongly Disagree = 1
2. Disagree = 2
3. Neutral = 3
5. Strongly Agree = 5
As for the scale in social loafing part, the questionnaire also uses 5-point Likert scale that labeled;
1. Certainly, always false = 1
2. Generally false = 2
3. Neutral = 3
4. Generally true = 4
5. Certainly, always true = 5
After the questionnaire is spread and collected for further analysis, coding the questionnaire is the first step to make the analysis. The result of the coding will be the primary source to make further analysis. According to Sekaran and Bougie (2013), data coding involves assigning a number of the participant’s
3.7. Analysis Method
3.7.1. Demographic Profile and Descriptive Statistic
Descriptive analysis is done to describe the data that will be used to analyze. In the descriptive analysis included the diagram of means, Standard deviation, maximum and minimum point, also the demographic statistic of the whole respondent (Sekaran and Bougie, 2013). By looking at the maximum and the minimum point, the interval that will be used as a scale (Lind, Marchal, and Wathen, 2015):
i. Questionnaire Scales Maximum score = 5 Minimum score = 1
� � �� − � = 5 −5 = .8
The scale that become the limitations of this research:
1, 0 – 1, 79 = very low
1, 80 – 2, 59 = low 2, 60 – 3, 39 = fair 3, 40 – 4, 19 = high
4, 20 – 5, 00 = very high
3.7.2. Validity Analysis
(2013), the test of validity is the test to prove the accuracy of an instrument
in this study a questionnaire, techniques, and processes that are used in
research, whether in accordance with the concept already used or not. In
this case to test the instruments, the researcher will used SPSS software to help find the validity. The validity score to determine the error is 0, 05.
3.7.3. Reliability Analysis
Whereas, reliability testing is a test that is destined for test how
consistent and stable a measuring instrument or tool (Sekaran and Bougie,
2013). The reliability of a measure indicates the extent to which it is
without bias (error free) and hence ensures consistent measurement across
time and across the various items in the instrument (Sekaran and Bougie,
2013). In the reliability testing, the researcher will use Cronbach’s Alpha
that proves to be the most accurate method. The scale of the Cronbach’s
Alpha are:
1. 0,0 – 0,20 = Not Reliable
2. 0,20 – 0,40 = Slightly Reliable
3. 0,40 – 0,60 = Reliable enough
4. 0,60 – 0,80 = Reliable
5. 0,80 – 1,00 = Very Reliable
3.7.4. Multiple Regression Analysis
Multiple regression analysis is used to measure the impact of social
Sekaran and Bougie (2013) multiple regression analysis is use if the
independent variable is more than one.
Below is the regression formula of the variable:
= + + + �
Y = Dependent Variable a = Constanta
, , = Coefficient Determination , , = Independent Variable
e = Error
By computing all of the independent variable at the same time along
with dependent variable. The dependent variable in this case is social
loafing behavior (Y). As for the independent variable consist of two, they
are the Perceive Importance of Peer Evaluation Systems (X1) and the
Awareness of Peer Evaluation Systems (X2). The hypothesis testing also
uses multiple regression analysis with t-test and f-test.
1. t-Test
According to Sekaran and Bougie (2013), one sample t-test is used to test the hypothesis that the mean of the population from which a sample is drawn is equal to a comparison standard. It show how far the impact of the independent variable in explaining the dependent variable.
The level of significance is 5% with the explanation:
i. If the t-count > t-table (>0,05) then Ha is accepted. It can be explain that statistically, the independent variable (perceive importance of peer evaluation systems and the awareness of peer evaluation systems) give impact on the dependent variable (social laofing behaviour).
ii. If the t-count<t-table (<0,05) then Ha is rejected. It can be expalin that the independent variable fails to give impact on the dependent variable. Hence, the hypothesis is rejected.
2. F-Test
F-statistic shows whether two sample variances differ from each other or are the same population. The F distribution is a probability distribution of sample variances and the family of distribution changes in the sample size (Sekaran and Bougie, 2013). According to Lind, Marchal, and Wathen (2015) the F distribution is used to test the assumption that the variances of two normal; populations are equal.
F Test is a method to compare variance of two different sets of values. F test is applied on F distribution under null hypothesis. Formula to determine the F-test can be shown as:
� � =
� − − �
F = the score for the F-value
� = coefficient of determination
k = the degree of parameter including Constanta
n = number of sample
With level of significances’ 5%, the assumptions for determining the decision are;
i. If the f-count > f-table (<0,05) then Ha is accepted. It can be explained that all of the independent variable simultaneously give a significant impact to the dependent variable.
ii. If the f-count < f-table (>0,05) then Ha is rejected. It can be explain that all of the independent variable simultaneously gives no significant impact to the dependent variable.
3.7.5. Moderating Regression Analysis (MRA)
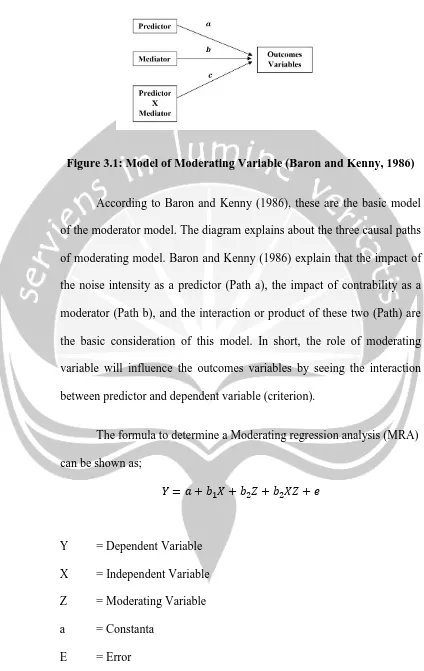
Figure 3.1: Model of Moderating Variable (Baron and Kenny, 1986)
According to Baron and Kenny (1986), these are the basic model of the moderator model. The diagram explains about the three causal paths of moderating model. Baron and Kenny (1986) explain that the impact of the noise intensity as a predictor (Path a), the impact of contrability as a moderator (Path b), and the interaction or product of these two (Path) are the basic consideration of this model. In short, the role of moderating variable will influence the outcomes variables by seeing the interaction between predictor and dependent variable (criterion).
The formula to determine a Moderating regression analysis (MRA) can be shown as;
= + + + + �
Y = Dependent Variable X = Independent Variable Z = Moderating Variable a = Constanta
bX = The beta of X and Y bM = The beta of X,Z to Y
bXM = The beta of the interaction between independent with moderating variable
In order to see whether the moderation is fully interact with the dependent variable and the independent variable, there are several key points that need to be compare:
i. The value of adjusted r-square of the independent variable (X), the independent variable (X) with the moderating variable (Z), and the interaction between the independent variable and self-monitoring (X*Z) have to increase.
X > XZ > X*Z
ii. The value the Sig. F of the of the independent variable (X), the independent variable (X) with the moderating variable (Z), and the interaction between the independent variable and self-monitoring (X*Z) have to decrease.