ISSN 1941-7020
© 2009 Science Publications
Corresponding Author: Puvanasvaran, A.P., Faculty of Manufacturing Engineering, University Technical Malaysia, Karung Berkunci 1200, Ayer Keroh, 75450 Melaka, Malaysia
Leanness Achievement through People Development System in Implementing
Lean Process Management
1
Puvanasvaran, A.P.,
2C.H. Tay,
2M.H.M.A. Megat,
2S.H. Tang, M.Y.
. 2
Rosnah,
1M.R. Muhamad
and
3A.M.S. Hamouda
1
Faculty of Manufacturing Engineering, University Technical Malaysia, Karung Berkunci 1200,
Ayer Keroh, 75450 Melaka, Malaysia
2
Department of Manufacturing Engineering, University Putra Malaysia, 43400 Serdang,
Selangor, Malaysia
3
Mechanical and Industrial Systems Engineering, Qatar University, Doha, Qatar
Abstract: Problem Statement: Many organizations fail to unlock the infinite potential of their
workforce. In that case there will be more overhead, with more layers of management, which in turn could cause slower reaction times in fast changing business. Employees should only start, run and optimize the process, even developing themselves with the aid of People Development Systems (PDS), when they are under-equipped to handle the process. Approach: This study evaluate the improvement
for the degree of leanness and top management commitment possessed by the company after PDS was implemented in the Kitting Department of the aerospace company. Quantitative measures were used to document the case study. Results: Leanness and top management commitments for kitting department
shows significant improvement and strong relationship with problem solving capability which lead to achievement of better Leanness level through the infrastructural investments. Conclusion: Hence, the
findings suggest or even prove that successful implementation of PDS which developed and equipped employees can provide a wide array of benefits to any company, irrespective of the industry in which it operates.
Key words: Leanness level, managerial commitment, lean process management, people development
system, aerospace company
INTRODUCTION
After publication of the influential book, The Machine that Changed the World, interest in the concept of lean production or lean manufacturing has grown and gained attention in the literature and in practice [1] and [2]. Many organizations have employed
lean manufacturing to improve competitiveness during periods of economic slow down[3]. Bhasin et al.[4] found
out that less than 10 per cent of United Kingdom organizations have accomplished successful lean implementation. Many different variables may impact a lean implementation and management support plays an important role in a lean manufacturing implementation[3]. There is a positive relationship
between investments in the supporting manufacturing infrastructure and actual changes towards lean manufacturing[1]. Karlsson
et al.[2] stated that lean
should be seen as a direction and the focus lies on the change in the determinants. Lean productions viewed a complex organizational principle that requires major
changes in a company[5]. The determinants that able to
reflect changes in an effort to become lean had been identified by Karlsson et al.[2].
Background and aim of the study: The Company
claim to have implemented lean manufacturing for around two years. The lean manufacturing practices that had been carried out are continuous improvement, 5’s and general visual management, cellular manufacturing, value stream mapping, total productive maintenance and pull production. Beside that, they also claim that the management people are very supportive in those practices.
The results of this study show the degree of leanness of the company and managerial support in lean implementation. It will help the company to identify the problems occurred in implementation of lean manufacturing. It can provide answer to questions such as: What has not been done? Where should we pay more attention? And what should be improved? Consequently the company is able to improve and sustain their lean manufacturing performance. Thus, it will increase and maintain company competitiveness in their industry. Beside that, successful lean implementation by the company will promote the lean manufacturing to other industry in Malaysia.
This study was conducted at an aerospace manufacturing company in Malaysia due to its two years experience of lean manufacturing implementation. Researcher only focuses in manufacturing division of the company and kitting area was selected. This is because the questionnaires developed are based on the factors in manufacturing division. Information of the company was confidential; therefore the company is named as company ABC.
The overall objective of this study is to evaluate the degree of leanness and degree of managerial commitment in the company. The specific objectives of this study are stated as below:
• To determine the degree of adoption of lean production principles in the organization
• To determine the management supporting in manufacturing infrastructure to become lean
The data generated will enable the testing of a number of study hypotheses. For this purpose the study will concentrate on:
H1: Company claim to have adopted lean
manufacturing principles have been making actual changes in the direction of the lean manufacturing principles.
H2: Company which claims a high degree of Top
managerial commitment to lean production programs simultaneously supports this commitment with in the supporting manufacturing infrastructure.
Literature review: According to case studies
conducted by Boyer et al [6], and Soriano-Meier et al [7], there are two major issues that will influence the implementation of lean manufacturing in a company. They are management commitment to lean manufacturing and Supporting Manufacturing Infrastructure (SMI). In their research, they focus on
Fig. 1: Model of commitment to lean production[6]
four infrastructural investments: Quality Leadership (QLEAD), Group Problem Solving (GROUP), Training (TRAIN) and Worker Empowerment (WEMP). Boyer[6]
mentioned that the support and emphasis which places on these infrastructural investments is considered to be a critical component which contributes to the success of lean production. Figure 1 shows the concept that lean producers who truly invest in the lean implementation.
According to Boyer et al. [6] management that fails
to embrace the implementation may interrupt the effort. Top management should not only demonstrate commitment and leadership, it must also work to create interest in the implementation and communicate the change to everyone within the organization. Management must be connected to the project and involved in the lean manufacturing events. If employees feel that the management team does not respect their efforts, discouragement may appear and the lean manufacturing effort will fail. Though it is often desirable to drive change from the factory floor, it is important that a conversion to lean manufacturing be driven by the executive management team. On the other hand[8] who stated that the principles in TQM can only
successes if there is well-informed quality leadership that sustains the continuous improvement process.
Boyer[6] stated the successful implementation of
lean production relies on well-trained employees. In a lean production environment, training is necessary in order to develop a workforce which is capable of shouldering the increased responsibility, to develop multi-skilled workers and to create an environment in which workers have the skills and ability to push for continuous improvement. By referring to Womack
et al.[9], Boyer[6] concludes that plants which allocate
greater resources for the training of the workforce have been shown to have increased productivity.
Forrester [10] stated that lean manufacturing is
usually accompanied by a shift towards exposure and solving of problem. This changes calls for a new approach in problem solving. Boyer [6] mentioned that
component of TQM and JIT. Besides that, teamwork and group problem solving serve to crash barriers and to improve the flow of information through a company, thus leading to improved productivity. Working as groups, while utilizing appropriate problem solving techniques, it will increase efficiency and pride in work improvement outputs[8].
Another key to successful lean production is worker empowerment, defined as giving workers more responsibility and control of the manufacturing process[6]. This is because only employees can identify
ways of improving the existing process of product [10].
One of the causes of failure of TQM implementation is inadequate worker empowerment at all levels within an organization [8].
There are three similar researches conducted by Karlsson et al.[2], Boyer et al.[6] and Soriano-Meier et al.[7] in different industries. Those researches will be
good guideline of this project. The findings of the researches support the objectives and hypotheses. Beside that, other journals which gave related information are also summarized in this study. Those journals mentioned the lean manufacturing principles and the obstacles of implementation of lean manufacturing. The methodology and analyses used by them will be good references for the researcher.
Developing a new system to enhance problem solving capability: The real advantages of employees
involvement are to focus a group of employees with different perspective on a single objective that support the organization’s strategic focus. The companies that develop and leverage the capabilities of all their employees will achieve better performance than those that do not. The companies that fail to unlock the potential of their workforce will be forced to carry more overhead, have more layers of management, will be slower to react to market change and opportunities.
Therefore, since we implement lean as a system in which the people functions need to be developed into a system which called People Management Systems to provide the capability for rapid improvement and adoption to change. Each of the three systems in framework has an own objective. The objective of the lean process management system is to identify and eliminate wastages by removing non value added activities. People management systems need to provide the capability for rapid improvement and adoption to change. Here, again, we must accept the fact that change is inevitable and that the speed with which the
necessary modification are made is the deciding factor in our survival. The objective of the business management system is to apply carefully the organizations limited resources, including capital and hard assets as well as time and human assets.
Three integration elements with total employee involvement from top to bottom play an important role for sustaining problem solving among employees in practicing lean concept. It is important to create People Development System (PDS) which consists of all these three elements with total involvement of people to increase problem solving capability. People management system, Business management system and Lean process management system are integrated by principles that, in a sense, hold them together. These principles are meant to provide a framework (Fig. 2) to focus the direction in enhancing problem solving capability among employees by forming as People Development System (PDS) in lean process management. They are:
• Key performance indicator-KPI for every level such as company, department, section and individual levels which is link towards organization goal • Respect for people-Respect for people which mainly
focuses on the lean behaviors that each employee in organization should build in their mind
• Skill and Knowledge-Skill and Knowledge for employees will support them in practicing lean Concept effectively and efficiently by utilizing the lean tool and techniques
Table 1: An analytical framework for measuring problem solving capability in lean process management [11]
Key characteristics of Critical Success Factors (CSF) of
integration elements People Development System (PDS) Performance Matrix
KPI Customer satisfaction Achievements of KPI for each
On time delivery level versus goal/target.
Mission Zero defect Productivity
Core value Cost reduction Scrap/Number of reject
Vision Effective operation cost Attendance/ Absenteeism
Objective Tardiness (Schedule time)
Strategy Using QCDAC principles
Strategy Initiative
Personal Objective
Respect for people Top management commitment Number of ideas generated
Team Environment Team effectiveness/formation Level of people involvement
Self Directed Ideas cost or value Usage of lean tools
Communication Continuous improvements Total cost saving projects
Lean behaviors Measured by Likert-type scale on the
Rewarding system following items:
Top Management Commitment Lean behaviors
Achievement of Leanness level
Skill and knowledge Produce skilled, knowledgeable and Lean tools and techniques assessment
Innovative employees
Technical requirements Employee skill metric
Cross functionality Audit by 3rd party or customers on lean
Training needs and effectiveness practice
Skill achievement
Another important element incorporated with this people development system framework is teamwork of top, middle and bottom management. The total commitment of all these three levels will enhance of problem solving capability in lean process management among employees.
Key characteristic, Critical Success Factors (CSF) and related performance matrix: The following key
characteristics, CSFs and related performance metrics are identified as crucial in people development system of lean process management as in Table 1.
• KPI in lean process management determination through Mission, Core Value, Vision, Objective, Strategy, Strategy Initiative and Personal Objective for people development system is crucial. This will align overall workforce of the company to follow for one common goal. Each level has its own portion of contribution towards the target. The results are compared with the target or goal used to measure the success of KPI. The accumulation of success from each portion will reflect the overall achievement of the company goal.
• Respect for people in lean process management is another crucial factor in developing the lean culture throughout organization. In order to measure the lean
behaviors, top management commitment, leanness level of the company and perception of team member’s capability, Likert-type scale is used to get the responses from respondent. For example, one can ask managers to rate the degree of support by top management on five-point scale from no support (1) to total support (5). Beside this, the problem solving capability also can be measured by counting the number of ideas generated, Level of people involved and the total cost of the project.
• Skill and Knowledge in lean process management is the fundamental requirement for employees to equip themselves. Without this they can’t perform well in solving problem to identify and eliminate wastages. Lean tools and assessment techniques by using assessment criteria to determine the level of implementation using spider web chart with rating of 1 (beginning to introduce) to 5 (practice with excellent). Another measurement on employee skill metric will emphasize on employees skill and their cross functionality.
Methodology: The questionnaire was developed by
referring to previous research conducted by Karlsson
et al.[2], Boyer et al.[6] and Soriano-Meier et al.[7]. The
There were two parts in the questionnaire. The first part was used to measure the degree of adoption of lean manufacturing principles and the degree of leanness of the company. The respondents will rate nine variables with the provided odd-numbered alternative scale. These nine variables are identified by Karlsson et al.[2]
and Soriano-Meier et al.[7]. They are elimination of
waste, continuous improvement, zero defects, just-in-time and pull instead of push, multifunctional teams, decentralized responsibilities, integrated functions and vertical information functions. The response scale is 1 through 5, representing the range of no adoption, less adoption, partial adoption, do adoption and totally adoption.
The second part of the questionnaire was used to measure the managerial commitment and their support in the manufacturing infrastructures. The supporting manufacturing infrastructure measured is Worker Empowerment, Training, Group Problem Solving and Quality Leadership, which stated by Boyer[6]. The first
variables is rated by score range from 1-5 which representing no emphasis, less emphasis, moderate emphasis, do emphasis and extreme emphasis. The last three variables rated with same score range but different heading, are strongly disagree, disagree, moderate, agree and strongly agree.
In this part, the respondents have to rate the management commitment to six lean practices. The score range is from 1-5, representing no commitment, less commitment, partial commitment, do commitment and total commitment.
Pilot test: Pilot test in conducted to ensure the result of
the questionnaire is valid and meet the objective of this project. This is done by sending questionnaire to two lean expertise of the company. Discussion on the questionnaire was held when the company was visited. Opinion was given which help researcher to modify the questionnaire. Beside that, from the pre-test, the total time spend to answer the questionnaire also can be identified.
Questionnaire modification: If the responses from the
pilot test do not show the validity, modifications on the questionnaire will be necessary. This may happen when the respondents may not be aware of certain information which is not in their field[12]. There was a
modification of the questionnaires. Boyer[6] only asks
the respondents to rate management commitment for two lean manufacturing practices, which was just-in-time and total quality maintenance. Researcher changed the two practices to six practices which claimed that those practices had been carried out in the organization.
Sending and receiving questionnaire: The
questionnaires send to a composite manufacturing company in Malaysia. The questionnaire is directed to three levels of the company, which are, top management, engineers and operators and shop floor workers. For the top management level respondent, the questionnaires were answered by all department of the company. Meanwhile, the questionnaire only rated by kitting area department for the last two level respondents. The feedback is received within two weeks from the company.
Data analyzing: In the first part of the questionnaire,
the mean and standard deviation were computed with the scores of the nine variables. The mean is the value of the Degree of Adoption (DOA). Degree of Leanness (DOL) was measured as the mean value of the nine separate variables in the model. Degree Of Commitment (DOC) was measured by the level of investment in supporting manufacturing infrastructure, as measured by Worker Empowerment, Training, Group Problem Solving and Quality Leadership.
There are a number of different reliability coefficients. One of the most commonly used is Cronbach’s alpha[13]. It is used to assess the internal consistency reliability of several items or scores that the researcher wants to add together to get a summary or summated scale score [14]. Cronbach’s alpha is based on
the average correlation of items within a test if the items are standardized[13]. The alpha value should be
positive and usually greater than 0.70 in order to provide good support for internal consistency reliability[14].
Correlations measure how variables are related. Before calculating a correlation coefficient, data screened for outliers and evidence of a linear relationship. Pearson’s correlation coefficient is a measure of linear association. If the relationship is not linear, Spearman’s rho will be used to measure the correlation between the variables[14]. A Pearson’
correlation coefficient describes the relationship between two continuous variables. A correlation between two dichotomous or categorical variables is called a phi-coefficient[13]. Correlation measured
between each of the supporting manufacturing infrastructure variables and the management commitment. Correlation also been measured between degree of adoption and the nine variables.
normal. The variance of the distribution of the dependent variable should be constant for all values of the independent variable. The relationship between the dependent variable and each independent variable should be linear and all observations should be independent[14].
There are three major regression models, which are simultaneous regression, hierarchical regression and stepwise regression. These models differ in two ways: First, in the treatment of overlapping variability due to correlation of the independent variables and second, in terms of the order of entry of the independent variables into the equation. Regression analysis was used to determine the strength of the relationship between the supporting manufacturing infrastructure variables and the commitments to lean manufacturing. Regression between the degree of adoption and the nine variables was also measured. With these correlation and regression analyses, the two hypotheses of the project will be proved or rejected.
RESULTS
This study involves all employees in the kitting area and top management from all departments of company ABC (Fig. 3). There are 45 employees in the kitting area and 8 top management peoples in this company. Therefore the sample size of this study case is 53 employees for Jan 2007 (Table 2). On the other hand, by end of December 2007 the total respondents for this case study were only 43 employees (Table 3).
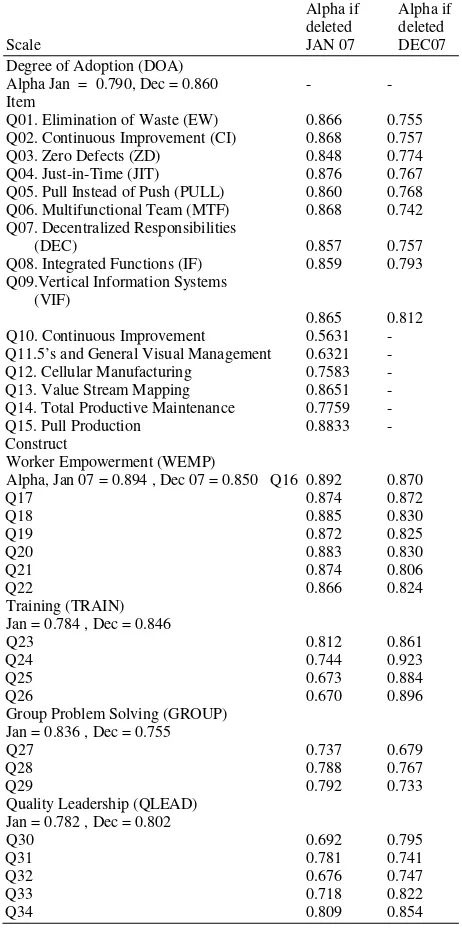
Reliability: Cronbach’s Alpha was used to assess
inter-item reliability, with alpha values of 0.7 or higher considered to indicate acceptable reliability for established scales[7]. Inter-item reliability is the degree
of internal consistency, measured by the inter-correlation among several items for the same construct[6]. Table 4 indicates the Cronbach’s Alpha
value for the DOA and the items if deleted. The items represent the questions in questionnaire.
23
Fig.. 3: The number of respondent for case study
Table 2: Statistics of type of feedbacks for Jan 07
Feedback Number of employees Percentage
Accepted 40 75 %
Rejected 3 6 %
Excluded 10 19%
Total 53 100 %
Table 3: Statistics of type of feedbacks for Dec 07
Feedback Number of employees Percentage
Accepted 43 100 %
Q01. Elimination of Waste (EW) 0.866 0.755
Q02. Continuous Improvement (CI) 0.868 0.757
Q03. Zero Defects (ZD) 0.848 0.774
Q04. Just-in-Time (JIT) 0.876 0.767
Q05. Pull Instead of Push (PULL) 0.860 0.768
Q06. Multifunctional Team (MTF) 0.868 0.742
Q07. Decentralized Responsibilities
(DEC) 0.857 0.757
Q08. Integrated Functions (IF) 0.859 0.793
Q09.Vertical Information Systems (VIF)
0.865 0.812
Q10. Continuous Improvement 0.5631 -
Q11.5’s and General Visual Management 0.6321 -
Q12. Cellular Manufacturing 0.7583 -
Q13. Value Stream Mapping 0.8651 -
Q14. Total Productive Maintenance 0.7759 -
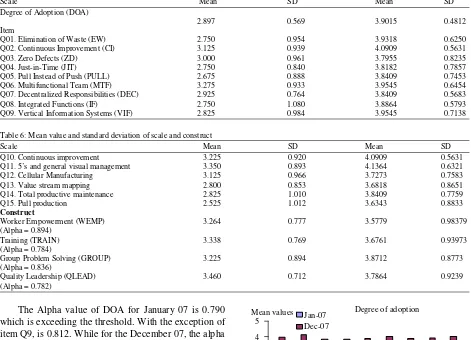
Table 5: Mean value and standard deviation of degree of adoption.
Scale Mean SD Mean SD
Degree of Adoption (DOA)
2.897 0.569 3.9015 0.4812
Item
Q01. Elimination of Waste (EW) 2.750 0.954 3.9318 0.6250
Q02. Continuous Improvement (CI) 3.125 0.939 4.0909 0.5631
Q03. Zero Defects (ZD) 3.000 0.961 3.7955 0.8235
Q04. Just-in-Time (JIT) 2.750 0.840 3.8182 0.7857
Q05. Pull Instead of Push (PULL) 2.675 0.888 3.8409 0.7453
Q06. Multifunctional Team (MTF) 3.275 0.933 3.9545 0.6454
Q07. Decentralized Responsibilities (DEC) 2.925 0.764 3.8409 0.5683
Q08. Integrated Functions (IF) 2.750 1.080 3.8864 0.5793
Q09. Vertical Information Systems (VIF) 2.825 0.984 3.9545 0.7138
Table 6: Mean value and standard deviation of scale and construct
Scale Mean SD Mean SD
Q10. Continuous improvement 3.225 0.920 4.0909 0.5631
Q11. 5’s and general visual management 3.350 0.893 4.1364 0.6321
Q12. Cellular Manufacturing 3.125 0.966 3.7273 0.7583
Q13. Value stream mapping 2.800 0.853 3.6818 0.8651
Q14. Total productive maintenance 2.825 1.010 3.8409 0.7759
Q15. Pull production 2.525 1.012 3.6343 0.8833
Construct
Worker Empowerment (WEMP) 3.264 0.777 3.5779 0.98379
(Alpha = 0.894)
Training (TRAIN) 3.338 0.769 3.6761 0.93973
(Alpha = 0.784)
Group Problem Solving (GROUP) 3.225 0.894 3.8712 0.8773
(Alpha = 0.836)
Quality Leadership (QLEAD) 3.460 0.712 3.7864 0.9239
(Alpha = 0.782)
The Alpha value of DOA for January 07 is 0.790 which is exceeding the threshold. With the exception of item Q9, is 0.812. While for the December 07, the alpha value is 0.860 and can be increase to 0.876 by deleted the question 4. But the Alpha value just increase slightly, even after elimination of this item. Therefore this elimination is not necessarily justified [12]. Since the
alpha value are greater than 0.7. Thus all the scale is acceptable. From the result, it can conclude that this instrument is reliable.
Table 4 shows the results of reliability analyses for each set of Supporting Manufacturing Infrastructure (SMI) construct indicators, worker empowerment, training, group problem solving and quality leadership. Beside that, the mean and standard deviation for management commitment in each lean manufacturing practice also indicated.
All the SMI construct Alpha value at January 2007 exceed the threshold with the lowest value is 0.782, for Quality Leadership indicator. And for the December 2007 the lowest value is 0.755 for Group Problem Solving. So, Elimination of items is not necessary because the improvement of Alpha value has slight changes.
Degree of adoption
0 1 2 3 4 5
1 2 3 4 5 6 7 8 9
Number of question Mean values Jan-07
Dec-07
Fig. 4: Mean value and standard deviation of degree of adoption
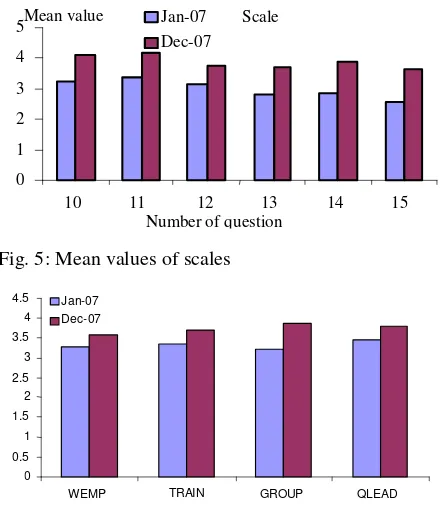
Scale
Fig. 5: Mean values of scales
0
Fig. 6: Mean values of construct
Based on the mean value, lean manufacturing practice which is most committed by management of the company is 5’s and General Visual Management (Q11). The mean value for January 2007 is 3.350 and for December 2007 is 4.1364 which shows the increment of 23.5%. Both values at different time frame are considering high compare to other practices. On the other hand, a similar occurrence at the lowest value is the Pull Production practice (Q15) in the company; with means value is 2.525 at Jan 07 and 3.6343 at December. This means company is less committed at the Pull Production practice. It can be seen in the Fig. 5.
Besides this, overall for the kitting department is very good because all the practices have been lifted up. In Group Problem Solving mean value has increased by 0.6462, from 3.225 to 3.8712. It can be seen clearly in Fig. 6. Hence, it can be concluded that company has put in a lot of effort at lean practice. In response to this, the researchers will only measure the correlation between management commitment in 5’s and General Visual Management with the four supporting manufacturing infrastructure.
Correlation: Correlation is the measure of the degree
of association between two variables when both are measured on a series of objects[15]. Spearman rho will
be computed for both cases because the variables are not normally distributed[13].
Table 7 shows that all nine variables January 2007 were significantly correlated to the degree of adoption. The Correlation of EW, CI, ZD, PULL, MTF, DEC and IF to DOA are highly significant, where p is less than 0.01. Meanwhile, the correlation for JIT and VIF to DOA are significant as well, where p is less than 0.05. As shown in Table 8, correlation between DOA and MTF has the largest correlation, where value r (40) is equal to 0.756. Besides this ,the result of December 2007 also show the same answer, the correlation of nine variable are also significant to DOA too, where p is less than 0.01.
Table 9 and 10 shows the correlation between the predictor variables and management commitment to 5’s General Visual Management. We can clearly see that no matter January or December. There is only two variables were significantly correlated to the management commitment, which are GROUP and QLEAD. Correlation of QLEAD to management commitment is highly significant at January 2007 and December 2007, which r (40) is equal to 0.394 and r (43) is equal to 0.541. Meanwhile, the correlation for GROUP to management commitment is significant as well, where r (40) is equal to 0.306 with p is less than 0.05. And become highly significant at December 2007, which r (43) equal to 0.384 with p less than 0.01.
Regression: The regression analyses are to determine
the strength of the relationship between independent variables and dependent variables[6]. Beside that, in
regression analyses an equation can be created. This regression equation allows prediction of values of the dependent from given values of the independent[15].
Simultaneous multiple regression was conducted to investigate the best predictors of degree of adoption. In simultaneous model, all independent variables enter the regression equation at once to examine the relationship between the whole set of predictors and the dependent variable[13]. This is because all the nine independent
variables are significantly related to dependent variable. The beta coefficients are presented in the Table 11 and 12. Note that all nine variables significantly predict the degree of adoption when they are included, no matter at January or December 2007 set data. The adjusted R squares value was 0.993 for January 2007. This indicates that 99.3% of the variance in degree of adoption was explained by all nine variables. On the other hand adjusted R squares was 0.999 for December 2007, this indicates 99.9% of the variance in degree of adoption was explained by all nine variables.
Table 7: Correlation analyses of degree of adoption of lean manufacturing principles January 2007
Variable EW CI ZD JIT PULL MTF DEC IF VIF
DOA 0.71** 0.71** 0.60** 0.62** 0.22** 0.76** 0.68** 0.50** 0.34**
Predictor variable
EW - 0.69** 0.53** 0.30* 0.54** 0.60** 0.33* 0.09 -0.16*
CI - 0.40** 0.43** 0.30* 0.52** 0.41** 0.01 0.11
ZD - 0.22 0.42** 0.40** 0.14 0.15 0.00
JIT - 0.51** 0.58** 0.33* 0.16 0.04
PULL - 0.54** 0.34* 0.10 -0.21
MTF - 0.43** 0.17 0.08
DEC - 0.51** 0.46**
IF - 0.59**
VIF -
p< .05, ** p< .01
Table 8: Correlation analyses of degree of adoption of lean manufacturing principles December 2007
Variable EW CI ZD JIT PULL MTF DEC IF VIF
DOA 0.66** 0.61** 0.61** 0.60** 0.78** 0.64** 0.76** 0.74** 0.67**
Predictor variable
EW - 0.44** 0.57** 0.27 0.43** 0.44** 0.49** 0.41** 0.28
CI - 0.65** 0.31* 0.35* 0.33* 0.34* 0.38* 0.52**
ZD - 0.41** 0.57** 0.36* 0.65** 0.54** 0.66**
JIT - 0.54** 0.36* 0.47** 0.54** 0.35*
PULL - 0.56** 0.60* 0.54** 0.44**
MTF - 0.61** 0.43** 0.34*
DEC - 0.66** 0.41**
IF - 0.52**
VIF -
p< .05, ** p< .01
Table 9: Inter-correlation for management commitment and predictors variables (N=40) January2007
Variable WEMP TRAIN GROUP QLEAD
5’s and general 0.201 0.197 0.306* 0.394**
visual management Predictor variable
WEMP - 0.261 0.315* 0.594**
TRAIN - 0.545** 0.454**
GROUP - 0.684**
QLEAD -
Table 10: Inter-correlation for management commitment and predictors variables (N=43) December 2007
Variable WEMP TRAIN GROUP QLEAD
5’s and general 0.278 0.210 0.384** 0.541**
visual management Predictor variable
WEMP - 0.269 0.344* 0.609**
TRAIN - 0.632** 0.621**
GROUP - 0.661**
QLEAD -
and 2. The equation also can be used to estimate the degree of adoption for other sample size.
Where,
EW = Elimination of waste mean value CI = Continuous Improvement mean value ZD = Zero Defects mean value
JIT = Just-in-Time mean value PULL = Pull Instead of Push mean value
Table 11: Simultaneous Multiple Regression Analyses Summary for EW, CI, ZD, JIT, PULL, MFT, DEC, IF and VIF (N=40)
Variable B SEB
EW 0.014 0.002 0.173**
CI 0.020 0.002 0.246**
ZD 0.015 0.001 0.180**
JIT 0.013 0.002 0.144**
PULL 0.017 0.002 0.195**
MFT 0.013 0.002 0.157**
DEC 0.013 0.002 0.127**
IF 0.016 0.001 0.222**
VIF 0.014 0.002 0.180**
Constant 0.062 0.006
Note. R2 = 0.993, SEB= Standardized coefficient B p < .01, ** p < .001
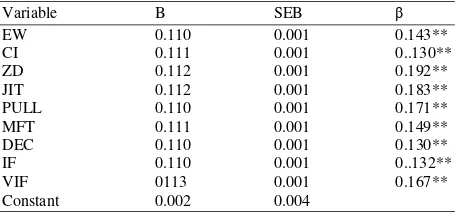
Table 12: Simultaneous Multiple Regression Analyses Summary for EW, CI, ZD, JIT, PULL, MFT, DEC, IF and VIF for DEC 2008 (N=43)
Variable B SEB
EW 0.110 0.001 0.143**
CI 0.111 0.001 0..130**
ZD 0.112 0.001 0.192**
JIT 0.112 0.001 0.183**
PULL 0.110 0.001 0.171**
MFT 0.111 0.001 0.149**
DEC 0.110 0.001 0.130**
IF 0.110 0.001 0..132**
VIF 0113 0.001 0.167**
Constant 0.002 0.004
MFT = Multifunctional Teams mean value DEC = Decentralized Responsibilities mean value IF = Integrated Functions mean value
VIF = Vertical Information Functions mean value
Eq. 1: Degree of adoption = 0.014*(EW) + 0.020*(CI)
+ 0.015*(ZD) + 0.013*(JIT) + 0.017*(PULL) + 0.013*(MFT) + 0.013*(DEC) + 0.016*(IF) + 0.014*(VIF) + 0.062
Eq. 2: Degree of adoption = 0.0110*(EW) +
0.111*(CI) + 0.112*(ZD) + 0.112*(JIT) + 0.110*(PULL) + 0.110*(MFT) + 0.110*(DEC) + 0.110*(IF) + 0.113*(VIF) + 0.002
Eq. 3: Managerial Commitment = 0.494* (QLEAD) +
1.642 Where,
QLEAD = Quality Leadership mean value
In stepwise regression, the number of independent variables entered and the order of entry are determined by statistical criteria generated by stepwise procedure
[13]. Since not all independent variables significantly
related to managerial commitment, therefore stepwise regression would be appropriate to analyses the combined effect of predictor variables on dependent variable. In this case the management commitment to 5’s and General Visual Management will be the dependent variables. The independent variables are the supporting manufacturing infrastructure. The results of stepwise regression are given in Table 13 and 14. The only variable selected to enter the model is Quality Leadership, which is accounts for 39.4% of the variance in the dependent variable, on January 2007 data set. But for December 2007 is become 89.7% of the variance in the dependent variable. Meanwhile, both of the dependent variable is significant at p is less than 0.01.
The other variables are excluded from the model. These are true with the result of correlation analyses, where Quality Leadership is the only related variables and contribute to the 5’s and General Visual Management. The regression equation for this model to predict the managerial commitment of the company is stated in Eq. 3 and 4 the equation also can be used to estimate managerial commitment for other sample size.
Eq. 4: Managerial Commitment = 1.37* (QLEAD) +
15982 Where,
QLEAD = Quality Leadership mean value
Table 13: Stepwise regression for Management commitment to 5’s and General Visual Management with supporting manufacturing infrastructures (N=40) January 2007
Independent variables B SEB R2 F
QLEAD 0.494 0.187 0.394 6.964*
Constant 1.642 0.660
* p < 0.05
Table 14: Stepwise regression for Management commitment to 5’s and General Visual Management with supporting manufacturing infrastructures (N=44) December 2007
Independent variables B SEB R2 F
QLEAD 1.37 0.104 0.897 9.882*
Constant 1.598 0.400
* p < 0.05
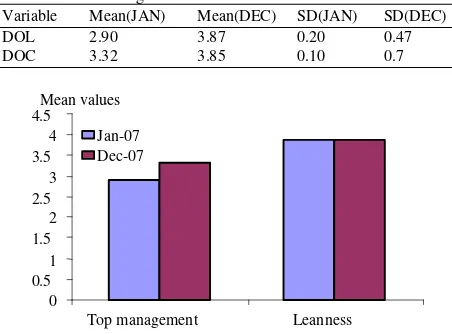
Table 15: Mean values and standard deviation of degree of leanness and management commitment
Variable Mean(JAN) Mean(DEC) SD(JAN) SD(DEC)
DOL 2.90 3.87 0.20 0.47
DOC 3.32 3.85 0.10 0.7
0 0.5
1 1.5
2 2.5
3 3.5
4 4.5
Top management Leanness
Mean values
Jan-07 Dec-07
Fig. 7: Comparison result of top management and leanness for January and December 2007
Analysis on the degree of leanness and degree of
management commitment: Degree of Leanness
(DOL) was measured as the average of the actual changes taking place as measured by the nine principles of lean manufacturing. Degree of Management Commitment (DOC) was measured by the level of investment in supporting manufacturing infrastructures, as measured by WEMP, TRAIN, GROUP and QLEAD. The graph indicates the mean and index value of DOL and DOC.
infrastructures has been making the company more leanness.
Discussion on problem solving capabilities and its importance: From the result of analysis, no matter
leanness or Top management commitments for kitting department are shows significant improvement. Authors found that the increment have strong relationship with problem solving capability of the kitting department which lead to achievement of better Leanness level through the following infrastructural investments. This is supported by various research conducted by researches on each infrastructural investments
Group problem solving capabilities: Group problem
solving capabilities are required the employee to work as team. Team members need training in breadth so that they can perform each others’ jobs and in depth so that they resolve unforeseen problems as they occur[16].
Furthermore, a group of people who meet regularly to discuss problems and issues related to quality may examine them and come up with solutions[17].The
research by cooper[18] indicates that the introduction of
true cross-functional teams can dramatically improve the time to solve the problem such as market of new products and impacts on the success of new product development.
Training: The research conducted by MacDuffie and
Pil[19] shows there is an evidence that there is a
relationship with the problem-solving and training. In their study a random selection of three plants (one from each product area) from the 18 case plants there would appear to be significant differences between the seat plant and the other two plants in terms of recruitment, selection, training and job security. With the seat plant is spending up to five times as long in assessing the suitability for employment of new recruits and giving up to three times more off-the-job training to its shop floor operators than the other two plants. Furthermore, Harry Barton & Rick Delbridge[20] in their study also
describe effectively in problem-solving and continuous improvement activities, shop floor workers will need to have capabilities in technical, analytic and planning skills but also interpersonal training..
Worker empowerment: There is consistent empirical
support for a positive linkage between delegation and both idea generated or problem solving. In a study among German middle managers Krause[1] investigated
whether leaders can influence the innovation process by granting their subordinates freedom and autonomy. She found that granting freedom and autonomy was positively related to various types of innovative behavior, including the generation, testing and implementation of ideas and all of this will toward to
the direction of solving the problem. In an early study among NASA scientists[21] also concluded that
providing subordinates with more freedom to explore, discuss and challenge ideas was associated with higher problem solving performance and innovative .
Quality leadership: In the study of “How leaders
influence employees innovative behavior” the researchers de Jong & Hartog[22] attempted to
communicate their mission and vision and wanted to provide their employees with a beacon for innovative efforts . Studies demonstrated an empirical connection between providing vision and mission with the idea generated and that is the key of the company solving the problem. First, it provided a frame of reference that indicated what kind of ideas would be appreciated. One interviewee from the innovative subset told us: We want to be a leading firm in language technology. Of course, ideas that fit within our mission have a better chance of being implemented. Second, if a promising idea fits within a vision familiar to and shared by employees, convincing them of its value and guiding its implementation was believed to be much easier and Hounsell[23] demonstrated that the use of a vision results
in successful research and development outcomes of solving the problem.
In conclusion the PSC of the employee improve most practices of the leanness. Thus, implementing lean process management after one year, problem solving capability of employee had been increase and makes the lean practice of the company improved.
Success of people development system in case study company: Important of problem solving capabilities of
every employee in implementing lean process management to make the improvement in leanness level and top management commitment which was prove by the real life data of kitting department of the case study company.
Idea generated and level of involvement: Many
studies focus mainly on the creative or idea generation stage of problem solving. In this context, employees can help to improve business performance through solving problem, such as generate ideas and use these as building blocks for new and better products, services and work processes[24].from the graph show below,
BOTTOM
Level of employees involvement for year 2007
35 IDEAS
Fig. 8: Level of employee’s involvement for year 2007
The employee involvement are categorize according to three main levels which are top, middle and bottom management. The Fig. 8 shows the level of involvement of employees by generating ideas for the year 2007. The highest contribution are coming from bottom level which is 38 and followed by middle level with 12 top level is 2. Beside this, there are also combination level involvements in idea generated. Bottom-middle level is 52, middle-top is 35 and bottom-top is 1. Furthermore, Total idea generated for group combination level is 87 and group single level is 52. Percentage for combination level is 63% for total ideas generated and 3 type levels is 37% .However .if we compared 2 groups, the result show that total idea generated by group combination level are 35 more than group single level. Thus, the result indicates the teamwork of bottom, middle and top management in both sharing and applying knowledge for generated idea to solving problem are important[26].
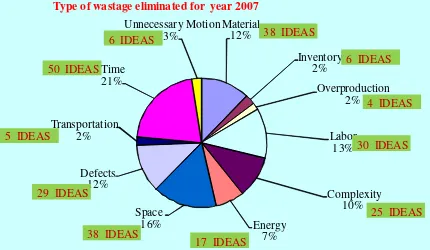
Type of wastages eliminated: The Fig. 9 gives us an
idea about total wastages of the kitting department, where wastage is classified into 9 categories. We can obvious the highest waste for company is space waste which is 39, second is time waste which is 26 and last is waste of transportation which is 5. Without classification of any wastage into performance measurement, no monitoring can be made and no problem solving can be done to reduce the waste, which the impact is the failure of lean process at Kitting department. It indicates employee of the company have capabilities to solve waste problem using the includes customer relations, product design, supplier networks and factory management. To meet the
Type of wastage eliminated for year 2007
30 IDEAS
Fig. 9: Type of wastage eliminated for year 2007
been run a Kaizen Project in 2007 and total amount saving for reduces wastages in past one year is RM1, 952,617.98. Thus, achievement of cost saving for company indicates employee had been come out much solution to solve problem waste. So, we can conclude that problem solving capability of employee actually have a significant improve. The Table 16 indicates total cost savings of the kitting department with the reference to their kaizen project generated form the problem solving activities.
Lean tools used in problem solving: In general, lean
tool for kitting department can be categorize to 9 kind such as 5S, total productive maintain, kaizen, visual stream map, visual indicator, just in time, standard work chart (Fig. 10). Most common tool used by kitting department is TPM, which is 62 times, following is 5S is 55 time and mean values of using lean tool is 21 times. In past one year, the kitting department total used 189 time of lean tool. In order to introduce lean thinking within manufacturing environments the philosophy relies on the identification and elimination the waste problem, which must have effectively target and apply the various lean tools[28]. Thus, the frequent
of employee used lean tool indicates employee understanding identification and elimination waste problem. So, we can conclude that employee have capability of problem solving.
KPI Achievement: KPI is an important element that
Table 16: Continuous improvement projects for the year 2007 and 2008
Kitting continuous improvement projects for the year 2007/2008
---
2007 2008
--- ---
Registered Total (RM) Registered Total (RM)
1-reduce time for S91 controller $19,04280 1-Reduce consumable usage $100,000
2-Jit production preparation $136,97344 2- Reduce space $20,000
*Kanban regulator
*Nesting and sticker racks
* Reduce plastics usage *Jit supermarket
*Reduce over time 3-Convert walk way into clean room $100,000
* Eliminatednght allowansec * Reduce electricity usage
Total $156,01624 Total $220,00000
Unregistered Total (RM) Unregistered Total (RM)
1 Tools trolley $127.70 1-Dry & resin rich issue under monitoring
2- Split and batch paper work $1,795,98816 2-Nesting improvement on under monitoring
A320 and A 400M
Lean tools & techniques use for year 2007
4 IDEAS
Fig. 10: Lean tool and techniques use for year 2007
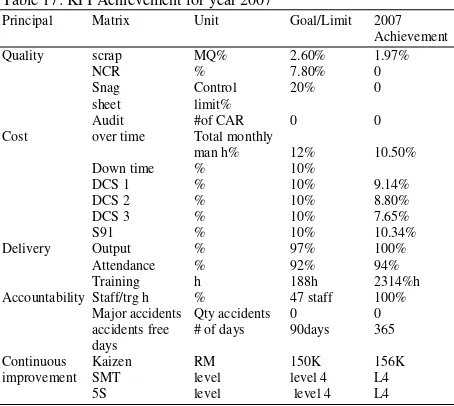
Table 17: KPI Achievement for year 2007
Principal Matrix Unit Goal/Limit 2007
Base on the Table 17 that the value scrap is 1.97% which is considered as an achievement as the goal is
2.6%. The reason, the value achieved is because employees using the PDS method solved many scrap problems, such as material dry and ply damage for the whole year. Beside this achievement, complaints regarding product produce from the internal as well as the external customer showed null. It shows that quality of the Kitting Department was optimized or upgraded been implemented. Wastages have been reduced dramatically. Thus, the achievement of KPI proves that the problem solving capability among the employees had been increased.
As for as the Cost, Base on the Table 17 shows total monthly man hours percentage of overtime at Kitting Department has been set below the limit of 12% for the year 2007. When the PDS was implemented, overtime was kept under control all the time, and it did not exceed even a month, which eventually give a value of 11.5% for the whole year. So, it indicates that the company has been able to save a lot of labor cost in the past one year, because of employees’ success in lowering the stop time for the machine DCS 1, DCS 2, DCS 3.
CONCLUSION
The purpose of this project has been to evaluate the improvement for the degree of leanness and top management commitment possessed by the company in past one year. The result show lean practices had been make improvement for the kitting department with the employees’ problem solving capabilities in eliminating waste which contribute to the cost saving .The results have provided support to the two proposed hypotheses. Beside that, evidence was found to support the relation between improvements of kitting department with problem solving capability. Furthermore, it also indicates indirectly on their improvement on lean behaviors[29].
The main findings show that the kitting department is improving in past one year. Initial result of the kitting department was in moderate level to become lean[30] but
end of year results show that they had nearly meet the high level of lean. It is mainly due to putting efforts into the nine principles especially Continuous Improvement. On the other hand, company should encourage the Quality Leadership in order to improve the top managerial commitment. This finding has implications to the company as it provides a means to help them to measure its degree of commitment to lean manufacturing and its degree of adoption of lean manufacturing principles. They need to keep their efforts in order to success in lean manufacturing implementation. Its also help the company to recognize the important of problem solving capability among employee in eliminating wastages.
ACKNOWLEDGEMENTS
The authors would like to acknowledge the University Technical Malaysia Melaka for the scholarship and financial support granted.
REFERENCES
1. Krause, B.L., 2004. Understanding Industrial Relations in Modern Japan. Oxford University Press, New York.
2. Karlsson, C. and P. Åhlström, 1996. Change processes towards lean production: The role of the management accounting system. Int. J. Operation and Production Manage. 16: 42-56.
3. Worley, J.M. and T.L. Doolen, 2006. The role of communication and management support in a lean manufacturing implementation. J. Management Decision, 44: 228-245.
4. Bhasin.,S and P. Burcher, 2006. Lean viewed as a philosophy. J. Manufact. Technol. Manage., 17: 56-72.
5. Mathaisel, D.F.X. and C.L.2000. Comm, Developing, implementing and transferring lean quality initiatives from the aerospace industry to all industries. Managing Service Quality, 10: 248-356. 6. Boyer, K.K., 1996. An assessment of managerial
commitment to lean production. Int. J. OperaT. Produc. Manag., 16: 48-59.
7. Soriano-Meier, H. and P.L. Forrester, 2002. A model for evaluating the degree of leanness of manufacturing firms. Integrated Manufactur. Sys., 13: 104-109.
8. Gatchalian, M.M., 1997. People empowerment: the key to TQM success. The TQM Magazine, 9: 429-433.
9. Womack, J.P., D.T. Jones and D. Roos, 1990. The Machine that Changed the World. Emerald Group Publishing Limited.
10. Forrester, R., 1995. Implications of lean manufacturing for human resource strategy. Work Study, 44: 20-24.
11. Puvanasvaran, A.P., M.H.M.A. Megat, S.H. Tang, M.R. Muhamad and A.M.S. Hamouda, 2008a. A Review of Problem Solving Capabilities in Lean Process Management. Am. J. Appl. Sci., 5: 504-511.
12. Grandzol, J.R. and M. Gershon, 1998. A survey instrument for standardizing TQM modeling research. Int. J. Quality Sci., 3: 80-105.
13. Coakes, S.J., 2005, SPSS: Analysis without Anguish-version 12.0 for Windows, John Wiley & Sons Australia. Ltd, Queensland.
14. Morgan, G.A., N.L. Leech, G.W.Gloeckner and K.C. Barret, 2004. SPSS for introductory Statistics: Use and Interpretation Second Edition. Lawrence Erlbaum Associates, Publishers:111-124.
15. Bower, J.A. 2000. Statistics for food science-VI: correlation and regression (Part A). J. Nutrition and Food Science, 30: 295-299.
16. Heller, F., E. Pusic, G. Strauss and B. Wilpert, 1998. Organizational Participation: Myth and Reality, Oxford University Press, Oxford.
17. Berger, A, P. Lindberg, 1997. Continuous Improvement-Design, Organization and Management. Int. J. Technol. Manage., 14: 86-101. 18. Cooper, R.G., 1999. Success factors in product innovation. J. Product Innovation Manage.,16: 115-33.
20. Barton, H, Delbridge. R, 2001.”Development in the learning factory: training human capital”, Journal of European Industrial Training, 25: 465±472. 21. Andrews, F.M., G.F. Farris, 1967. Supervisory
practices and innovation in scientific teams. Personnel Psychology, 20: 497-515.
22. de Jong J.P.J. and Hartog, D.N.D., 2007. “How leaders influence employees' innovative behaviour”. Emerald Group Publishing Limited: 761-771.
23. Hounsell, E.A., 1992. Invention in the Industrial Research Laboratory: Individual Act or Collective Process. In: Weber, R.J., D.N. Perkins, (Eds.). Inventive Minds: Creativity in Technology, Oxford University Press, New York, NY, pp: 273-91. 24. Jeroen, P.J. and N.D.H. Deanne, 2007. How leaders
influence employees' innovative behavior. Emerald Group Publishing Limited, pp: 761-771.
25. Kerrin, N., 1999. Managing Innovation and Change: A Critical Guide for Organizations, Thomson, London.
26. Delbridge, R. 1998. Life on the Line in Contemporary Manufacturing. International Journal Operational Production Management Oxford University Press, Oxford.
27. Womack, J.P and D.T. Jones, 1996. Lean Thinking. Emerald Group Publishing Studies, 30: 739-758. 28. Hicks, B.J, 2007. Understanding and eliminating
waste. Int. J. Informat. Manag., 27: 233-249. 29. Puvanasvaran, A.P., Ooi, M.H.M.A. Megat, S.H.
Tang, M.R. Muhamad and A.M.S. Hamouda, 2008b. Lean behavior among employees in Aerospace Company. J. Productivity, National Productivity Centre, Petaling Jaya, Malaysia, 25: 29-44.
![Fig. 1: Model of commitment to lean production[6]](https://thumb-ap.123doks.com/thumbv2/123dok/622194.75038/2.612.318.531.94.182/fig-model-commitment-lean-production.webp)
![Fig. 2: PDS Framework for enhance problem solving capabilities among employees[11]](https://thumb-ap.123doks.com/thumbv2/123dok/622194.75038/3.612.317.538.493.662/fig-pds-framework-enhance-problem-solving-capabilities-employees.webp)
![Table 1: An analytical framework for measuring problem solving capability in lean process management [11]](https://thumb-ap.123doks.com/thumbv2/123dok/622194.75038/4.612.76.537.97.365/analytical-framework-measuring-problem-solving-capability-process-management.webp)