Protein Adsorption at the Electri
fi
ed Air
−
Water Interface:
Implications on Foam Stability
Kathrin Engelhardt,
†Armin Rumpel,
†,‡Johannes Walter,
†Jannika Dombrowski,
§Ulrich Kulozik,
§Bjo
̈
rn Braunschweig,
†and Wolfgang Peukert
*
,†,‡†
Institute of Particle Technology (LFG), University of Erlangen-Nuremberg, Cauerstrasse 4, 91058 Erlangen, Germany
‡
Erlangen Graduate School in Advanced Optical Technologies (SAOT), University of Erlangen-Nuremberg, Paul-Gordan-Strasse 6, 91052 Erlangen, Germany
§
Chair for Food Process Engineering and Dairy Technology, Research Center for Nutrition and Food Sciences (ZIEL)−Department
Technology, Technische Universität München, Freising-Weihenstephan, Germany
ABSTRACT: The surface chemistry of ions, water molecules, and proteins as well as their ability to form stable networks in foams can influence and control macroscopic properties such
as taste and texture of dairy products considerably. Despite the significant relevance of protein adsorption at liquid interfaces,
a molecular level understanding on the arrangement of proteins at interfaces and their interactions has been elusive. Therefore, we have addressed the adsorption of the model protein bovine serum albumin (BSA) at the air−water
interface with vibrational sum-frequency generation (SFG) and ellipsometry. SFG provides specific information on the
composition and average orientation of molecules at interfaces, while complementary information on the thickness of the adsorbed layer can be obtained with ellipsometry. Adsorption of charged BSA proteins at the water surface leads to an electrified
interface, pH dependent charging, and electricfield-induced polar ordering of interfacial H
2O and BSA. Varying the bulk pH of
protein solutions changes the intensities of the protein related vibrational bands substantially, while dramatic changes in vibrational bands of interfacial H2O are simultaneously observed. These observations have allowed us to determine the isoelectric
point of BSA directly at the electrolyte−air interface for thefirst time. BSA covered air−water interfaces with a pH near the
isoelectric point form an amorphous network of possibly agglomerated BSA proteins. Finally, we provide a direct correlation of the molecular structure of BSA interfaces with foam stability and new information on the link between microscopic properties of BSA at water surfaces and macroscopic properties such as the stability of protein foams.
■
INTRODUCTIONFoams are materials of particular importance since they are applied in a broad range of applications such as metal foams for lightweight structures,1polymer foams for thermal insulation or foams in food products, just to mention a few. Although the chemical composition of these foams is largely different, they
share common similarities for foam formation and stabilization. The latter is controlled by adsorption processes at the interface between the gaseous and the surrounding solid or liquid phase. Therefore, it is of great importance to understand foam stabilization processes at interfaces in order to design advanced materials with tunable properties.2 Stabilization of protein foams is dominated by a molecular layer at the interface which can be controlled experimentally.3−6 For that reason, protein
foams represent a model system for mechanistic studies of foams and investigations on the origin that causes a liquid to foam. Hence, hierarchical studies of the relationship between molecular structure and interactions, interface design and macroscopic properties, has become an important part of current research in this field.7−9 A detailed molecular level
understanding of the surface chemistry of proteins at liquid interfaces has, however, not been established.
In order to reveal the interactions of proteins at interfaces, information on the interfacial composition, for example, the arrangement of ions and water molecules in the adjacent electrolyte subphase, possible protein unfolding processes, and the formation of single or multilayers, is imperative.10−13The
physical and chemical stability of proteins is influenced by
different factors such as temperature, chemical composition of
the electrolyte, and the pH of the bulk electrolyte.14While it seems to be accepted that structural rearrangement of proteins due to the adsorption to the interface can occur,15−18the extent
of unfolding or surface aggregation and a possible reversibility of this process are still a matter of considerable debate.9,19,20
The lack of molecular level information is mainly due to a lack of suitable experimental techniques that can actually reveal both composition as well as conformation of protein adlayers and other interfacial molecules such as H2O. In previous
studies, it was already shown that sum-frequency generation (SFG) is a powerful optical probe for the investigation of
Received: April 3, 2012 Revised: April 23, 2012 Published: April 24, 2012
protein interfaces.21−26 Wang et al.27 reported the pH
dependent charging of bovine serum albumin (BSA) at the air−liquid interface where the influence of pH on the SFG
spectra in the region of methyl and OH stretching vibrations was attributed to a charge reversal of interfacial BSA. As the surface charge of the proteins is affected by the electrolyte pH,
it leads to a strong electric field and, consequently, to the
formation of an electric double layer at the protein surface. The local electricfield of proteins and its effects on the surrounding
electrolyte layer is minimized at a pH where the net charge of the protein with bound ions is zero.28Obviously, this point is of great scientific interest as it is protein specific and is a function
of the amino acid sequence at the protein surface. Although the isoelectric point of proteins in the bulk electrolyte can be determined by zeta potential measurements, the conditions at electrolyte interfaces can be dramatically different from those in
the bulk. The concentrations of proteins, ions, and water molecules as well as their lateral interactions may be modified
significantly at an interface. Consequently, it is a priori not clear
if the isoelectric points of proteins at interfaces and in bulk electrolytes are identical.
In order to reveal the intriguing relationship between pH dependent charging of a protein, protein adsorption, interfacial molecular structure, and macroscopic properties such as foam stability, we have studied the model protein BSA at the electrified air−water interface with broadband SFG,
ellipsom-etry, and a macroscopic analysis of the foam stability. This hierarchical approach has enabled us to determine the interfacial isoelectric point as well as the structure of BSA layers adsorbed to the electrolyte−air interface. New
information on the link between microscopic properties of BSA at interfaces and macroscopic properties such as the stability of foams from BSA solutions is provided.
■
EXPERIMENTAL SECTIONSample Preparation. BSA (essentially acid free) was purchased from Sigma Aldrich (A7030) and was used as-received. BSA solutions (15μM for spectroscopic measurements, 150μM for zeta potential measurements) were prepared by dissolving the dry protein in ultrapure water (18.2 MΩcm−1; total oxidizable carbon < 10 ppb). The pH was adjusted by adding either HCl (Merck; Suprapur grade) or NaOH (99.99%; Alfa Aesar) and measured with an InLab Micro Pro pH electrode (Mettler Toledo). In order to remove possible contaminations, the necessary glassware was soaked in a mixture of concentrated sulfuric acid (98%; analytical grade) and NOCHROMIX for at least 24 h, thoroughly rinsed with ultrapure water, and subsequently cleaned in boiling ultrapure water. All measurements were performed at a temperature of 24°C.
Zeta Potential Measurements. Zeta potentials were measured with a commercial Zetasizer Nano ZS instrument (Malvern Instru-ments). The pH of 150μM BSA aqueous solutions was adjusted by adding either acid or base. The samples werefiltered using 0.2 μm
cellulose acetatefilters (VWR 514-0060) and thoroughly cleaned glass
syringes before transferring them into the cuvette. For every data point, at least four measurements with four different cuvettes were
performed. For good and reproducible zeta potential measurements, a minimum BSA concentration of approximately 150μM is needed. For that reason, 10-fold higher BSA concentrations have been chosen for measurements of the bulk zeta potential compared to ellipsometry and SFG measurements at air−water interfaces.
Ellipsometry. The thickness of adsorbed protein layers was determined with a phase modulated ellipsometer (Picometer Ellipsometer; Beaglehole Instruments) that was operated with a wavelength of 632.8 nm. Phase modulated ellipsometry offers the
possibility to record data near or at the Brewster angle (∼55°) of the studied system which increases the sensitivity considerably and enables
rapid acquisitions of experimental data compared to the conventional nulling technique.29For each experiment, 15μM BSA sample solution was poured into a Petri dish with a diameter of 10 cm and was allowed to equilibrate for about 30 min. Angle scans between 51° and 55° versus the surface normal were performed with a step width of 0.5°. In order to ensure reproducibility, at least six measurements were recorded and averaged for every pH value. Angle-resolved data from ellipsometry werefitted under the assumption of a three layer model
with refractive indices of 1.33, 1.40,12 and 1.00 for the electrolyte
subphase, the protein layer, and air, respectively. In general two parameters are unknown in this three layer system: the thickness of the adsorbed protein layer and the corresponding refractive index. Due to the fact that these parameters cannot be determined independently, one of them, for example, the refractive index, has to be chosen as a
fixed input parameter for all model calculations. Since the refractive
index of BSA at an interface is unknown, the latter assumption causes a systematic error of the layer thickness that depends on the deviation of the assumed refractive index from its actual value. However, since we only compare relative changes in the layer thickness as a function of the electrolyte pH, interpretations in this respect are not impaired.
Vibrational Sum-Frequency Generation (SFG). SFG is a second-order nonlinear optical technique30 where two laser beams are overlapped temporally and spatially at the interface of interest and generate photons with the sum frequency of the two impinging laser beams. One laser has a frequencyωVISin the visible region (800 nm), and the other laser is tunable in the infrared region with frequencies ωIR. The intensity of sum-frequency output I(ω) depends on the intensities of the impinging laser beamsIVISandIIRas well as on the nonresonantχNR(2)and resonantχk(2)parts of the second-order nonlinear susceptibilityχ(2)as follows:
∑
Foam Preparation and Characterization.Foaming experiments were carried out with a commercial dynamic foam analyzer DFA 100 (Krüss GmbH, Germany). Foams were produced in a glass column of 0.25 m length and 0.04 m thickness by a stream of air that was introduced into the protein dilutions through a porous glass filter
(pore size: 9−16 μm) with a constant flow rate of 5 mL/s.
Experiments were performed in triplicates. According to Glaser et al.,36stability and capacity are key parameters which can be used to characterize macroscopic foam properties. The foam capacity can be determined by the volume increase due to the foaming of the initial BSA dilution with a volumeViof 40 mL. In our experiments the foam capacity is given by the maximum (foam) volume (Vf) that is reached after 10 s of gasflow through the BSA dilution. Foam capacity [%] =
(Vf−Vi)/Vi×100. Subsequent to the formation, foam degradation given by the Foam stability [%] = (Vt=300s/Vt=0)×100 was monitored for an additional 300 s.
■
RESULTSDetermination of the Bulk Zeta Potential. The zeta potential is often used as stability parameter in colloidal chemistry whereby a potential larger than |30 mV| leads to stable suspensions.37In contrast to this, the zeta potential of proteins is determined to be mostly lower than|40 mV|28,38and is often used to determine the isoelectric point.39 The isoelectric point is defined as the point where the zeta potential
is equal to zero. At the isoelectric point, the protein carries no net charge, while there is an excess of positive or negative charge for pH values higher and lower than the pH of the isoelectric point, respectively. Previous studies of the BSA’s isoelectric point have shown that its exact determination is impaired by the applied experimental method and the background electrolyte. For that reason it is not surprising that isoelectric points between pH 4.7 and 5.6 have been reported.28
Figure 1 shows the zeta potential of BSA in a bulk solution as a function of the electrolyte pH. From a close inspection of
Figure 1, the pH of the isoelectric point of BSA can be determined to 5.2±0.1. Although the isoelectric point of BSA can be established in the bulk electrolyte, it is not a priori known whether the isoelectric points of bulk and surface regions are identical. In fact, the small electric charge of BSA near or at the isoelectric points leads to very small repulsion between individual proteins and therefore to the tendency of agglomeration and possibly to precipitation of BSA. Con-sequently, it is not clear if and how stable BSA layers can actually form at the air−water interface under these conditions.
To study this effect further, we will show the pH dependent
behavior of surface adsorbed BSA layers in the following sections.
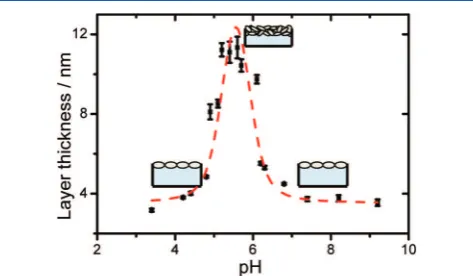
Ellipsometry. The use of ellipsometry enables us to investigate the pH effects on the thickness of adsorbed BSA
layers and to estimate the interfacial number density N of BSA. In Figure 2, the thickness of BSA layers adsorbed to the air−
water interface is presented as a function of electrolyte pH. For acidic conditions, the thickness first increases with increasing
pH, reaches a pronounced maximum at pH∼5.5, and decreases
subsequently for higher pH values. Obviously, pH values near the bulk isoelectric point (see previous section) lead to much thicker BSA layers as compared to more acidic or alkaline conditions.
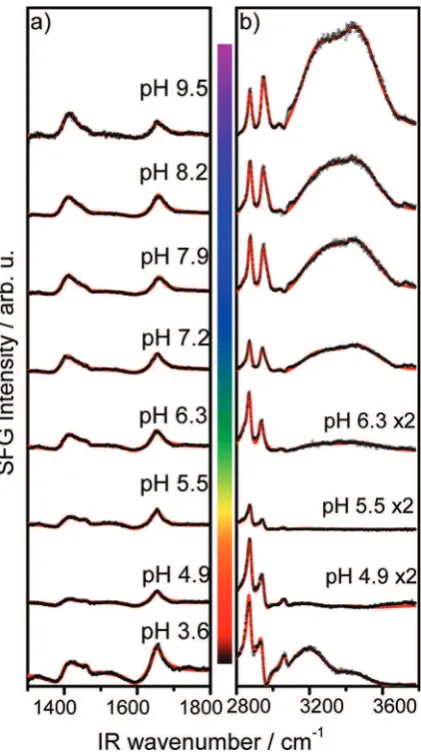
Assignment of Vibrational Bands in SFG Spectra.To gain further insight in the molecular structure of the interface, vibrational SFG spectra were recorded in the entire spectral region of 1000−3700 cm−1. To the best of our knowledge these
are the first vibrational SFG spectra of a protein that were
measured in such a broad spectral region. This approach allows us to identify vibrational fingerprints of BSA and interfacial
water molecules and to select specific regions of interest where
changes with the electrolyte pH are most pronounced. Figure 3 shows vibrational SFG spectra of BSA adsorbed to the air−water interface for pH values of 8.2 and 4.3. A close
comparison of the spectra reveals that they are dominated by
Figure 1.Zeta potential of BSA as a function of the electrolyte pH.
Lines are a guide to the eye.
Figure 2.Thickness of adsorbed BSA layers at the air−water interface
as a function of the electrolyte pH. As explained in the text, the thickness was determined by ellipsometry under the assumption of a simple water−BSA−air layer model. The dashed line is a guide to the eye.
Figure 3.Vibrational SFG spectra of BSA at air−water interfaces for
pH 8.2 and 4.3. Solid lines are fits to the experimental data as
vibrational bands in unique spectral regions where substantial changes as a function of the electrolyte pH can be observed:
(I) Functional groups of adsorbed BSA give rise to strong vibrational bands at ∼2875 and ∼2936 cm−1 that are
attributable to CH3 symmetric stretching vibrations and to
the CH3 Fermi resonance, respectively. Furthermore, CH3
asymmetric, symmetric CH2, and aromatic CH stretching
vibrations give rise to bands at 2964, 2850, and 3060 cm−1,
respectively.27,31−33Strong bands between 3100 and 3800 cm−1
originate from OH stretching vibrations of interfacial water molecules.34,40,41
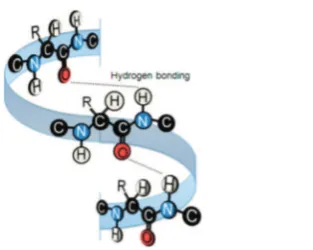
(II) In a second spectral region, additional vibrational bands of interfacial BSA at∼1654 and 1410 cm−1are observed and
can be attributed to amide I and to carboxylate (R−COO−)
symmetric stretching vibrations, respectively.42,43 The amide I
band originates from R−CO carbonyl vibrations of
molecular groups in the protein backbone44−48 where they
can form hydrogen bonds to neighboring amide groups49,50 (Figure 4).
The strength of the hydrogen bonds influences the frequency
of the amide I band greatly and is, therefore, strongly dependent on the secondary structure of the protein. In previous IR studies, changes in the position of this band were often referred to denaturation, unfolding, or aggregation processes.51,52 Since BSA consists mainly of an α-helical structure, unfolding would lead to a blue shift in the amide I frequency. As was previously shown, the spectral frequencies of amide I vibrations can be attributed to different secondary
structures42,53 and the kinetics of conformational changes was also resolved with SFG.54
At this point, it should be noted that the so-called amide II band at ∼1550 cm−1 that can be observed with linear IR
spectroscopy50,55contributes only weakly to the SFG intensity. Prerequisite for an SFG active mode is both Raman as well as IR activity. Since the amide II mode does lead to weak Raman resonances only,56weak resonant SFG contributions from this band are also likely. Furthermore, the amide II band is a combination of C−N stretch and N−H bending vibrations and
has a dynamic dipole moment that is perpendicular to the dipole moment of the amide I band (Figure 4). As a result, the intensity of this band is additionally weakened due to weaker excitations with p polarized IR light.
(III) In the spectral region below 1400 cm−1, a band
centered at∼1250 cm−1is observed and has been attributed to
amide III vibrations.56,57Three weak bands at∼1140,∼1070,
and ∼1020 cm−1 are also observed in our spectra, which we
relate to −C−O− stretching modes, N−H deformation, and
CH aromatic bending vibrations.58Since substantial changes as a function of the bulk pH are observed for CH, OH, amide I, and carboxylate vibrations (Figure 3), we have focused further pH dependent studies to the latter vibrations. An overview of the SFG active BSA resonances relevant to the further discussion and their attribution to specific molecular vibrations
can be found in Table 1.
pH Dependence of the Interfacial Molecular Struc-ture. In order to reveal changes in the interfacial molecular structure, SFG spectra of BSA adsorbed to the air−water
interface were recorded and analyzed for pH values of 3−10.
Figure 5 shows representative SFG spectra in this pH range. OH, CH, and amide I bands have strong pH dependencies. In particular, for the OH stretching bands of interfacial water molecules, we observe dramatic changes in the SFG intensity (Figure 5b).
At a pH of 5.5, the SFG intensity of the H2O bands is
negligible, but increases substantially for lower and higher pH values than 5.5. Similar but less pronounced behavior is observed for the SFG intensity in the CH stretching region. Compared to the latter bands, BSA amide I and carboxylate modes show much weaker changes in SFG intensity with the pH (Figure 5a). In order to analyze changes of SFG bands as a function of pH, we havefitted our spectra with model functions
according to eq 1 and determined the amplitude of the vibrational bands in our SFG spectra. We have used the amplitude Ak, the resonance frequencies ωk, and the
non-resonant contribution χNR(2) as adjustable parameters in our
fitting procedures. Here, the overview spectra in Figure 3 are
extremely helpful, since the nonresonant contribution and its influence on the dispersion of the vibrational resonances can be
easily estimated.
In Figure 6a, b, and c, the results of ourfitting procedures are
presented for the amplitudes of amide I, carboxylate (R−
COO−), and OH vibrations, respectively. The pH dependence
of the three amplitudes shows a local minimum around pH 5. While the amplitudes of amide I and carboxylate bands have a narrow minimum at pH 5 and are only slightly smaller for more alkaline than for acidic pH values, the amplitude of OH vibrations is also minimal at pH 5, but varies in a much broader pH range. Nearly all carboxyl groups with a pKof 4.3 from the amino acid side chains of BSA59 are deprotonated in the studied pH range and exist as carboxylates. This causes the amplitudes of the R−COO−vibration to stay nearly constant.
However, since the density of these groups at the interface
Figure 4.Schematic representation of amide groups and their local
orientation in a protein with anα-helix secondary structure.
Table 1. Assignment of Vibrational Bands in SFG Spectra of
BSA Adsorbed to the Air−Water Interface
a
band [cm−1] ref
amide III 1250 57
COO−(ss) 1410 43
amide II 1550 50
amide I 1650 48, 53
CH2(ss) 2850 31−33
CH3(ss) 2875 31−33
CH3(F) 2936 31−33
arom. CH 3060 31−33
OH (ss) 3200 40, 41
OH (ss) 3450 40, 41
a(F), (ss), and (as) stand for Fermi resonance, symmetric, and
increases (Figure 2), the observed change in SFG amplitude is a signature of a decrease in interfacial polar order that will be discussed in more detail in the following section.
The vibrational band of interfacial H2O shows a dramatic
decrease in amplitude for pH 3−5 with a subsequent dramatic
increase of almost 1 order of magnitude (Figure 6c). However, not only the amplitudes of the vibrational bands change, but there is also a notable change in the polarity of the band at
∼3060 cm−1due to aromatic CH stretching vibrations. At pH <
5, this band appears as a positive going feature, while for pH > 5 a negative going feature is observed (Figure 5b). These changes are not directly related to the∼3060 cm−1band but to
a change in the orientation of the interfacial water molecules. The phases of the broad OH stretching bands are rotated by 180°, and according to eq 1 the spectral interference of H2O
and CH bands is altered. The change in the average orientation of the interfacial water molecules points to a charge reversal of the interface and, consequently, to a reversal of the electricfield
that causes the polar ordering of H2O at the interface. This
result confirms previous SFG studies of BSA adsorption by
Wang et al.27
■
DISCUSSIONWe will now compare the observed pH effects of adsorbed BSA
adlayers from ellipsometry with SFG measurements and the zeta potential of BSA in the bulk electrolyte. It is obvious that the bulk isoelectric point of BSA at pH 5.2 with a zeta potential equal to zero (Figure 1) clearly corresponds to a minimum in SFG amplitudes of the BSA and interfacial H2O related bands
(Figure 6), but to a maximum in the thickness of adsorbed BSA adlayers (Figure 2). In fact, our ellipsometry results indicate the presence of multilayers for pH values near the bulk isoelectric point and are in agreement with previous neutron reflection
studies of BSA at air−water interfaces. In their report, Lu et al.
have estimated the adsorbate thickness to approximately 7 nm and a reduced thickness of approximately 4 nm for pH values higher or lower than the bulk isoelectric point.11Modeling the geometric dimensions of BSA by a simple incompressible ellipsoid, thicknesses of ∼4 nm in Figure 2 point to a
monolayer of adsorbed BSA proteins with their long axis oriented parallel to the interface.12Threefold thicker layers at a pH near 5 are also observed (Figure 2) and suggest the formation of multilayers. Although we observe a seemingly
Figure 5.Vibrational SFG spectra of BSA at air−water interfaces as a
function of the electrolyte pH: (a) Symmetric carboxylate (R-COO−) and amide I bands and (b) CH and OH stretching bands as explained in the text (Table 1). The pH was as indicated in thefigure. Solid lines
arefits to the experimental data according to eq 1. The color scale
represents schematically the interfacial charge density as a function of the pH.
Figure 6. pH dependence of the amide I (a) and carboxylate R−
opposite behavior of SFG amplitudes and adsorbate thickness, it can be concluded that the isoelectric points of bulk and interfacial BSA proteins are identical. pH values at the isoelectric point of the interface lead to a highly disordered electrolyte subphase and BSA (multi)layers with a low degree of order:
We recall that the SFG amplitude Akis dependent on both
the number density of interfacial molecules and their molecular order. In the present case, the contribution of the number density to the SFG amplitudes is only minor otherwise the amplitude should reach a maximum at a pH where the thickness of the BSA adlayer is also maximal. Since we observe the opposite, signals in SFG spectra must be dominated by the interfacial molecular order. At a pH near the bulk isoelectric point, the net charge of BSA proteins is negligible and a macroscopic electricfield at the interface is absent. As the pH
increases or decreases with respect to the isoelectric point of BSA, the charge density and, consequently, the electricfield of
the interface increase. As a result, polar ordering of interfacial water molecules and BSA is induced by the interfacial electric
field. Further support for this hypothesis comes from SFG
experiments at electrified oxide interfaces where electric fi
eld-induced polar ordering of interfacial water molecules was shown.40,41,60,61
Observations of field induced polar ordering in vibrational
SFG are, consequently, directly related to the strength of the interfacial electricfield and allow an estimate of the isoelectric
point of the interface. At this point, it should be noted that electrokinetic zeta potential measurements and SFG spectros-copy actually probe different physical properties which,
however, have their physical origin both in the charge distribution at the surface. The zeta potential refers to the electric potential at the hydrodynamic shear (or slipping) plane. The slipping plane separates ions (if present) and solvent molecules which travel with the migrating protein from those in the diffuse layer that do not travel with the charged protein in
an external electric field. In contrast, SFG probes the average
orientation of molecules within the interfacial electric field.
Since the amide I band originates from molecular groups in the interior of the protein (see above), pH effects on polar ordering
must be related to the net charge of the protein surface which is also determined by the charge of possible bound counterions in the adjacent Stern layer. The physical origins of polar ordering as seen in SFG and in the zeta potential are, thus, identical. The remarkable resemblance of amide I, carboxylate (R−COO−),
and OH amplitudes in Figure 6 also signifies a similar origin for
the latter bands.
For pH values near the isoelectric point, BSA adsorption is controlled by a gain in entropy and the formation of attractive noncovalent interactions such as van der Waals forces and hydrogen bonds of the BSA hydration shell. The situation is different for pH values of <4.6 and >6.7 where electrostatic
forces dominate and lead to a polar ordered BSA monolayer. In order to establish multiple BSA layers at the interface, the lateral interactions between individual BSA proteins have to be attractive. In fact, the absence of a strong electric charge at the BSA surface, as it is suggested by the zeta potential of BSA in the bulk, leads to weak repulsive electrostatic interactions and consequently to an agglomerated BSA adlayer. At the isoelectric point, the orientation of adsorbed BSA is, however, not completely random since the nonzero SFG amplitudes of amide I and carboxylate vibrations indicate that to some extent a preferential orientation of BSA is maintained. This observation
can be rationalized in terms of hydrophilic−hydrophobic
interactions, where the hydrophobic parts of the BSA proteins tend to protrude into the gas phase. In contrast to the protein layer, the interfacial water molecules are highly disordered and lead to negligible SFG amplitudes (Figure 6c).
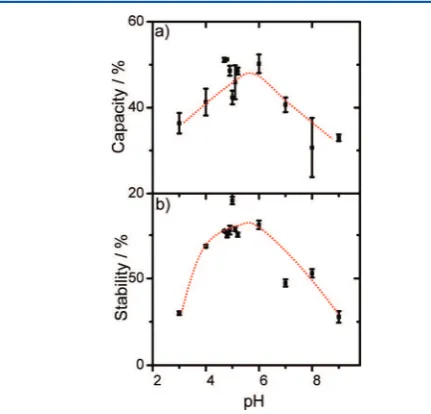
Having established the interfacial molecular structure, we can now deduce (to some extent) macroscopic properties such as foam stability and foam capacity. Prerequisite for good foam formation is a fast diffusion of the proteins to the interface,
where they can build a viscoelastic adsorbed layer around the gas bubbles and prevent destabilization of the foam lamella.62 As we have shown, at the interfacial isoelectric point of BSA, a network of agglomerated proteins is formed and held together by weak attractive forces, while at a pH more alkaline or more acidic than the isoelectric point BSA forms monolayers with repulsive interactions. It is therefore likely that producing BSA foams at the isoelectric point will lead to foams with higher stability.
We have tested this hypothesis with macroscopic foams from BSA dilutions. The results for foam capacity, which describes the ability of a protein solution to enclose air, and foam stability measurements are shown in Figure 7a and b, respectively. Both
the foam capacity and stability show a clear maximum around pH 5 (Figure 7). Obviously, a network of agglomerated protein multilayers can encapsulate the air and prevent the foam from drainage much more efficiently than ordered protein
monolayers with repulsive interactions.
■
SUMMARY AND CONCLUSIONNew information on molecular processes at interfaces and macroscopic phenomena of soft matter is provided. For that purpose, we have addressed the surface chemistry of the protein bovine serum albumin (BSA) at the air−water interface and the
effect of pH. Combining ellipsometry and broadband
sum-frequency generation (SFG) has allowed us to reveal the molecular composition and molecular order of BSA adlayers and the electrolyte subphase in unprecedented detail. pH dependent charging of BSA leads to the formation of electrified
interfaces and to polar ordering of interfacial BSA and H2O.
Using the latter as a measure of the electricfield at the interface,
Figure 7.Foam capacity (a) and stability (b) as a function of pH.
we have deduced the isoelectric point of BSA at air−water
interfaces to pH∼5, which is close to that of bulk BSA. The
molecular level information presented in this study can explain the high foam stability around pH 5, which was determined in additional experiments: Around pH 5, disordered multilayers are present at the interface and form an agglomerated network of BSA proteins that can be used to form macroscopic foams with excellent stability. Here, BSA agglomerates stabilize gas bubbles at the ubiquitous air−water interface extremely
efficiently and prevent the foam from drainage. For pH values
smaller or larger than the isoelectric point, BSA monolayers with repulsive interactions are formed and lead to a decreased stability of BSA foams.
■
AUTHOR INFORMATIONCorresponding Author
*E-mail: [email protected].
Notes
The authors declare no competingfinancial interest.
■
ACKNOWLEDGMENTSThe authors gratefully acknowledge funding of the Erlangen Graduate School in Advanced Optical Technologies (SAOT) and by the German National Science Foundation (DFG) through the Leibniz program and project PE427/21-1. B.B. is grateful for support by the Alexander von Humboldt foundation and a Feodor Lynen fellowship. J.D. is grateful for support by the German Ministry of Economics and Technology (via AiF) and the FEI (Forschungskreis der Ernahrungsindus-̈
trie e. V., Bonn), project AiF 17124 N.
■
REFERENCES(1) Lefebvre, L.-P.; Banhart, J.; Dunand, D. C. Porous Metals and Metallic Foams: Current Status and Recent Developments.Adv. Eng. Mater.2008,10, 775−787.
(2) Fameau, A.-L.; Saint-Jalmes, A.; Cousin, F.; Houinsou-Houssou, B.; Novales, B.; Navailles, L.; Nallet, F.; Gaillard, C.; Boué, F.; Douliez, J.-P. Smart Foams: Switching Reversibly between Ultrastable and Unstable Foams.Angew. Chem.2011,123, 8414−8419.
(3) Mezzenga, R.; Schurtenberger, P.; Burbidge, A.; Michel, M. Understanding foods as soft materials.Nat. Mater.2005,4, 729−740. (4) Schramm, L. L. Emulsions, foams, and suspensions: Fundamental and applications; Wiley-VCH Verlag GmbH & Co. KGaA: Weinheim, 2005.
(5) Townsend, A.-A.; Nakai, S. Relationships Between Hydro-phobicity and Foaming Characteristics of Food Proteins.J. Food Sci.
1983,48, 588−594.
(6) Foegeding, E. A.; Luck, P. J.; Davis, J. P. Factors determining the physical properties of protein foams. Food Hydrocolloids 2006, 20, 284−292.
(7) Tolstoguzov, V. Foods As Dispersed Systems. Thermodynamic aspects of composition-property relationships in formulated food.J. Therm. Anal. Calorim.2000,61, 397−409.
(8) Goff, H. D., Vega, C. Structure-engineering of ice-cream and
foam-based foods. InUnderstanding and controlling the microstructure of complex foods; McClements, D. J., Ed.; CRC Press; Woodhead Pub.: Cambridge, 2007.
(9) Wierenga, P. A.; Gruppen, H. New views on foams from protein solutions.Curr. Opin. Colloid Interface Sci.2010,15, 365−373.
(10) Miller, R.; Fainerman, V. B.; Wüstneck, R.; Krägel, J.; Trukhin, D. V. Characterisation of the initial period of protein adsorption by dynamic surface tension measurements using different drop
techniques.Colloids Surf., A1998,131, 225−230.
(11) Lu, J. R.; Su, T. J.; Penfold, J. Adsorption of Serum Albumins at the Air/Water Interface.Langmuir1999,15, 6975−6983.
(12) McClellan, S. J.; Franses, E. I. Effect of concentration and
denaturation on adsorption and surface tension of bovine serum albumin.Colloids Surf., B2003,28, 63−75.
(13) Stocco, A.; Drenckhan, W.; Rio, E.; Langevin, D.; Binks, B. P. Particle-stabilised foams: an interfacial study. Soft Matter 2009, 5, 2215−2222.
(14) Wang, W. Instability, stabilization, and formulation of liquid protein pharmaceuticals.Int. J. Pharm.1999,185, 129−188.
(15) Douillard, R. Kinetics of lysozyme adsorption at the air-buffer
interface.Thin Solid Films1997,292, 169−172.
(16) Miller, R.; Fainerman, V. B.; Makievski, A. V.; Krägel, J.; Grigoriev, D. O.; Kazakov, V. N.; Sinyachenko, O. V. Dynamics of protein and mixed protein/surfactant adsorption layers at the water/
fluid interface.Adv. Colloid Interface Sci.2000,86, 39
−82.
(17) Tripp, B. C.; Magda, J. J.; Andrade, J. D. Adsorption of Globular Proteins at the Air/Water Interface as Measured via Dynamic Surface Tension: Concentration Dependence, Mass-Transfer Considerations, and Adsorption Kinetics.J. Colloid Interface Sci.1995,173, 16−27.
(18) Tronin, A.; Dubrovsky, T.; Dubrovskaya, S.; Radicchi, G.; Nicolini, C. Role of Protein Unfolding in Monolayer Formation on Air-Water Interface.Langmuir1996,12, 3272−3275.
(19) Felsovalyi, F.; Mangiagalli, P.; Bureau, C.; Kumar, S.; Banta, S. Reversibility of the Adsorption of Lysozyme on Silica.Langmuir2011, 27, 11873−11882.
(20) Desfougères, Y.; Saint-Jalmes, A.; Salonen, A.; Viés, V.; Beaufils,
S.; Pezennec, S.; Desbat, B.; Lechevalier, V.; Nau, F. Strong Improvement of Interfacial Properties Can Result from Slight Structural Modifications of Proteins: The Case of Native and
Dry-Heated Lysozyme.Langmuir2011,27, 14947−14957.
(21) Kim, G.; Gurau, M.; Kim, J.; Cremer, P. S. Investigations of Lysozyme Adsorption at the Air/Water and Quartz/Water Interfaces by Vibrational Sum Frequency Spectroscopy. Langmuir 2002, 18, 2807−2811.
(22) Fick, J.; Wolfram, T.; Belz, F.; Roke, S. Surface-Specific
Interaction of the Extracellular Domain of Protein L1 with Nitrilotriacetic Acid-Terminated Self-Assembled Monolayers. Lang-muir2009,26, 1051−1056.
(23) Kim, J.; Somorjai, G. A. Molecular Packing of Lysozyme, Fibrinogen, and Bovine Serum Albumin on Hydrophilic and Hydrophobic Surfaces Studied by Infrared−Visible Sum Frequency Generation and Fluorescence Microscopy. J. Am. Chem. Soc. 2003, 125, 3150−3158.
(24) Wang, J.; Chen, X.; Clarke, M. L.; Chen, Z. Detection of chiral sum frequency generation vibrational spectra of proteins and peptides at interfaces in situ.Proc. Natl. Acad. Sci. U.S.A.2005,102, 4978−4983. (25) Thennarasu, S.; Huang, R.; Lee, D.-K.; Yang, P.; Maloy, L.; Chen, Z.; Ramamoorthy, A. Limiting an Antimicrobial Peptide to the Lipid−Water Interface Enhances Its Bacterial Membrane Selectivity: A Case Study of MSI-367.Biochemistry2010,49, 10595−10605.
(26) Nguyen, K. T.; Soong, R.; lm, S.-C.; Waskell, L.; Ramamoorthy, A.; Chen, Z. Probing the Spontaneous Membrane Insertion of a Tail-Anchored Membrane Protein by Sum Frequency Generation Spec-troscopy.J. Am. Chem. Soc.2010,132, 15112−15115.
(27) Wang, J.; Buck, S. M.; Chen, Z. Sum frequency generation vibrational spectroscopy studies on protein adsorption.J. Phys. Chem. B2002,106, 11666−11672.
(28) Salis, A.; Boström, M.; Medda, L.; Cugia, F.; Barse, B.; Parsons, D. F.; Ninham, B. W.; Monduzzi, M. Measurements and Theoretical Interpretation of Points of Zero Charge/Potential of BSA Protein. Langmuir2011,27, 11597−11604.
(29) Tompkins, H. G.; Irene, E. A.Handbook of ellipsometry; William Andrew Pub; Springer: Norwich, NY, Heidelberg, Germany, 2005.
(30) Shen, Y. R.The principles of nonlinear optics; John Wiley & Sons: New York,1984.
(31) Wang, J.; Buck, S. M.; Chen, Z. The effect of surface coverage
(32) Chen, X.; Flores, S. C.; Lim, S.-M.; Zhang, Y.; Yang, T.; Kherb, J.; Cremer, P. S. Specific Anion Effects on Water Structure Adjacent to
Protein Monolayers.Langmuir2010,26, 16447−16454.
(33) Chen, X.; Yang, T.; Kataoka, S.; Cremer, P. S. Specific Ion
Effects on Interfacial Water Structure near Macromolecules. J. Am.
Chem. Soc.2007,129, 12272−12279.
(34) Kim, J.; Cremer, P. S. Elucidating Changes in Interfacial Water Structure upon Protein Adsorption. ChemPhysChem 2001, 2, 543− 546.
(35) Rumpel, A.; Novak, M.; Walter, J.; Braunschweig, B.; Halik, M.; Peukert, W. Tuning the molecular order of C60 functionalized phosphonic acid monolayers.Langmuir2011,27, 15016−15023.
(36) Glaser, L. A.; Paulson, A. T.; Speers, R. A.; Yada, R. Y.; Rousseau, D. Foaming behavior of mixed bovine serum albumin− protamine systems.Food Hydrocolloids2007,21, 495−506.
(37) Heurtault, B.; Saulnier, P.; Pech, B.; Proust, J.-E.; Benoit, J.-P. Physico-chemical stability of colloidal lipid particles.Biomaterials2003, 24, 4283−4300.
(38) Anema, S. G.; Klostermeyer, H.ζ-Potentials of casein micelles from reconstituted skim milk heated at 120°C.Int. Dairy J.1996,6, 673−687.
(39) Jachimska, B.; Wasilewska, M.; Adamczyk, Z. Characterization of Globular Protein Solutions by Dynamic Light Scattering, Electro-phoretic Mobility, and Viscosity Measurements. Langmuir2008,24, 6866−6872.
(40) Richmond, G. L. Molecular Bonding and Interactions at Aqueous Surfaces as Probed by Vibrational Sum Frequency Spectros-copy.Chem. Rev.2002,102, 2693−2724.
(41) Shen, Y. R.; Ostroverkhov, V. Sum-Frequency Vibrational Spectroscopy on Water Interfaces: Polar Orientation of Water Molecules at Interfaces.Chem. Rev.2006,106, 1140−1154.
(42) Wang, J.; Even, M. A.; Chen, X.; Schmaier, A. H.; Waite, J. H.; Chen, Z. Detection of Amide I Signals of Interfacial Proteins in Situ Using SFG.J. Am. Chem. Soc.2003,125, 9914−9915.
(43) Braunschweig, B.; Mukherjee, P.; Kutz, R. B.; Wieckowski, A.; Dlott, D. D. Sum-frequency generation of acetate adsorption on Au and Pt surfaces: Molecular structure effects.J. Chem. Phys.2010,133,
234702−234708.
(44) Byler, D. M.; Susi, H. Examination of the secondary structure of proteins by deconvolved FTIR spectra.Biopolymers1986,25, 469− 487.
(45) Wang, J.; Chen, X.; Clarke, M. L.; Chen, Z. Vibrational Spectroscopic Studies on Fibrinogen Adsorption at Polystyrene/ Protein Solution Interfaces: Hydrophobic Side Chain and Secondary Structure Changes.J. Phys. Chem. B2006,110, 5017−5024.
(46) Clarke, M. L.; Wang, J.; Chen, Z. Conformational Changes of Fibrinogen after Adsorption. J. Phys. Chem. B 2005, 109, 22027− 22035.
(47) Yang, P.; Ramamoorthy, A.; Chen, Z. Membrane Orientation of MSI-78 Measured by Sum Frequency Generation Vibrational Spectroscopy.Langmuir2011,27, 7760−7767.
(48) Wang, J.; Clarke, M. L.; Chen, X.; Even, M. A.; Johnson, W. C.; Chen, Z. Molecular studies on protein conformations at polymer/ liquid interfaces using sum frequency generation vibrational spectros-copy.Surf. Sci.2005,587, 1−11.
(49) Knoesen, A.; Pakalnis, S.; Wang, M.; Wise, W.; Lee, N.; Frank, C. Sum-frequency spectroscopy and imaging of aligned helical polypeptides. IEEE J. Sel. Top. Quantum Electron. 2004, 10, 1154− 1163.
(50) Barth, A.; Zscherp, C. What vibrations tell about proteins.Q. Rev. Biophys.2002,35, 369−430.
(51) Murayama, K.; Tomida, M. Heat-Induced Secondary Structure and Conformation Change of Bovine Serum Albumin Investigated by Fourier Transform Infrared Spectroscopy.Biochem.2004,43, 11526− 11532.
(52) Shanmugam, G.; Polavarapu, P. L. Vibrational circular dichroism spectra of protein films: thermal denaturation of bovine serum
albumin.Biophys. Chem.2004,111, 73−77.
(53) Liu, Y.; Jasensky, J.; Chen, Z. Molecular Interactions of Proteins and Peptides at Interfaces Studied by Sum Frequency Generation Vibrational Spectroscopy.Langmuir2012,28, 2113−2121.
(54) Fu, L.; Ma, G.; Yan, E. C. Y. In Situ Misfolding of Human Islet Amyloid Polypeptide at Interfaces Probed by Vibrational Sum Frequency Generation.J. Am. Chem. Soc.2010,132, 5405−5412.
(55) Haris, P. I.; Severcan, F. FTIR spectroscopic characterization of protein structure in aqueous and non-aqueous media.J. Mol. Catal. B: Enzymatic1999,7, 207−221.
(56) Socrates, G.Infrared and Raman characteristic group frequencies: Tables and charts, 3rd ed.; John Wiley & Sons: Chichester [u.a.], 2004. (57) Lin, V. J. C.; Koenig, J. L. Raman studies of bovine serum albumin.Biopolymers1976,15, 203−218.
(58) Yu, N.; Jo, B. H. Comparison of protein structure in crystals and in solution by laser Raman scattering: I. Lysozyme.Arch. Biochem. Biophys.1973,156, 469−474.
(59) Peters, T.All about albumin: Biochemistry, genetics, and medical applications; Academic Press: San Diego, 1996.
(60) Sung, J.; Zhang, L.; Tian, C.; Shen, Y. R.; Waychunas, G. A. Effect of pH on the Water/α-Al2O3(1102) Interface Structure Studied
by Sum-Frequency Vibrational Spectroscopy.J. Phys. Chem. C2011, 115, 13887−13893.
(61) Braunschweig, B.; Eissner, S.; Daum, W. Molecular Structure of a Mineral/Water Interface: Effects of Surface NanoRoughness of
α-Al2O3(0001).J. Phys. Chem. C2008,112, 1751−1754.