Biophysical Journal Volume 74 April 1997 1861-1877
Molecular
Distances from
Dipolar Coupled
Spin-Labels:
The
Global
Analysis of
Multifrequency
Continuous Wave Electron Paramagnetic
Resonance Data
Eric J. Hustedt,*
Alex
1. Smirnov,#
Charles
F.
Laub,*
Charles
E.
Cobb,*
and Albert
H.
Beth*
*DepartmentofMolecular Physiologyand
Biophysics,
VanderbiltUniversity, Nashville,
Tennessee37232,
and#Illinois
EPRResearch Center, UniversityofIllinoisatUrbana, Urbana,
Illinois 61801 USAABSTRACT
For immobilized nitroxide
spin-labels
with
awell-defined
interprobe
geometry,
resolved
dipolar
splittings
canbe
observed in continuous
waveelectron
paramagnetic
resonance(CW-EPR)
spectra
for interelectron distances
aslarge
as30
A
using
perdeuterated
probes.
In
this
work,
algorithms
aredeveloped
for
calculating
CW-EPR spectra
of
immobilized,
dipolar
coupled nitroxides,
and then used
todefine the limits of
sensitivity
tothe
interelectron distance
as afunction
of
geometry
and
microwave
frequency.
Secondly,
the
CW-EPR
spectra of
N6-spin-labeled
coenzyme
NAD+
bound
tomicrocrystalline,
tetrameric
glyceraldehyde-3-phosphate
dehydrogenase
(GAPDH)
have been collected
at9.8, 34,
and 94
GHz.
These data
have been
analyzed, using
acombination of
simulated
annealing
and
global analysis,
toobtain
aunique
fit
tothe
data. The
values of the internitroxide distance and the five
angles
defining
the
relative orientation of the
twonitroxides
arein reasonable
agreement with
amolecular model built from the known
crystal
structure.Finally,
the
effect of
rigid
body isotropic
rotational
diffusion
onthe
CW-EPR spectra of
dipolar coupled
nitroxides has been
investigated using
analgorithm
based
onBrownian
dynamics trajectories. These
calculations demonstrate
the
sensitivity
of
CW-EPR
spectra
todipolar coupling
in
the presence
of
rigid
body
rotational
diffusion.
INTRODUCTION
Nitroxide spin-labels have been used with
great success
in
a
number
of recent studies
to
determine structural
features
of
soluble and membrane-bound proteins (Hubbell and
Alten-bach, 1994; Hubbell
et
al.,
1996;
Millhauser, 1992).
An
emerging
general
method,
called
site-directed spin-labeling,
takes
advantage
of the
power
of molecular
biological
ap-proaches
to
introduce unique labeling sites into proteins of
interest through
site-directed
mutagenesis. These
sites,
usu-ally cysteine residues,
are
then
covalently
reacted with
nitroxide
spin-labeling
reagents,
which have
high
specific-ity for the thiol side-chain of cysteine. Hubbell and
co-workers have developed
a
strategy for
determining
the
structural
environment
near
the
labeled
residue through
straightforward analysis
of the
continuous
wave
electron
paramagnetic resonance
(CW-EPR) lineshape
and through
measurement
of the accessibility of the labeled side chain
to
various paramagnetic
broadening
agents.
By constructing
a
series of
single
cysteine mutants, elements of secondary,
tertiary,
and
quaternary
structure
of both soluble and
mem-brane-bound
proteins
can
be mapped using this approach.
A
number of proteins have been
investigated
using
site-di-rected
spin-labeling
including
bacteriorhodopsin
(Altenbach
et
al., 1990), rhodopsin
(Farahbakhsh
et
al., 1995), the
transmembrane domain of diphtheria toxin
(Oh et al.,
1996),
Receivedfor publication 18 October 1996 and in final form 10 January
1997.
Address reprintrequests to Dr. Albert H. Beth, Department of Molecular
Physiology andBiophysics, 727Light Hall, Vanderbilt University,
Nash-ville, TN 37232-0615. Tel.: 615-322-4235; Fax: 615-322-7236; E-mail:
C 1997 bytheBiophysical Society
0006-3495/97/04/1861/17 $2.00
T4
lysozyme (Mchaourab
etal., 1996),
colicin El (Shin
etal.,
1993), Fep
A
receptor
(Liu
etal., 1994),
lactose
per-mease(Voss
etal., 1996),
and
helical peptides (Miick
et
al.,
1992),
with
moreapplications rapidly being developed
in
many laboratories.
Recently,
Millhauser
and
co-workers
have
synthesized
helical
peptides doubly
labeled
with
arigid spin-labeled glycine derivative,
TOAC (Hanson
et
al.,
1996a,b).
Both exchange-coupled
and
dipolar-broadened
spectra have
been
observed from these
peptides.
An
important
aspect
of
site-directed spin-labeling
is the
development
of methods for localizing elements
of
protein
secondary
structure
relative
to one
another. One
approach
that has
recently
been
used with some success is the
mea-surementof the
distance between
two
spin-labels
via
anal-ysis
of the
dipolar coupling between
the two
probes
(Hub-bell
etal., 1996).
The measurement of
molecular distances
using
the
magnitude
and
characteristics
of
spin-spin
inter-actions
is well
established
in the
scientific literature
(Luck-hurst, 1976;
Eaton
and
Eaton, 1989). This method can be
applied
toprotein
structure
determination
if two
nitroxides
are
site-specifically
incorporated into
a
protein through any
combination
of
site-directed spin-labeling and the
binding
of
spin-labeled high-affinity ligands. Analytical methods
have been developed
for the
determination
of
nitroxide-nitroxide distances from CW-EPR spectra
of
labeled
pro-teins
(Eaton
and
Eaton, 1989;
Beth et
al., 1984; Rabenstein
and
Shin, 1995).
In
addition, many previous
applications
have focused upon measuring distances between
paramag-netic metals and
nitroxide spin-labels (Eaton
et al.,
1983;
Eaton
and
Eaton, 1989; Voss
et
al., 1995a,b). Finally,
a
number of
groups
have
developed time-domain EPR
tech-niques suitable
for the
measurement
of
electron spin-spin
distances
in solid
samples (Pfannebecker
et
al., 1996;
Volume 74 April 1997
ena
and
Freed,
1996; Rakowsky
et
al., 1995;
Larsen and
Singel, 1993; Raitsimring
et
al., 1992).
In
general
terms,
the
determination
of
molecular
dis-tances from
spin-spin
interactions between
nitroxide
spin-labels requires consideration
of the
effects of dipolar
and
exchange coupling
between the
interacting spins.
Appropri-ate
computational algorithms
have
been
developed for
im-mobilized spins
related
by
a
well-defined
geometry
(Eaton
et
al.,
1983).
These
algorithms
have been
previously
used
to
estimate
interprobe distance
and geometry in
spin-labeled
proteins (Beth
et
al., 1984).
However, the
unique
determi-nation of all of
the
independent variables relating the dipolar
coupled probes
(one
distance
and
five
angles)
has remained
a
formidable
problem.
In
addition, the effect of
the
modu-lation of
the relative
orientations and
distances between the
spins due
to
local structural fluctuations and
independent
spin-label mobility,
and the
global rotational
motion of the
molecule,
have
not
been considered.
Despite
the
fact that
elegant theoretical
work has
addressed
the
effects of
local
and
global
dynamics
on
spatially
isolated
nitroxide
spin-labels
(Freed,
1976; Dalton,
1985; Schneider
and
Freed,
1989),
there has been little
effort
to
extend
these
computa-tional models
to
dipolar
coupled
spin-labels.
In
the present
work,
three separate issues
regarding
the
analysis of
CW-EPR
data from
dipolar coupled
nitroxide
spin-labels
have been
addressed.
First,
acomputationally
efficient
algorithm
has
been
developed
for
calculating
the
CW-EPR
spectrum of
dipolar
coupled
nitroxides
in the
rigid
limit.
Using
this
algorithm,
the
sensitivity
of CW-EPR
spectra
to
the interelectron
distance
and the geometry
relat-ing
the
two
nitroxides
has been
explored.
These
studies
provide
a
guide
to
understanding
the
origins
of
various
spectral features from
dipolar
coupled
spin-labels
and
topredicting
the
sensitivity
to
interelectron
separation
as afunction of
microwave
frequency.
Secondly,
glyceraldehyde-3-phosphate
dehydrogenase
(GAPDH),
a
tetrameric
protein
with known
crystal
structure(Mercer
et
al.,
1976;
Moras
etal.,
1975)
has been studied
using
an
N6-spin-labeled
derivative
of the coenzyme NAD
(N6-SL-NAD+)
by CW-EPR
spectroscopy
at9.8, 34,
and
94
GHz. In
previous
studies
it has been shown that in the
fully
labeled
tetramerthere is
astrong
dipolar
coupling
between the
twopairs
of
spin-labeled
cofactors related
by
the
crystallographic
R
axis and that X-band EPR data
areconsistent with
an
anti-anti
conformation
of
N6-SL-NAD+
(Deparade
et
al., 1981;
Beth
etal.,
1984).
In
the
present
work,
it is shown that
aunique
assignment
of the
geometry
between
interacting,
R
axis-related
spin-labels
and
their
distance of
separation
canbe obtained without any
prior
knowledge of
the
holoenzyme
structure.These
geometry
and
distance
results have then been
compared
toamolecular
model of the
N6-SL-NAD+-GAPDH
complex
constructed
based upon the known
crystal
structure.The results of this
comparison
indicate
that the parameters obtained from
fit-ting the
EPR data
areconsistent
with
a structurein
which
tion as
natural NAD+
and the
spin-label moiety occupies
abetween amino
acid side chains.
Finally,
the
effects of
rigid body
rotational
diffusion
onthe
lineshapes
from
dipolar
coupled
nitroxide
spin-labels
are
examined
assuming axially
symmetric
A-
and
g-tensors
and
assuming
that the
interelectron
vectoris
aligned
with
the
nitroxide
z
axes.These
calculations
areperformed by
simulating
afree induction
decay
signal using
aMonte
Carlo
approach
tomodel the
rotational
dynamics (Robinson
etal., 1992).
These studies
provide
animportant
initial
look
at
the effect
of
global, rigid body
rotational diffusion
onthe
CW-EPR
spectra
of
dipolar coupled
nitroxides and
atheo-retical
framework
for
including
the
effects of
local
probe
motion
onlineshapes
in
future work.
METHODS
Sample preparation
Rabbit skeletal muscle holo-GAPDH with an absorbance ratio of 1.05
(280/260 nm)
wasisolated and characterizedasdescribed inprevious
work(Beth
etal., 1984).
The['5N,D17]-N6-SL-NAD'
was agenerousgift
fromDr.
Wolfgang
Trommerof UniversitatKaiserslautern(Park
and Trommer1989). Apo-GAPDH,
with an absorbance ratio>1.9,
wasprepared by
charcoaltreatmentas
previously
described(Beth
etal.,
1984).
Twosam-ples
wereprepared
forspectral
characterization.First,
holo-GAPDHwasdissolved in 5 mM sodium
phosphate, pH
8.0,
at a concentration of 5mg/ml.
['5N,D17]-N6-SL-NAD'
wasaddedtothissample
ataratioof 0.5 molspin-labeled
cofactor/mol GAPDH tetramer.Second,
apo-GAPDH
wasdilutedto5
mg/ml
in 5 mM sodiumphosphate, pH
8.0,
and 5.0molspin-labeled
cofactor was added per mol GAPDH tetramer. The twosamples
wereincubatedonice for 10 min, then theN6-SL-NAD+-GAPDH
samples
wereprecipitated by dropwise
addition of 10 vol saturatedam-monium
sulfate, pH 8.0,
toagently
stirred solution of the enzyme.Themicrocrystalline
enzymewaspelleted by
centrifugation
at10,000
Xg for30 min and washedoncetoremoveunbound
spin-labeled
cofactor with 10 vol saturated ammoniumsulfate,
pH
8.0,
which had beenpreviously
temperatureequilibrated
onice. Thepelleted
enzyme from this washwasresuspended
inasmall volume of saturated ammonium sulfateas aslurry
for
recording
EPRdata. Doubleintegration
of the EPRspectra
obtained from thesesamples
indicatedspin
concentrations of -20,JM
and200,tM
for the low andhigh
labeling
stoichiometries,
respectively.
Based upon the enzyme concentrations determined from the absorbanceat280nm(E
= 1cm2/mg)
ofaredissolvedaliquot
from eachsample,
thiscorresponded
to-0.3 and 3.4 mol
spin-labeled
cofactor bound/moltetramer.Therefore,
the EPR spectrum of the firstsample (low
labeling stoichiometry)
should be dominatedby
the EPRspectrumofabound,
spatially
isolatedcomponent,
whilethe EPRspectrumof the second
sample (high labeling stoichiometry)
should be dominatedby
theEPRspectrum
ofbound,
pairwise dipolar coupled
component withasmall
bound,
spatially
isolatedcomponent
duetoincomplete
(fewer
than four molspin-labeled
cofactor/moltetramer)
labeling.
AllEPRspectrawereobtained from
samples
of the ammoniumsulfate-precipitated
enzyme. This allowed the enzymetobekept
inastable formsothatspectraatthreedifferentmicrowave
frequencies
could be obtained from thesamesample.
Previous work has shownthatatX-band,
the EPR spectra of soluble and ammoniumsulfate-precipitated
forms of theSL-NAD+/GAPDH
complex
areessentially
identical(Beth
etal.,
1984).
EPR
spectroscopy
The CW-EPR spectra were recorded at 9.8 and 34 GHz on a Bruker
(Billerica, MA)
ESP-300spectrometerwith thesample
temperature
regu-latedat4°C
using
theER41
10 variabletemperature
accessory.X-band(9.8
GHz)
spectra were recorded in a standardTMIIo cavity
withsamples
1 862
Biophysical
Joumalposi-Nitroxide-Nitroxide
Dipolar
Interactionscontained ina50-,ulglass capillary(ComingGlassWorks,Coming, NY)
using 100 kHz Zeeman field modulation of 0.25 Gaussamplitude (peak-to-peak) and a microwave observer field of 0.01 Gauss (peroxylamine
disulfonatecalibrated;Beth etal., 1983).Q-band (34 GHz) spectrawere
recorded in a
TEOl,
cavity with the sample contained in a0.3-mm i.d. quartz capillary (Vitro Dynamics Inc., Rockaway, NJ). Zeeman field modulation at 100 kHz frequency of 0.25 Gaussamplitude anda micro-wave observer field of 0.01 Gauss wereused (peroxylamine disulfonate calibrated; Bethetal., 1983). W-band(94GHz) spectrawererecordedatthe University of Illinois EPR researchcenter on aninstrument described previously (Smirnov etal., 1995; Wang et al., 1994) usinga 1.0 Gauss modulationamplitude in aTE012 cavity with thesample contained in a
0.15-mm i.d. quartzcapillary (Vitro Dynamics Inc., Rockaway,NJ).
Calculation of EPR spectra of
dipolar coupled
nitroxides in the
rigid
limit
TheHamiltoniandescribing the dipolar interaction betweentwonitroxides,
including the electron Zeeman interactions, nitroxide nitrogen nuclear Zeemaninteractions, theelectron-nitrogenhyperfine interactions,and
ne-glecting all nonsecular terms, isgiveninfrequencyunits by
H =
g~zz
BeHoSz
+
g'zz3eHoS2
-
w, (I + I2)
+
Al
'IXSZ
+Al '4Is
+Al1
Its'
tf
(1)
+
AXZ'Ir2
X0Z+
AnYZ2IS
ly Z+
Azz2I
lz-zS2
-D
sls2
-DSIS2
+ SS2S+S
-SS+
DSS'
where
giz,
Axz,
A'z, andAizz
are the appropriate elements of the g- andhyperfine (A-) tensors for electron j,
wn
is the nuclearZeemanfrequency,Ho
is theapplied DC magnetic field,P3e
is the Bohr magneton, andthe unique element of the dipolar coupling tensor, D, is given by-
,h
D
=RIe
(1
-3
cos'
pg)
zI
xi
y1
XI
FIGURE 1 Diagram illustrating the two angles (4,
q)
relating the interelectron vector, R,tothe axisframe defined by nitroxide 1, and the three angles(ca, 3, y) relating the orientation of nitroxide 2tonitroxide 1. Theangles 0 and 4 define the orientation of the external magnetic field, H, with respecttothe axisframe of nitroxide 1.4diagonal form. Therearefour allowed transitions, labeled I= 1through 4, for each4 X4block, k.
Theappliedmagnetic field strengthatwhich a particular transition ison
resonance with the microwavefrequency,
(o,
isgiven by(using 1= 1 asanexample),
(Do
-
(Ak
-
kk)
=0
(5)
orbasedonthe resultsof Appendix A,
k
)°
+fek)2
I,k
+(D/4)2
res=I,k
(0
C-,D/2
-V(qIIre
f
gres
(2)
where w here ,u is the angle between the DC magnetic field and the interelectron vector,R.
The geometry ofthe problem is defined by three Euler angle transfor-mations (see Fig. 1),
R,(-y, /,
a), whichorients theA-andg-tensors of nitroxide 2 with respect to nitroxide, 1, R2(0, , 71), which orients theinterelectron vector Rwith respecttotheaxis frame defined by nitroxide 1, and R3(0, 0,
4)
which orients the DC magnetic field,H,o
withrespect to theaxis frame of nitroxide 1. The A-tensors for thetwonitroxides at each orientation aregivenbyAll
=R3A'(R3)-'
(3)
A2'
=R3RIA2(R,)-'(R3)-l
where Al and
A2
are thediagonalized nitroxide hyperfine tensors. Similar equations applyto theg-tensors. Finally,cos u= (00
1)R3R2
1(0
(4)
\1/
As isdiscussed in further detail in Appendix A, approximate eigenvalues
andeigenvectors for the Hamiltonian of Eq. 1 are found by setting
w,n
=0 andbyneglecting the mixing of states with different nuclear spin quantum numbers.Asimpletransformation converts the Hamiltonian into block 4 Xp
(6)
Areasonable estimate of If,kcanbe obtained by approximating fJvi.konthe right-hand side of Eq. 6 by
HCF,
theapplied magneticfield at thecenterof the EPR spectrum.
(W=I=,k)y
=
wo- c-D/2
-(qHCF
+
fk)2
+
(D/4)2
p
(7)
Thisapproximation of
HlI,k
canthen be used to obtain a more accurate estimate of thetruevalue.wo- c-
D/2
-j(q(ff'=l,k)
+fk)2
+
(D/4)2
p
(8)
Inpractice, this procedure rapidly converges to give accurate values of the
1
=I,k
The probabilities of the four allowed transitions are calculated at
Ho
=ML
1ik
asfollowsPl=l,k
=I(P1IS+
+S2+I )I2
=
(VI
V)
kS=
I(11+ +
S2+IP)I2
=
(ik +
Vk)2
1(p3,k
I(PIS+
+
S2+Ipk)12
=(k_-
21,=4
S=
(
I+
S2+lIpk)12
=(vk
+
Vk)2
(9)
1
863
Hustedtetal.
=1,
k)
it=Volume 74 April 1997
wherevkand vk are given in Appendix A.
The pair of nitroxides, rigidly oriented with respect to each other, are randomly oriented within the sample. The simulated CW-EPR spectrum is thengiven by the double integral, approximated by a double sum over the angles 0and4.
4
N4
Nosin
On
Pl,k(Ho-Hr)
S(Ho)
1=1 k m=1, n=1ENrNs,(FnNO
N
4N
(F2
+
(Ho-
res,kit(on
(M)
(10)
where
2=
AO
=-N
Otm
=(m-
-)AO
AO=-
on= n-AO
and r is the Lorentzian linewidth. The simulation
S(HO)
is then convolved withaGaussianbroadening function of width, oa, to account for additional broadening duetocouplings to protonsordeuterons not included in the Hamiltonianof Eq. 1.Nonlinear least-squares analysis
TheEPR spectra ofspatially isolatednitroxide spin-labelswerefit to a
powder pattern model using a nonlinear least-squares global analysis method as previously described (Hustedt et al., 1993). The algorithm
developed in the previous section (Eq. 10) for the calculation of the CW-EPR spectra ofdipolarcouplednitroxideswasincorporated into this
sameglobal analysisprogram. The presence of multiple local minima in the multidimensional(one distance and fiveangles) x2surfacepresenteda
significant difficultyin theanalysisof spectra of dipolarcouplednitroxides using the Marquardt-Levenberg algorithm. Therefore, aprogram for the
fittingof datatothedipolar couplednitroxide modelwasdevelopedbased
onthe method of simulatedannealing (Pressetal., 1992).Thesimulated
annealing minimization techniqueis well suited for exploring asurface with many local minima. In the present work, the simulated annealing
program wasused forfitting ofsingledata sets(i.e.,dataobtainedat a
single microwave frequency).
Twoapproachesweretakentothe simultaneous nonlinear least-squares
analysisof the spectra ofdipolar couplednitroxides obtainedatX-, Q-,and W-band. In the firstmethod,astepwise approachwasused.Estimates of the interelectron distancewereobtained from the observedsplittingof the highfieldz-turningpoint assuming
6
= 0°or(= 900.Initially onlytheparameters R,
4,
andsq
werevaried.Thentheremaining angles (a,(3,
and -y) and the linewidths of the dipolar coupled components at the three microwavefrequencieswerevariedtofurther refine the fit.Inthe secondmethod, the X-band spectrumwas analyzed using the method of simulated annealingas described byPress etal. (1992).The
algorithmwasinitialized witharandomsetof parameters (within physi-callyreasonablelimits)andrunfor 2000-4000iterations, coolingat a rate
given by
T0+
I =aTn,
wherearangedfrom 0.95to0.999. At theend,thesetof parameters that hadgiventhe smallestx2wassaved and usedas a
startingpointforglobal analysisof all three datasets.Each trial solution could be obtained in -5 h of
computation
time andatotal of 10 such trial parametersets weregeneratedand usedtoinitialize theglobal analysis.Ineither case, the datawasfitas atwo-component spectrumtoaccount
forasmall percentage ofspatiallyisolated nitroxides presentinthe
high-labeling stoichiometrysample.Foranygivensetof parametersR,4
'q,
a,,3,
and y the best fit to the data was obtainedby
linearleast-squares
minimization of the function
S(Ho)
=c1S(Ho;
R
=50A,
(
= = a=,
=y
=0)
+
C2S(HO;
R,
a,
X,
(3, y)
(12)
+ C3
where the first term represents the spectrum of the spatially isolated component, the second term is the dipolar coupled component, and the third term is a constant baselinecorrection.Asdetailed previously (Hustedt
etal.,1993), a search was performed to find the optimal x axis
(8HO)
shifttobestmatch the simulation with the data. A spline interpolation routine was used to directly overlay the shifted simulation onto the data. In the global analysis of the spectra obtained at X-, Q-, and W-band, no effort was made tokeep the mol fractions of spatially isolated
(XI
=c1/[c1
+c21)
and dipolar coupled (X2 =c21[c1 + c2]) nitroxides equal for the three spectra. While all three spectra were obtained from the same sample preparation andwerecollectedat approximately the same temperature, the spectra at different microwave frequencies were collected at different periods of time after sample preparation. As a result, minor variations in these mol frac-tionswerenotunexpected. The number ofSL-NAD+bound per GAPDHtetramer is given by 4X2. assumingthat asecondSL-NAD+ binds with equal probabilitytositesadjacent to and distant from the first (Beth et al., 1984).All calculations wereperformedon DEC 3000 400 or 200 4/233 alpha workstations (Digital Equipment Corporation, Maynard, MA).
Any-oneinterested in obtaining computer programs used in this work should
contacttheauthors.
Modeling based on known crystal structure
The chemical structure of
N6-SL-NAD+
is shown inFig. 2. Molecular modeling was performed using Insight II software (BiosymTechnologies,San Diego, CA) runningon a Silicon Graphics (Mountain Valley, CA)
Indigo2
workstation. The structure of the 6-membered ring nitroxide was constructed from the x-ray crystallographic data obtained by Berliner (1970) for 2,2,6,6-tetramethyl-4-piperidinol-1-oxyl. The atomiccoordi-natesforaGAPDH dimer(red and green subunits of the tetramer) deter-minedby Moras etal.(1975) for lobster muscle GAPDHwereobtained from theProtein Data Bank(Brookhaven National Laboratory). The
coor-dinates of the othertwo subunits (yellow and blue) were generated by
rotationabout theQ axis. In thisstructure, thepairsofRaxis-related(red and green,yellow and blue) NAD+ cofactorsareindifferentconformations (anti-syn).Thisconformation isnotconsistent with the EPR data(Deparde
etal., 1981;Bethetal., 1984) norwithsubsequentx-raycrystallographic
data obtained from human muscle GAPDH (Mercer et al., 1976). As previously described (Beth et al., 1984), the structure of the NAD+
cofactors in thetetramer wereadjustedsuch that all four hadC2 symmetry-relatedanticonformations.
FIGURE 2 Structure of
['5N,D17]-N6-SL-NAD+.
[image:4.576.320.523.573.709.2]Nitroxide-Nitroxide
Dipolar Interactions
Bondswerecreatedbetween the carbonatomsdirectlyacrossfrom the nitroxide moiety of the spin-label and the amino groups onthe adenine rings for each ofthefour subunits of the GAPDHtetramer. The torsion angles of thetwo bondsforming the C-N--Clinkagebetweenadenine and the spin-label were then adjusted to minimize the contact of the spin-label with adjacent side chains and tomaximize the agreement of values ofR(measuring fromnitrogentonitrogen), (, andqcalculatedfor
the model with those obtained from analysis of the EPR data. The torsion angles for all four subunits were adjusted equally to maintain the C2
symmetryof the complex.
Calculation of
EPR
spectra of
dipolar
coupled
nitroxides undergoing rigid body
rotational diffusion
TheEPRspectrum ofapair ofdipolarcoupled nitroxides undergoing rigid body isotropic rotational diffusioniscalculatedusing amethod basedon thework of Robinson and co-workers (Robinsonetal., 1992). The CW-EPR spectrumis obtained from the Fourier transform ofafreeinduction decay (FID) time domain signal, which is calculated by solving the stochastic Liouville equation usingaMonte Carlo approachtogenerate randommoleculartrajectories accordingto aBrownianisotropic rotational diffusion model.
Assuming the A- and g-tensors of thetwonitroxides are equalandaxial,
where
sinflJ
0 0O
sinflu2 0
*
0
andtoachieve reflective boundary conditions.
sin
p,2-sin
p,2T=
-sin
p.2
(sin
pt2
+
sin
gU3)
-sin
/L3
0
(19)
. . ) . . ..
sinA1N,
0
-sin
liN,O
-sin
ILN0/
(20)
LetP(t) be the vector giving the probability of beingateach of the possible orientations, ,ej, at time t, and Peq be the equilibrium distribution. The solution to
P(t)
=rFP(t)
is givenby
P(t
+
&t)
=e-
ITp(t)
(21)
(22)
where K= DR t/(
ff)2
andFr Peq=0for (Peq)j=1/N,.
In the limit of small K, Eq. 22 can beapproximatedbyP(t
+
&t) (1
+
KM-'T)P(t)
AJ
=AJy
=
1
AJzz
=
All
AiX
=gjyy
= gLgizZ~
=gll
andthat - a - =
-y
= 0°,the Hamiltonian may be written asH =
gZZHo(SI
+
S2)
- c
(II
+
I1)
+
AXZ(IOSX
+
IxSz)
+
Az(IzSz
+
IzSz)
(14)
-4
SS2
-4S'S2
+DSzS2
where
Axz
=(A1
-AII)cos
,u
sin
,u
Azz
=A1sin2,u
+A1Icos2/1
gzz
=gIsin2,
gji
+cos2pu
The timeincrementAtatwhich theFIDmust be calculated is determined by theNyquistfrequency oftheFourier transformandthedesired width of thesimulated spectrum. For At= 2.5 ns,thespectralwidthis-140 Gauss
(suitable forX-andQ-band) and for At= 1.25nsthe width is-280 Gauss (suitable for W-band). To retain a linear equation similar in form to Eq. 23 andtoobtainthe desired spectral width, letAt= N0St,then
P(t
+
At)
=eNsKM-ITp(t)
(24)
=
(e'-m
'T)N,P(t)
z(1 +
KM-lT)NsP(t)
Thematrix
F=
(1
+KM-iT5t)N,
(15)
hastheproperty thatj=NA
E
F1j,
=1
j=
(25)
(26)
and fora
15N
nitroxide, w, = 1.54 X 10⁻⁴XWlo.
The classical isotropic rotational diffusion operator
1
a
a
rF
=DR
.
a
sin
A
sifl /La/.L
P
(16)
may be writteninmatrix form assuming an equally spaced grid of angles
i=
ti
-2
A1
A
=-
(17)
The elements of the matrix G, defined as
(27)
kiGi,j
=E
Fi,k
k=lgivetheprobabilityofrotating from orientation
,j
to orientation ,u; duringthetime intervalAt.
TheFIDin the rotating frame is generated by solving
S(wo,
t)
=Tr{S+p(go,
t)}e-i(t
(28)
asderived by Robinson and co-workers (1992).
DR
(A^
M
(18)
Thedensity matrix,
p(go,
t), isobtained by solvingp
=-i[H(t),
p(jo,
t)]
-
rR(p(Lo,
t)-
pq)
q
-r(p(.to, t)
-Peq)
(13)
(23)
(29)
Volume 74 April 1997
whererR is a phenomenological relaxation rate operator. The treatment of thefirst two terms of Eq. 29 is described in detail in Appendix B.
Starting at time t= 0, let
,uo
=,Uj
andp(P.O,
t=O)
=½12(S,
+S-)
(30)
Then,
p(p,o,
t =At)
=Q(tkj)
p(po,
t =0)
*
Q(gj)-'
(31)
After each time interval, At, a uniform random number, d, between 0 and 1 is chosen to determine the new orientation of the molecule. After the first time interval, the new orientation is t(t+ At) =IlkifGk-1
j <d 'GkJ,
sothat
p(P1o,
t
=At)
=Q(Gk)
*p(o, t
=At)
*Q(1kk)Y'
(32)
andso onfor each successive time interval.
Finally, the complete CW-EPR spectrum is obtained from the Fourier transform of
S(.0,
t) summed over allpossible initial orientations and summedover asufficient number of trajectories,Nraj,
togive asmooth simulation.00r
Nt,aj
Nt,
S((O)
= F[I
S(pO
E
,
t)Peq(poj)sin
oj
dt
Ntraj
[ n=1j=1 I(33)
The expected rotational diffusion coefficient, DR, and rotational correlation time,T; = 1/6 DR, are given by
irKNs
_t_N___2
DR
=At(N,)2
z
=6iHKNs
(34)
In addition to the calculation of the EPR spectrum from Eq. 33, the following autocorrelation functionsarealso calculatedtoevaluate whether the MonteCarlo method used is correctly modeling isotropic rotational diffusion.
Cl(t)
=(Cos
P'0cos
,(t))
C2(t)
=((1
-3
cos2i)(1
-
3
cos2tL(t)))
(35)
C3(t)
=((5
cos3W
-
3
coswo)(5
cos3,u(t)
-3
cos
,(t)))
These correlation functionsareexpectedtodecay assingleexponentials
withdecay times ofT, =2DR,T2 = 6DR,and T3 = 12DR,
respectively.
RESULTS
The EPR
lineshape
from
two
immobilized, dipolar coupled
spin-labels
will
depend
upon five
independent angles
and
the distance between the
unpaired
electrons
asdefined
in
Fig.
1.
Clearly,
with this
number
of
independent
variables
it
is
not
possible
to
provide
an
exhaustive
survey of the
lineshapes
that
can
be
observed
experimentally. However,
it
is
possible
to
define
the
limits
of
sensitivity
for
measure-ment
of
interspin
distances
asafunction of selected
orien-tational models
and
asa
function of
microwave observer
frequency. Figs.
3-5
show calculations
performed
atX-,
Q-and
W-band,
respectively, assuming
that the
principal
axesof
the
two
spin-labels
arecoincident
(a
=,B
=y
=00).
Fig.
6
shows the effects
of noncoincident axis
frames.
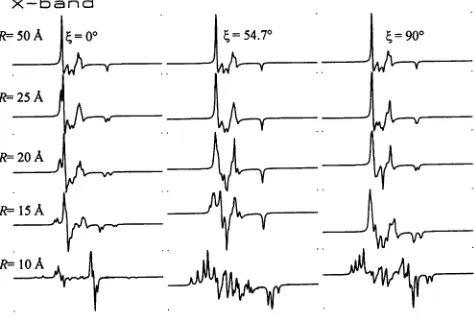
Fig. 3
shows
simulated
X-band spectra for three
selected
orientational
models. In the left
column,
the
interelectron
vector is
parallel
to
the z axes
of
the two nitroxides
((
=O°).
This
represents the case
of
maximum
sensitivity
to
R in the
extrema
regions (z-turning points) of
the spectrum
at
X-band.
From top
to
bottom,
the
simulations
were
performed
for R
=50, 25, 20,
15,
and
10
A.
At
R
=25
A
(column 1,
row
2), there
are
resolved
splittings in the
extrema
regions
of the spectrum with
linewidths
appropriate
for
perdeuter-ated nitroxide
probes
with
measurable
spectral broadening
observed
out to
30
A
(not shown).
As
R
is decreased
in the
range
from 25
to
10
A,
the
spectral shapes clearly
show the
effect of
increasing
the
magnitude
of the
principal
element
of
the
dipolar coupling
tensor
(column
1,
rows
2-5).
With
this
set
of
angles, interspin
distances
out
to30
A
canbe
characterized
at
X-band.
Fig.
3,
center
column,
shows simulated X-band spectra
for the
case
where the z
axes
of
each
nitroxide
areoriented
at
the
magic angle ((
=54.70)
with respect
tothe
interelec-tron vector.
This represents the
case
of minimum
sensitivity
to
R in the
extrema
regions
of the spectrum
atX-band. Even
with
this
unfavorable geometry, there
aredistortions
of
spectral features
in the
center
(x-
and
y-turning points)
of the
spectrum
out to
distances of 25
A
(column 2,
row2)
with
clearly
resolved
splittings
atdistances of 20
A
orless
(column
2,
rows
2-5).
Fig.
3, right column,
shows
simulated X-band
spectra for
the
case
where the z
axes
of each nitroxide
areoriented
orthogonal
to
the interelectron
vector((
=900).
This
is
acase of
intermediate
sensitivity
toR
in the
extremaregions,
but
maximum
sensitivity
in the
centerof
the spectrum
atX-band.
In this case,
discernible
broadening
of interior
spectral
features
are
evident
out to-30
A
(not shown)
with
obvious
splittings
measurable
by
R
=25
A
(column
3,
row2).
In
the range from 25
to
10
A,
there is
again
aprogressive
increase in
splitting
of
characteristic
features
throughout
the
1866
Biophysical
JournalX-band
k5 oA =0o |=54.70 | =90
R=- 25A
R 20A
R--15A
[image:6.576.300.538.56.216.2]R=<
bAFIGURE 3 Simulated X-band CW-EPR spectra of dipolar coupled ni-troxides. From lefttoright the three columnscorrespondto(=
00,
(=54.70,
and (=900.
From top to bottomR= 50, 25, 20, 15, and 10A.
Inall cases, gxx = 2.0085,gyy = 2.0060,
g,
= 2.0020; AXX = 10.0 Gauss,Ayy
= 8.0 Gauss,Azz
= 45.0 Gauss; =0 and a = =y = 00;Lorentzian linewidth, r = 0.75 Gauss; 150 Gauss sweep width; wo =
Nitroxide-Nitroxide
Dipolar
Interactionsspectrum, which
are
indicative of both the relative
spin-label geometry and the interelectron
separation.
Fig. 4
shows simulations of the CW-EPR spectra
at
Q-band
(wo
=
34
GHz)
for the
same
three models as
described for
Fig.
3. At this
frequency,
the low-field end of
the spectrum is determined
by
the
magnitude
of
dipolar
coupling along
the
x axes
of the
two
nitroxides,
while the
high-field end
of
the spectrum is determined
by
the
magni-tude of
dipolar
coupling along
the z
axes.
Two
points
are
immediately obvious
from the simulations
at
Q-band. First,
the
sensitivity
to
R
is approximately equal
to
that described
at
X-band for each of the three
orientational models
con-sidered. Second,
the
magnitude
of
dipolar coupling along
the
x-
and
y-nitroxide
axes
is much
more
clearly observable
at
the
higher
microwave
frequency. Given
the small
sample
sizes
required for Q-band (2-3 ,lI)
measurements
on
aque-ous
samples,
the
high signal-to-noise obtainable from
mod-em
Q-band instrumentation (Hyde
et
al.,
1991),
and the
high
orientational sensitivity of
the
spectral
display, it
is clear
from these simulations
that many systems
exhibiting
spin-spin coupling
could be
profitably
studied
at
this
microwave
frequency (Eaton
et
al.,
1980).
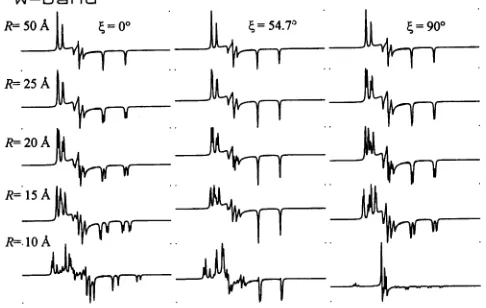
Fig.
5 shows
simulations of
the CW-EPR spectra
at
W-band
(wo
=94 GHz)
for the
same
three
models
as
described for
Fig.
3. At
this
frequency,
the
spectral features
from all nuclear
hyperfine
and
dipolar coupling interactions
along
all three
nitroxide principal
axes are
clearly
resolved.
While the
sensitivity
to
interelectron separation is again
comparable to that observed at
X-band,
the
exquisite
sen-sitivity
to
the
magnitude
of
dipolar coupling along
all
three
principal
axes
of the nitroxides
provides
a
strong
impetus
for carrying
out
studies
on
systems
at
this higher frequency.
The
extremely
small sample
volumes
required
for W-band
(70 nl)
make this
an
attractive
frequency
for
studies
of
spin-spin interactions
when small
sample volumes
are an
Q-band
R--50A =54.7O ~ =90O
R=- 25A
R=- 20A
R=-ioA
FIGURE 4 Simulated Q-band CW-EPR spectra of dipolar coupled ni-troxides.Fromlefttoright the three columns correspond to (=
0°,
6
=54.70,
and(=900.
FromtoptobottomR= 50, 25, 20, 15, and 10A.
In
all cases,
g,x
= 2.0085,gyy = 2.0060,g,
= 2.0020;AXX
= 10.0 Gauss,Ayy
= 8.0 Gauss,Azz
= 45.0 Gauss; q= 00 and a =t3
=y =00;Lorentzianlinewidth, F = 0.75 Gauss; 200 Gauss sweep width; o =
2i-7
34x 109s-';
HCF = 12120 Gauss.W-band
R=20A
R=15A+ |T
R=.1 A
FIGURE 5 Simulated W-band CW-EPR spectra ofdipolarcoupled ni-troxides. From lefttoright the three columns correspond to (= 00, (=
54.70,and
f
=900. From toptobottom R = 50,25, 20, 15,and 10A.
In all cases,g0,x
= 2.0085,gyy= 2.0060,g= 2.0020; AXX = 10.0Gauss,Ayy
= 8.0 Gauss, Azz = 45.0 Gauss; 1= 0° and a= = y = 00; Lorentzian linewidth, F = 0.75 Gauss; 300 Gauss sweep width; wo =2iif 94 X 109s-1;HCF = 33510 Gauss.
experimental constraint and when
spin concentrations
in the
100-,uM range are attainable.
Fig.
6
shows a panel of simulated spectra at X-, Q-, and
W-band microwave
frequencies
for
a constant
interelectron
separation of 15
A.
These simulations demonstrate the
re-markable
sensitivity
of the
lineshapes
to
the
angles
a,
,B,
and
y (see figure legend for
angles used),
which determine the
orientation of nitroxide 2 to nitroxide 1.
The EPR spectra of dipolar coupled nitroxides are
sensi-tive to two distinct aspects of structure, the distance between
the two nitroxides and the geometry
relating
them. In many
applications, the relative
orientation of
the two probes can
be as instructive as the
distance,
R.
The
simulations
shown
150Gauss 200 Gauss 300Gauss
FIGURE 6 Effect ofrj,a, f3, and y on simulated CW-EPR spectra of dipolar coupled nitroxides.Fromleft to right the three columns correspond
toX-,Q-,and W-band simulations for (=900;R=15
A;
q=00andca
=(3 = y = 00 (toprow and others exceptas noted below); and all other parameters asdescribedfor Figs. 3-5. Second row from top, q = 900.
Third row, 3 =900.Fourth row, a = (3 =900.Fifth row, ,B= y= 900.
[image:7.576.299.542.56.210.2] [image:7.576.297.539.494.662.2] [image:7.576.38.280.494.649.2]Volume 74 April 1997
in
Figs. 3-6 provide the motivation for development of a
rigorous and computationally efficient method for the
non-linear least-squares analysis of data from dipolar coupled
nitroxides in the rigid limit. Accurate determination of the
distance
and geometry between interacting spin-labels can
provide important constraints for determining the structural
elements of
appropriately doubly labeled proteins.
Quantitative characterization of the dipolar
coupling in N
-SL-NAD+-GAPDH
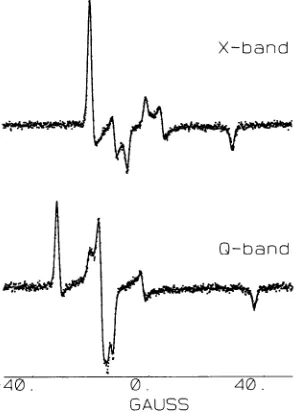
The CW-EPR spectra (dots) at X- and Q-band of
N6-SL-NAD+
bound to microcrystalline, tetrameric GAPDH at
low stoichiometry are shown in Fig. 7. The extraordinarily
narrow
linewidths evident in these spectra are indicative of
a
nitroxide probe which is tightly bound to GAPDH with
very
little,
if any, local probe motion. Significant
improve-ment
in linewidth is also achieved by using a perdeuterated
nitroxide
label. These two spectra have been simultaneously
fit
(solid
lines) to a powder
pattern
model. These fits give
the A- and g-tensors that are necessary to analyze the EPR
spectra of dipolar coupled nitroxides. It has been assumed,
based
on
the symmetry of the
crystal
structure
of
the
tet-rameric
NAD+-GAPDH
complex, that the A- and g-tensors
are
equivalent
at
the two
sites. Given
the
excellent
quality of
the fits to the
experimental
data, this appears to be a valid
assumption.
The
CW-EPR spectra (dots) at X-,
Q-,
and
W-band of
N6-SL-NAD+
bound
to
microcrystalline,
tetrameric
GAPDH at high stoichiometry are shown in Fig. 8. The
many additional splittings observed in these spectra, which
are not
evident in the spectra shown in Fig. 7, are a clear
indication of dipolar coupling between nitroxides, in
agree-ment with previous reports (Deparade et al., 1981; Beth et
al., 1984). Two approaches have been used to analyze these
spectra. The first approach is outlined in Table 1. From the
splitting
of the
high-field
features in these spectra, an
esti-mate
of R was obtained from Eq. 2 assuming that 4
=0°
(16.1
A)
or 4
=90° (12.8
A).
Using these values as starting
points, the three spectra were at first simultaneously
ana-lyzed
allowing
4,
q,
and R to vary. From these results it was
clear that 4
1
12°
(or
by
symmetry
68°),
r
1180
(or
by
symmetry
620),
and R
13
A
gave the best fit
to
the data.
Next, the angle (3 was varied using
13
=450
and 13
=135°
as initial values.
Finally a,
-y,
and the
linewidths
of
the
dipolar coupled
components were allowed to vary. At
X-and
Q-band
the
linewidth,
F,
of the
spatially
isolated
com-ponent was
fixed
to
that
obtained from
the
analysis
per-formed
for Fig.
7,
while
the
linewidth
of
the
dipolar coupled
component was
allowed
to
vary. At
W-band
the
linewidths
of both components were allowed to vary, but
were
forced
to be equal. No
significant
improvement
in
fit
was
obtained
by allowing different linewidths for
the
spatially isolated
and
dipolar coupled
components
at
W-band. As shown in
X-band
X-band
-100.
GAUSS
FIGURE 7 CW-EPR spectra(dots) atX-and
Q-band
ofN6-SL-NAD+boundtoGAPDHat aratio of 0.3
spin-labels
per GAPDHtetramer.Thetwo spectrahave been simultaneously fit
(solid lines) using previously
described methods(Hustedtetal., 1993).The bestfit parameters obtained
are:
g'
=0.001599,g"
=0.001459, =2.0055(fixed),
whichgives
gxx=2.008558, gyy =
2.005640, g,z
=2.002302; AXX
= 10.804Gauss,Ayy
=12.191 Gauss,
Azz
= 49.008 Gauss; Lorentzianlinewidth,
F = 0.463 Gauss; Gaussian convolutionwidth,
a-= 0.470 Gauss.0. GAUSS
[image:8.576.332.502.378.602.2]100.
FIGURE 8 CW-EPR spectra(dots) atX-, Q-, and W-band of
N6-SL-NAD+ boundtoGAPDHataratio of3.4spin-labelsper GAPDHtetramer. Thesimultaneous fits(solid lines) overlayedonthe datawereobtainedas
described in thetext.Thebest-fit parameters obtainedwere:(=
75.4°,
7 =43.50,
R= 12.84A,
a =161.10,
(3=53.50,
and y=19.00;
thecalculated labelingstoichiometrywas3.7SL-NAD+perGAPDHtetramer atX-band,
3.7atQ-band,and 3.4atW-band;atX-band F = 0.46 Gauss
(fixed)
for the spatially isolated component and F = 0.83 Gauss for thedipolar
coupledcomponent;atQ-band F = 0.46 Gauss
(fixed)
for thespatially
isolated component and F = 0.68 Gauss for the
dipolar coupled
compo-nent;atW-band F= 1.27 Gauss forboth components;v-
wasfixedto0.47 Gauss for all spectra. [image:8.576.88.235.431.640.2]Nitroxide-Nitroxide
Dipolar
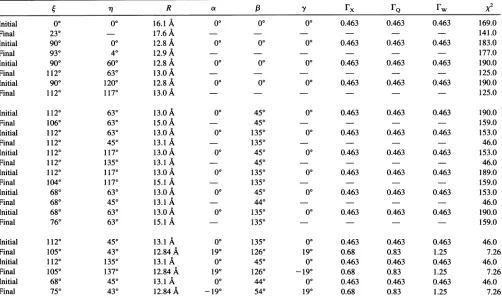
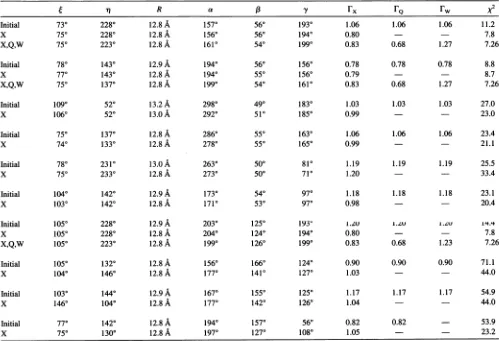
InteractionsTABLE I Resultsof theglobal
analysis
oftheCW-EPR spectraof theN6-SL-NAD+-GAPDH
complex
athigh
labeling
stoichiometryR a rFx
FQ
rw vInitial 0° 00 16.1 A 00 00 00 0.463 0.463 0.463 169.0
Final 230 17.6 A - - 141.0
Initial 900 00 12.8 A 00 00 00 0.463 0.463 0.463 183.0
Final 930 40 12.9 A 177.0
Initial 900 600 12.8 A 00 00 00 0.463 0.463 0.463 190.0
Final 1120 630 13.oA 125.0
Initial 900 1200 12.8 A 00 00 00 0.463 0.463 0.463 190.0
Final 1120 1170 13.o A - - 125.0
Initial 1120 630 13.0 A 00 450 0( 0.463 0.463 0.463 190.0
Final 1060 630 15.oA 450 - 159.0
Initial 1120 630 13.0 A 00 1350 00 0.463 0.463 0.463 153.0
Final 1120 450 13.1 A 1350 - 46.0
Initial 1120 1170 13.o A 00 450 00 0.463 0.463 0.463 153.0
Final 1120 1350 13.1 A - 450 - 46.0
Initial 1120 1170 13.0A 00 1350 00 0.463 0.463 0.463 189.0
Final 1040 1170 15.i A 1350 159.0
Initial 680 630 13.0 A 00 450 00 0.463 0.463 0.463 153.0
Final 680 450 13.1A - 440 - 46.0
Initial 680 630 13.0 A 00 1350 00 0.463 0.463 0.463 190.0
Final 760 630 15.1 A 1350 159.0
Initial 1120 450 13.1 A 00 1350 00 0.463 0.463 0.463 46.0
Final 1050 430 12.84A 190 1260 190 0.68 0.83 1.25 7.26
Initial 1120 1350 13.1A 00 450 0° 0.463 0.463 0.463 46.0
Final 1050 1370 12.84A 190 1260 -190 0.68 0.83 1.25 7.26
Initial 680 450 13.1A 00 440 00 0.463 0.463 0.463 46.0
Final 750 430 12.84
A
-190 540 190 0.68 0.83 1.25 7.26Theangles q,, a, 3, andy,and the distance R, are defined in Fig. 1. The parameters
rx,
FQ, andFw
are the Lorentzian linewidths of the dipolar coupled component. At X- and Q-band, the linewidths of the spatially isolated component were fixed to those obtained in the analysis performed in Fig. 7. At W-band the linewidths of the spatially isolated and dipolar coupled components were made equal. Rows labeled "initial" give the input values used for the global analysis. Rows labeled "final" give the best-fit parameters obtained for these initial values; a dash indicates that the parameter was fixed to the initial value andwasnotvaried. Thex2
values were calculated as previously described (Beechem et al., 1991; Husted et al., 1993).Table
1,
three
setsof
angles
werefound
that gave the
sameX2
for
aninterelectron
distance of
12.84
A.
It
is
expected
that
anumber of
symmetry-related equivalent
solutions
should
exist.
The
equivalence, by
symmetry, of
the
three
solutions
in Table 1 is
demonstrated
by
the fact
that for all
three
solutions
the values of
R
areequal;
the
values
of
x2
areequal;
the
angles
(, 7, and (3
arerelated
by
areflection
through 90°;
and the
angles
aand y
arerelated
by
areflection
through 0°.
These solutions
are notdistinguish-able
by
EPR.
The second
approach
tothe
nonlinear
least-squares
anal-ysis
of the data in
Fig.
8 is outlined in
Table
2.
Initially,
the
data
atX-band
alone
wereanalyzed using
amethod based
onsimulated
annealing.
This
generated
10
setsof
parame-ters
that could be used
asstarting points
for the
global
analysis
of all three spectra. Of 10 initial parameter sets,
three
produced
fits that
appeared
tobe
atthe
sameglobal
minimum after
-10-30
iterations
of the
Marquardt-Leven-berg algorithm.
As with the
stepwise
approach,
the
distance
and
angles
for the three best fits
areequivalent
(by
symme-try).
The agreement between
the
twoapproaches
in the
best-fit
distance, angles,
and x2
values
strongly
suggests
that these values do in fact represent the
global
minimum
in
the
x2
surface.
The calculated values of the
labeling
stoi-chiometry
obtained
atthe three different
microwave
fre-quencies
arein
reasonable
agreement
with
the estimated
value of
3.4
SL-NAD+
bound per GAPDH
tetramer.
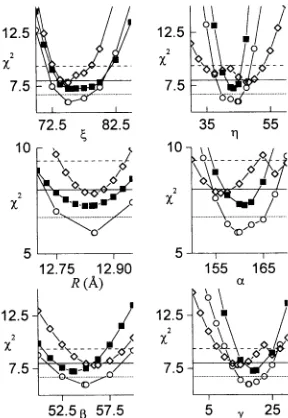
Fig.
9 shows the
confidence intervals
for
the six
param-eters
relating
nitroxide
1
tonitroxide
2,
which
were
varied
in
the
analysis
shown in
Fig.
8. In each
panel,
the
x
axis
parameter
washeld fixed
atcertain
values
near
the
global
minimum and the other five parameters
were
varied
to
find
the best fit
tothe data. The
horizontal
lines
are
drawn
at
the
X2 value
corresponding
to an
approximate 99%
confidence
level calculated
using
the F-statistic. In
some
cases, such
as
R
and (, the
analysis
of
the X-band data
alone
(open
diamonds,
dashed
horizontal line)
is sufficient
to
precisely
determine the best
fit
values.
Little
or
no
improvement
is
seen
when the X- and
Q-band
data
(open circles,
dotted
horizontal line)
orthe
X-, Q-,
and W-band data (solid
squares, solid
horizontal line)
are
simultaneously
analyzed.
On the other
hand, significant
improvement
in the
determi-nation
of 7, a,
(3,
and y is
seen
when the
higher frequency
data
areincluded.
As
expected,
those
angles requiring
the
resolution of
x-and
y-turning
points
of the spectra are most
dramatically improved by including
the
higher frequency
data.
[image:9.576.43.545.74.372.2]TABLE 2 Results of the global analysis of the CW-EPR spectra of
the
NI-SL-NAD+-GAPDH
complex at high labeling stoichiometry using initial values obtained from the simulated annealing fits to the X-band spectrumq R a ,8 y
rx
FQ
rw X2Initial 730 2280 12.8
A
1570 560 1930 1.06 1.06 1.06 11.2x 750 2280 12.8A 1560 560 1940 0.80 7.8
X,Q,W 750 2230 12.8A 1610 540 1990 0.83 0.68 1.27 7.26
Initial 780 1430 12.9A 1940 560 1560 0.78 0.78 0.78 8.8
X 770 1430 12.8A 1940 550 1560 0.79 8.7
X,Q,W 750 1370 12.8A 1990 540 1610 0.83 0.68 1.27 7.26
Initial 1090 520 13.2A 2980 490 1830 1.03 1.03 1.03 27.0
X 1060 520 13.0A 2920 510 1850 0.99 23.0
Initial 750 1370 12.8 A 2860 550 1630 1.06 1.06 1.06 23.4
X 740 1330 12.8
A
2780 550 1650 0.99 21.1Initial 780 2310 13.0A 2630 500 810 1.19 1.19 1.19 25.5
x 750 2330 12.8
A
2730 500 710 1.20 - 33.4Initial 1040 1420 12.9A 1730 540 970 1.18 1.18 1.18 23.1
X 1030 1420 12.8A 1710 530 970 0.98 20.4
Initial 1050 2280 12.9A 2030 1250 l93' L.zU I.ZV I.V 14.
X 1050 2280 12.8 A 2040 1240 1940 0.80 - 7.8
X,Q,W 1050 2230 12.8 A 1990 1260 1990 0.83 0.68 1.23 7.26
Initial 1050 1320 12.8A 1560 1660 1240 0.90 0.90 0.90 71.1
X 1040 1460 12.8A 1770 1410 1270 1.03 44.0
Initial 1030 1440 12.9A 1670 1550 1250 1.17 1.17 1.17 54.9
X 1460 1040 12.8 A 1770 1420 1260 1.04 44.0
Initial 770 1420 12.8 A 1940 1570 560 0.82 0.82 - 53.9
x 750 1300 12.8A 1970 1270 1080 1.05 23.2
All parameters usedaredefined for Table 1. Rows labeled "X"aretheresults of
analysis
of the X-band dataalone;
Rowslabeled"X,Q,W"
arethe results of the simultaneousanalysisof theX-, Q-,andW-band spectra. When resultsatX-,Q-,and W-bandarenotgiven,thex2values obtainedweregreater than 20.Molecular
modeling
of
Ne-SL-NAD+-GAPDH complex
Fig. 10 shows the
structure
of
the
N6-SL-NAD+-GAPDH
tetrameric complex
generated
as
described
above.
Simulta-neous
adjustment
of the
torsion
angles
of the C-N and
N-C bonds linking
the
NAD+
tothe
spin-label moiety
resulted in
a structure
with
a
measured distance between
spin-labels
(nitrogen
tonitrogen)
of
R
=12.85
A,
and
angles
(
=760,
-j
=590,
a =2530,
a
=360,
and
'y
=2890.
In this
orientation
the
nitroxides
arefree
of
any
significant
steric
interaction with
adjacent
side
chains of
the
protein
and
reasonable
agreement with the EPR data is
obtained
for
the
distance, R,
and the
angles,
(,
,and
(3.
Effect of
global isotropic
rotational diffusion
on
the
CW-EPR spectra
of
dipolar
coupled
nitroxides
Figs.
1 1
and
12 show
simulations of
the
CW-EPR spectra
atX-,
Q-, and W-band of
apair
of
dipolar coupled
nitroxides
undergoing
isotropic
rotational diffusion
assuming axially
symmetric
A-
and g-tensors
and
=
q = a= (3
=
y=00,
for
R
=50
A
(Fig. 11)
orR
=15
A
(Fig.
12).
In
each
case,the
top
rowis
arigid
limit calculation
(D
=0
or c =0
).
The
other calculations show
EPR
spectra
calculated for
rotational correlation
times that
arewithin
the
sensitivity
range
of
linear EPR
spectroscopy of
nitroxide
spin-labels
(c
=125
ns,
T =20
ns,
and
T0
=5
ns).
These calculations
demonstrate
that,
asexpected,
global
rotational
diffusion
alters the
lineshapes
produced
by
dipolar coupled
nitrox-ides.
However,
it
is
notuntil
the
rotational diffusion
rateis
sufficiently
fast
(Tc
=5
ns)
toaverage the
anisotropic
A-,
g-,
and D-tensors that the
additional
splittings
produced
by
the
dipolar
interactions
arelost.
Calculations
(dashed lines)
based
onthe
rigid
limit
for-malism of
Eq.
10
areoverlaid
onthe
spectra
onthe
top
rowof
Figs.
11
and
12
(calculated
for
Tc
=00
).
Calculations
(dashed lines)
performed using
the
algorithms
developed
by
Freed
and co-workers
(Schneider
and
Freed,
1989)
for
spa-tially
isolated nitroxides
areoverlaid
onthe
spectra
in
Fig.
11,
left-hand
column,
bottom three
rows.For R
=50
A,
there
is
negligible dipolar
coupling
and the calculated
[image:10.576.36.535.72.413.2]
Nitroxide-Nitroxide
Dipolar
Interactions12.5
x
7.5
10
2
x
5
12.5
-2
x 7.5
-52.5 57.5
R
12.5 O
2l
7.5 mF
35 55
'1 10
0
, U
x229
5
155 165
5 , 25
FIGURE 9
x2
surfaces forthefittingparameters (,-q,
R,a, ,B, and -y. Thesymbols usedare asfollows: (<2>)fittoX-band dataalone; (0) simulta-neous fit to X- and Q-banddata; (-) simultaneous fits toX-, Q-, and
W-band data.Thehorizontal linesdefine -99% confidencelevels for each oftheparameters for the(----)fittoX-banddataalone;() fittoX-and
Q-banddata; ( ) fittoX-,Q-,andW-banddata.
tra
should be similar
to
those
obtained
using
the
algorithms
of Freed and co-workers. All of the overlaid spectra agree
well with the simulations
generated
using
the molecular
trajectory approach
of Eq. 33. The
overlays
on
the top
rows
of
Figs.
11 and 12 demonstrate that the
two
methods
(Eq.
10
and
33)
produce nearly
identical results in the
rigid
limit.
Specifically,
the
assumptions
made
leading
to
Eq.
10,
set-ting
wn
=0 and
neglecting
transitions allowed
by mixing
of
nuclear
spin states,
are
reasonable under these conditions.
The
overlays
on
the bottom three
rows
of
the left-hand
column of
Fig.
11
demonstrate that the molecular
trajectory
approach
gives
results in close agreement with those
ob-tained
by using
algorithms
developed by
Freed and
co-workers
(Schneider
and
Freed, 1989)
for
spatially
isolated
nitroxides.
For
the calculation shown in the lower left-hand
corner
of
Fig.
11,
the
following
parameters
were
used,
At
=2.5
X
10-9
second
N,
=
128
Ns
=1000
Ntraj
=256
K
=0.13835
which
give
expected values of DR
=33.3
X10-6
S-1,
T1
15 ns, T2
=5 ns, and T3
=2.5 ns.
Excellent fits to the
calculated correlation functions (data and fits not shown)
were
obtained using single exponential decays with actual
best fit
decay
times
of
Tr
=15.5 ns, T2
=4.95 ns, and T3
=2.48
ns.
Remarkably, the molecular trajectory approach
outlined above is
a
reasonable model for
isotropic
rotational
diffusion,
even
when
Ns
>N,1.
FIGURE 1O Structure ofN6-SL-NAD+-GAPDHtetramer asdetermined fromthe molecularmodeling.Allfour
N6-SL-NAD'
cofactorsareshowninbold. The lowerpair of GAPD subunitsshows the backboneonly.The upperpairshowsbackbone and side chains.ThecrystallographicRaxis is
extending upward throughthe tetramer.
DISCUSSION
Historically,
the
use
of
EPR
spectroscopy of
dipolar
cou-pled
nitroxide
spin-labels
to
determine structural features of
proteins
and other macromolecular systems has been limited
by
the
paucity
of systems that
intrinsically
contain
appro-priate sites for
spin-labeling. However, advances in the
techniques
of
molecular
biology
now
provide
the
ability
to
introduce
specific
labeling sites into target proteins. By
judicious
selection of sites
for introduction of cysteine
res-idues,
nitroxides
can
be
selectively incorporated
into
pro-teins in close enough
proximity
to
produce measurable
dipolar coupling (Hubbell
et
al., 1996).
These advances in
site-directed
spin-labeling
have prompted the
development
of the methods reported in this work, which can be used to
rigorously analyze data from these new experiments.
Mechanisms of spin-spin coupling
Determination of the distance between interacting
spin-labels requires consideration of two different mechanisms
of
interaction. The
first, exchange
coupling, is often a close
range
effect, which in the simplest form requires overlap of
the molecular orbitals
containing
the unpaired electrons
either from static
proximity
or
by collisions due to dynamic
[image:11.576.89.233.53.262.2] [image:11.576.304.543.53.341.2]Volume 74 April 1997
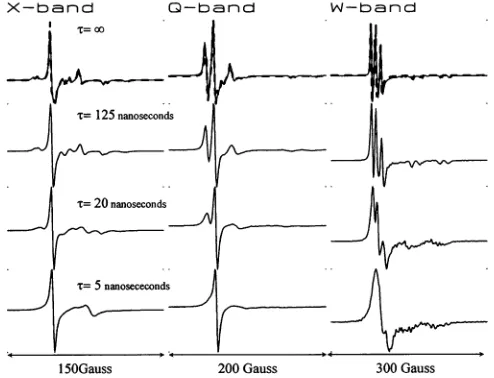
X-band Q-band W-band
[image:12.576.36.281.52.243.2]150Gauss 200Gauss 300Gauss
FIGURE 11 Simulations of the CW-EPR spectra at X-, Q-, and W-band of dipolar coupled nitroxides undergoing rigid body isotropic rotational diffusionwith (= q = a = , = -y= 00 and R= 50
A;
g,
= 2.00725;gll=2.00200; A1 =9.0 Gauss;
All
=45.0 Gauss. The isotropic rotational correlationtimes,Ti = 1/6D, are from top to bottom:TC= oo,Tc= 125 ns,Tc
= 20 ns,Tc= 5 ns.T2e = 76 ns,correspondingto alinewidth of 0.75 Gauss. Field andfrequency parameters were the same as used for Figs. 3-6. Overlaid on the toprow are simulations (dashed lines) calculated using the rigid limit model of Eq. 10. Overlaid on the bottom three rows of the left-hand column aresimulations (dashed lines) calculated using the algorithms ofSchneider and Freed (1989) for spatially isolated nitroxides.processes. The second, dipolar coupling, is a longer range
effect,
which arises
from magnetic
interactions between the
unpaired electrons. A
comprehensive
review of these two
X-band I
'T=oo
0-band W-band
15OGauss 200 Gauss 300 Gauss
FIGURE 12 Simulations of the CW-EPR spectraatX-,Q-,and W-band ofdipolarcoupled nitroxides undergoing rigid body isotropic rotational diffusion with (= -q = a = ( = y= 0°andR = 15
A;
g, =2.00725;
gil
=2.00200;A1
=9.0Gauss;Ali
=45.0 Gauss. Theisotropicrotational correlationtimes,T;
= 1/6D,arefrom toptobottom:T;=00,
T;= 125 ns,Tr= 20ns, TC= 5ns.
T2e
=76ns.Field andfrequency parameters
werethe same asused forFigs. 3-6.Overlaidonthe toprow are simulations
(dashed lines)calculatedusingthe
rigid
limit model ofEq.
10.mechanisms of spin-spin coupling has been provided by
Eaton and Eaton (1989). The interested reader is directed to
this review, and r
![FIGURE 2Structure of ['5N,D17]-N6-SL-NAD+.](https://thumb-ap.123doks.com/thumbv2/123dok/627544.166024/4.576.320.523.573.709/figure-structure-of-n-d-n-sl-nad.webp)