HIKARI Ltd, www.m-hikari.com http://dx.doi.org/10.12988/ams.2014.43223
Temporal Changes in Urban Green Space Based on
Normalized Difference Vegetation Index
Asmala Ahmad, Burhanuddin Mohd Aboobaider, Mohd Sa’ari Mohamad Isa
Department of Industrial Computing
Faculty of Information and Communication Technology Universiti Teknikal Malaysia Melaka (UTeM), Malaysia
Noorazuan Md Hashim, Mochamad Rosul, Sulong Muhamad and Shamsuddin Man
School of Social, Development and Environmental Studies Faculty of Social Sciences & Humanities
Universiti Kebangsaan Malaysia (UKM), Malaysia
Copyright © 2014 Asmala Ahmad et al. This is an open access article distributed under the Creative Commons Attribution License, which permits unrestricted use, distribution, and reproduction in any medium, provided the original work is properly cited.
Abstract
This study identifies land use changes in the metropolitan region of Klang-Langat Valley focusing on urban sprawl and green space. A technique called Normalized Difference Vegetation Index (NDVI) is used to quantify temporal urban green space dynamics. All districts in the valley recorded a marked increase in urban area, but decreased in agriculture and forest areas. Result of vegetation index analysis showed that NDVI increases for water body, bare soil, and built-up area category for as much as 16.98% from 1998 to 2001, but during the same period vegetation experience a decrease of 22.25%.
1 Introduction
Changes in urban land use change are global phenomena that occur in almost all countries throughout the world [5], [6]. Currit and Easterling [10] pointed that economic globalization and population growth as drivers of land use changes. This is also supported by the fact that land use changes are a major factor in global environmental change because of its interactions with climate, ecosystem processes, biogeochemical cycles, biodiversity, human activities, carbon budgets and sustainability. Global environmental change has prompted concerns over the critical role of urban areas in global system. Urbanization, both as a social phenomenon and a physical transformation of land use, is a powerful, often irreversible and highly visible anthropogenic force worldwide. Urban land use change has many implications socially, economically, spatially and physically. Sometimes these problems are difficult to solve because of the complexity of natural and human systems. Rapid urban population growth and the expansion of urbanized area affects natural and human systems at all geographic scales [8]. Economic globalization and growth in Southeast Asia has sped land use changes in suburb and peripheries. Both naturally occurring (e.g. forest fire) and human induced (e.g. urbanisation) deforestation have been known as an ongoing issues regionally as well as globally [9], [11]. A decrease in forest cover results in an increase in temperature, impervious areas and surface run-off [12], [13], [7]. As population grows, there are other accompanying problems such as crowding, housing shortages and insufficient or obsolete infrastructure [8], [14]. Satellite imagery has been extensively used to detect changes in land cover [14], [2], [4]. This is done by analysing changes in spectral and statistical properties of images from different dates for a particular area of interest. A number of methods can be used for change detection purposes. Among the frequently used technique is known as image differencing, which involves pixel-by-pixel subtraction of the reflectance of one image from another. The outcome is an image containing increased and decreased reflectance of surface features. Later, researchers initiated some improvement by using ratio image differencing; an index called normalised difference vegetation index (NDVI) is introduced where normalised difference of reflectance from the near infrared and visible red bands is calculated from the image using [7]:
Near IR Band Red Band NDVI
Near IR Band Red Band −
=
+ (1)
This paper attempts to estimate temporal changes in urban green space by means of NDVI. Quantitative and qualitative analyses are later carried out to determine the effectiveness of the method.
2 Materials and Methods
The study area is in Klang-Langat Valley, Malaysia, that located central districts (viz. Kuala Lumpur, Petaling and Klang) northern districts (viz. Kuala Selangor, Hulu Selangor and Gombak) and southern districts (viz. Part of Selangor and Putrajaya). These areas is located between longitude 101o 12’ to 102o 00’ E and latitude 2o 35’ to 3o 25’ N. The Klang-Langat Valley was chosen as the study area because it locates several urban centres such as Shah Alam, Petaling Jaya, Subang Jaya, Bandar Baru Bangi, Kajang, Kuala Lumpur and Putrajaya. In addition, this area also experiences rapid population growth and urbanization, resulting in drastic land use changes and severe environmental problems. Petaling recorded the highest population and Hulu Selangor was the biggest in term of area. Being a tropical climate, its daily temperature ranges from 23°C to 33°C. Humidity usually exceeds 80% and annual rainfall is 2,700 mm. Rain falls every month throughout the year, but December, January and February are the wettest months, over the years, brought by the Northeast Monsoon, vegetation cover has reduced tremendously in the Klang-Langat Valley as economic development and urbanisation proceed rapidly. Landsat TM satellite data from 1989, 1990, 1991, 1993, 1996, 1998 and 2001 were used in this study. The data were selected based on having the least cloud cover so that only minimum cloud masking needed to be done [1], [3]. Initially, the Landsat data were geometrically rectified based on topographic maps. The other type of data used in this study were land use data and the population data for various districts and periods. Multi-temporal analysis technique was used to identify land use changes. All processing tasks were done using Erdas Imagine software. Initially, land use change was analysed visually by assigning bands 4, 3 and 2 to red, green and blue. By doing so, the land use pattern and trend, linkage between places and location of the land use changes can be determined. The Landsat has seven bands where band 3 records visible red measurement while band 4 records near infrared measurement; hence the NDVI was be determined using:
NDVI=Band 4−Band 3
Band 4+Band3 (2)
images were generated. Changes in NDVI were spatially analysed by integrating NDVI images from different dates.
3 Results and Discussion
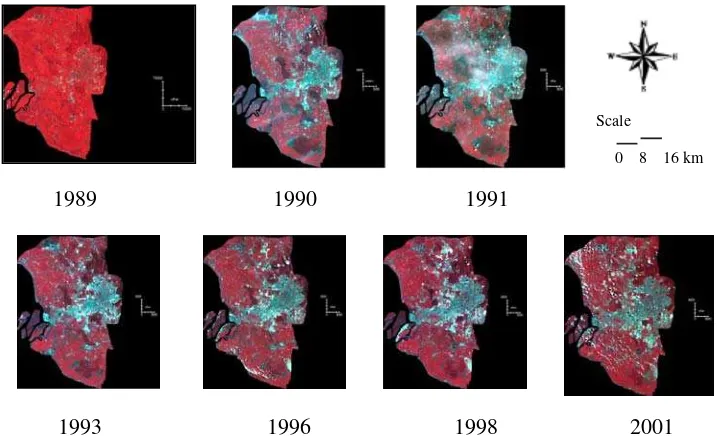
Figure 1 shows Landsat bands 4, 5 and 3 assigned red, green and blue from 1989, 1990, 1991, 1993, 1996, 1998 and 2001.There were three main classes of land use identified in the study area, i.e. urban, agriculture and forest. From visual analysis, it can be seen that Petaling was mostly occupied with urban, Kuala Langat and Kuala Selangor were dominated by agriculture, while Hulu Selangor was largely covered by forest. From the analysis, it was found that land use changes were rapid in the north from 1989 to 1993, but later, from 1996 to 2001, land use changes gravitate to the south.
1989 1990 1991
1993 1996 1998 2001
Fig. 1. Landsat bands 4, 5 and 3 assigned red, green and blue from 1989, 1990, 1991, 1993, 1996, 1998 and 2001.
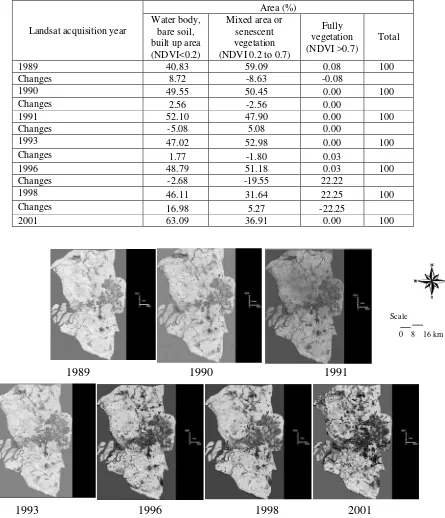
Figure 2 shows NDVI images from 1989, 1990, 1991, 1993, 1996, 1998 and 2001. NDVI was categorised into three classes i) water body, bare soil, and built-up area; ii) mixed area and iii) fully vegetation area. Until 1998, the study area was classified as a mixed area but in 2001, it was occupied with water body, bare soil, and built-up surface. Table 1 shows the NDVI derived from Landsat from 1989, 1990, 1991, 1993, 1996, 1998 and 2001. It is found that from 1989 to 2001, there is an increase in NDVI for water body, bare soil and built-up while the NDVI for mixed or senescent vegetation areas decreases. There is almost none fully vegetation NDVI from 1989 to 1996.
Table 1: NDVI derived from Landsat from 1989, 1990, 1991, 1993, 1996, 1998 and 2001.
Landsat acquisition year
Area (%) Water body,
bare soil, built up area (NDVI<0.2)
Mixed area or senescent vegetation (NDVI 0.2 to 0.7)
Fully vegetation (NDVI >0.7)
Total
1989 40.83 59.09 0.08 100
Changes 8.72 -8.63 -0.08
1990 49.55 50.45 0.00 100
Changes 2.56 -2.56 0.00
1991 52.10 47.90 0.00 100
Changes -5.08 5.08 0.00
1993 47.02 52.98 0.00 100
Changes 1.77 -1.80 0.03
1996 48.79 51.18 0.03 100
Changes -2.68 -19.55 22.22
1998 46.11 31.64 22.25 100
Changes 16.98 5.27 -22.25
2001 63.09 36.91 0.00 100
1989 1990 1991
1989 1990 1991
1993 1996 1998 2001
Fig. 2. NDVI image from 1989, 1990, 1991, 1993, 1996, 1998 and 2001.
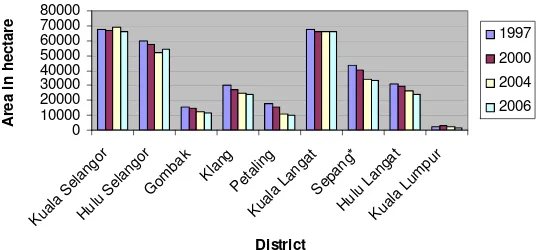
Figure 3 and 4 shows urban and agriculture land use respectively for 1997, 2000, 2004 and 2006 for the area under study based on the data from Department of Agri-
culture, Malaysia. There is an increase and decrease in the overall urban and agriculture land use change respectively in Kuala Selangor, Hulu Selangor, Gombak, Klang, Petaling, Kuala Langat, Sepang, Hulu Langat and Kuala Lumpur from 1997 to 2006. A noticeable increase in built-up areas occured in Gombak, Klang, Petaling, Sepang and Hulu Langat. This, in turn resulted in an obvious decrease in the agriculture land use in those districts. Not much changes in both urban and agriculture land use occurred in Kuala Selangor, Hulu Selangor, Kuala Langat and Kuala Lumpur. The first three can considered as rural areas therefore not much development took place, while the last is the capital of Malaysia where already located much built-up areas since several decades ago consequently only minimal land use changes occurred there since 1997.
0
Fig. 3. Urban land use for 1997, 2000, 2004 and 2006. (Source: Department of Agriculture Malaysia)
0
Fig. 4. Agriculture land use for 1997, 2000, 2004 and 2006. (Source: Department of Agriculture Malaysia)
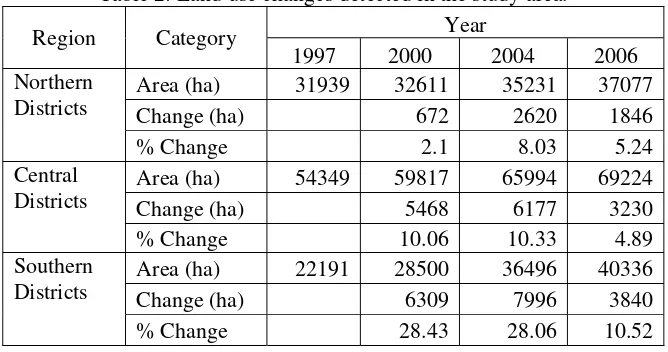
in urban areas from 1997 to 2006. It can be seen that from 1997 to 2000, there is 40.6% change in land use in which is consistent with the 44.5% change in NDVI from 1998 to 2001 that was derived using the Landsat satellite. Due to data constraint, an exact match in the acquisition period for the data from the Department of Agriculture and Landsat satellite is not available for this study. A difference of 3.91% is considered valid when taking account of the minimal period where the both data not overlapped. This indicates that the temporal changes in green space based on the satellite’s derived NDVI can be used as an indicator for the land use changes that occurred in the study area.
Table 2: Land use changes detected in the study area. Region Category Year
1997 2000 2004 2006 Northern
Districts
Area (ha) 31939 32611 35231 37077 Change (ha) 672 2620 1846 % Change 2.1 8.03 5.24 Central
Districts
Area (ha) 54349 59817 65994 69224 Change (ha) 5468 6177 3230 % Change 10.06 10.33 4.89 Southern
Districts
Area (ha) 22191 28500 36496 40336 Change (ha) 6309 7996 3840 % Change 28.43 28.06 10.52
The derived NDVI images also signify that there was a considerable expansion of built-up areas from 1989 to 2006. More lands were converted from agriculture land and forest to built-up area. In this period, Malaysia underwent rapid economic growth and started embarking of a large number of public infrastructure projects, the size of agricultural land conversion in the non-urban districts was two times larger than in urban districts. This land conversion in the non-urban districts has been the source of much of the sprawl found in the Klang-Langat’s peri-urban areas. The practice of non-urban land use control in Malaysia’s non-urban districts has led to unintended consequences. Despite the apparent increase in density in existing urban areas, the land use control system has resulted in urban sprawl outside the urban districts and consequently resulting in a substantial conversion of agricultural areas to suburban built lands.
4 Conclusions
environmental change. It is shown that visual interpretation of the NDVI images provides a quick overall picture on the land use changes that occured. Finally, the 3.91% difference between the satellite’s derived NDVI and the data from the Department of Agriculture, Malaysia signifies the usefulness of the satellite’s derived NDVI in determining land use change. Therefore the proposed method can be used as a practical and effective means for determining temporal changes in urban green space.
References
[1] A. Ahmad and S. Quegan, Cloud masking for remotely sensed data using spectral and principal components analysis, Engineering, Technology & Applied Science Research (ETASR), 2 (3) (2012). 221 – 225.
[2] A. Ahmad and S. Quegan, Comparative analysis of supervised and unsupervised classification on multispectral data, Applied Mathematical Sciences, 7(74) (2013), 3681 – 3694.
[3] A. Ahmad and S. Quegan, Multitemporal Cloud Detection and Masking Using MODIS Data, Applied Mathematical Sciences, 8(7) (2014), 345 – 353.
[4] A. Ahmad, Classification Simulation of RazakSAT Satellite, Procedia Engineering, 53(2013), 472 – 482.
[5] B. K. Ademola and T. Onishi, Spatial determinants of urban land use change in Lagos, Nigeria, Land Use Policy, 24(2) 2007, 502 – 515.
[6] C. Xiao-Ling, Z. Hong-Mei, L. Ping-Xiang, Y. Zhi-Yong Yin, Remote sensing image-based analysis of the relationship between urban heat island and land use/cover changes, Remote Sensing of Environment, 104 (2006), 133 – 146. [7] J. C. Jiménez-Muñoz, J. A. Sobrino, A. Gillespie, D. Sabol, W. T. Gustafson,
Improved land surface emissivities over agricultural areas using ASTER NDVI, Remote Sensing of Environment, 103 (2006), 474–487.
[8] K. Rostam, Pembandaran dan perkembangan wilayah metropolitan lanjutan lembah Klang-Langat Malaysia, Jurnal e-Bangi, 1(1) (2006), 1 – 27.
[10] N. Currit and W. E. Easterling, Globalization and population drivers of rural-urban land use change in Chihuahua, Mexico, Land Use Policy, 26 (2009), 535 – 544.
[11] N. M. Hashim and A. Asmala, Tepubina bandar: isu dan kaitannya dengan kesihatan ekosistem lembangan saliran. Geografia, 4(1) (2007), 1 – 20.
[12] N. M. Hashim, A. Asmala, M. Abdullah, Mapping urban heat island phenomenon: Remote sensing approach, 68(3) (2007), 25 – 30.
[13] S. A. Abdullah and N. Nakagoshi, Forest fragmentation and its correlation to human land use change in the state of Selangor, peninsular Malaysia, Forest Ecology and Management, 241 (2007), 39 – 48.
[14] X. Jieying, Y. Shen, J. Ge, R. Tateishi, C. Tang, Y. Liang, Z. Huang, Evaluating urban expansion and land use change in Shijiazhuang, China, by using GIS and remote sensing, Landscape and Urban Planning, 75 (2006), 69 – 80.