DOI: 10.12928/TELKOMNIKA.v14i2A.4372 34
Smart City Construction Assessment System Based on
Analytic Hierarchy Process-Quality Changsha as the
Case
Yongbo Liu1*, Xiangdong Zhu2 1
Department of management, Hunan City University, Yiyang, Hunan, 413002, China 2
Business School of Central South University, Changsha, Hunan, 410083, China *Corresponding author, e-mail: [email protected]
Abstract
With the rapid development of science and technology and the accelerated pace of urbanization, the construction of smart city has been also widely spread across our country. Although smart city construction is making progress, the smart city assessment system has been barely used to evaluate the situation of smart city construction. Therefore, a case study of “Quality Changsha” has been covered in this paper and the AHP (analytic hierarchy process) has been employed in this case to assess the smart construction of Changsha from five aspects: intelligent infrastructure services, intelligent manageability, intelligent services, intelligent economy and intelligent security system, which totally involve 18 indexes. And a conclusion was also made by combining the research results and actual situation of Changsha city.
Keywords: Smart city, analytic hierarchy process, assessment index, Changsha city
Copyright © 2016 Universitas Ahmad Dahlan. All rights reserved.
1. Introduction
Since the 21st century, with the building of socialist modernization and impetus of the science and technology, our country presents a totally new look. The urban residents rise sharply along with the urbanization level increases quickly under the guidance of the grand goal of building a moderately prosperous society in all respects. However, though we have got excellent performance in national modernization construction, there are still many problems arising from the urban population surging, such as urban management, traffic congestion, environmental pollution, municipal infrastructure construction. These issues always remind us that the new type urbanization is an urgent need for our urbanization [1]. Hence, our government has proposed the strategy of four modernizations construction (ie. industrialization, informatization, urbanization and agricultural modernization), focusing on realize the grand goal of building a well-off society in an all-round way driven by the integration and promotion of above four points. At the meantime, the related national departments have released policies and measures on smart city construction to realize a stable and long-term development of city on the base of new type urbanization [2].
smart city evaluation index system released by certificate authorities, aims to evaluate and summarize the Changsha smart city construction combining with the reality of Changsha.
2. Methodology
2.1. Overview of Smart city 2.1.1. Definition of the Smart City
With the development and progress of human society, the population keeps increasing and transferring to city, as a result, the bearing capacity of city decreased sharply and a series of city management problems occurs. To solve the problem of urban management, maintain good social order and realize the steady and rapid economic growth, smart city construction becomes an unstoppable trend.
The so-called smart city uses modern technical means such as information technology and communication technology to integrate urban resources, and utilizes key urban operation information to response urban management activities intelligently such as public security, environmental protection [9]. Smart city is essentially the smart management of city with information technology support, to create a good living and working environment for citizens, improving their living standards and promoting the sustainable development of city [10, 11].
2.1.2. Characteristics of Smart City
Based on the above definition of smart city, it has the following four characteristics: a) Wide network coverage
It can be seen from the definition of smart city that the smart city construction takes advantage of modern information and communication technologies. City information can only be collected and managed effectively and performs immediate response with these technologies support.
b) Resource sharing
By means of the developed information network, information asymmetry can be reduced. All resources are been fully utilized through unified deployment to optimize the allocation of social resources.
c) Intelligent response
Through the collection, handling, deep processing of large amount of information during the urban management, intelligent judgment and a timely and fast response can be realized. Finally, optimal decisions can be obtained to promote the value of information effectively. d) Open information application
Urban management department processes the information collected from urban central system and transfers to demander, during which the utilization and value of information could be greatly enhanced. While this kind of information should be shared for individuals, enterprises or other units through an open application platform. Only in this way, the city information resources can be fully utilized.
2.2. Overview of Analytic Hierarchy Process 2.2.1. Analytic Hierarchy Process
In 1970s, Professor Saaty from Pittsburgh University, a United States operations research scientist, proposed an effective multi-target decision method combining qualitative analysis with quantitative analysis (namely analytic hierarchy process, AHP). The basic principle of AHP is dividing the decision index of unsolved problem into several levels, and finding out the relationship between them, then determining the relative importance of each index in each level by pairwise comparison, to sorting the relative importance of the each program based on judgment from professionals. Finally, the decisions are made [12-14].
2.2.2. AHP Procedures
From the above introduction of the basic principles of AHP, it can be divided into the following five steps:
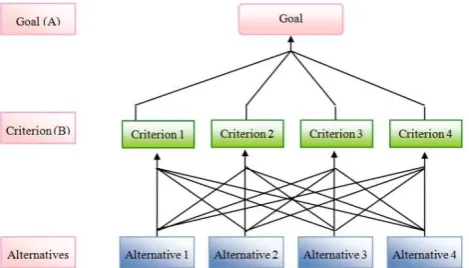
A complex decision problem can always be divided into different levels (generally three), which consist of different indicators:
Level 1, the goal level (A): the goal that entire decision-making problem expects to achieve.
Level 2, the criterion level (B): the criteria to be followed.
Level 3, the index level (C): consisting of specific measurable indicators. The recursion order hierarchy structure model of AHP is shown in Figure 1:
Figure 1. The hierarchical structure model of AHP
b) Constructing the whole judgment matrixes for each level
In terms of the decision problem, experts in relevant fields will give a mark according to the judgment scale as shown in Table 1. Then the corresponding importance weights are given by pairwise comparison. Constructing of a judgment matrix is based on the score given by experts.
Table 1. The meaning of importance scale Scale Meaning
1 Pairwise comparison, equal important
3 Pairwise comparison, the former is slightly more important than the latter 5 Pairwise comparison, the former is more important than the latter 7 Pairwise comparison, the former is strongly more important than the latter 9 Pairwise comparison, the former is extremely more important than the latter 2,4,6,8 The middle value of above adjacent judgment
Reciprocal Comparison in pairs, the scale of importance of latter to former
c) Single level sorting and consistency checking
Constructing each judgment matrix based on step 2, and calculating the weight of each factor on the criterion. There are three methods for calculating weight including summation, root and exponentiation. The root method is introduced detailedly in this paper. The computation formulas are as follows:
n n
j ij
i
a
W
1
1
)
(
(1)
i i i i
W
W
W
0 (2)Step 1: Calculate the consistency index C. I.
Where, n is the matrix order, and λ is the eigenvalues of matrix.
Step 2: check the table and determine the corresponding average random consistency index R. I., as displayed in Table 2.
Table 2. Average random consistency index R.I.
Step 3: Calculate the consistency ratio C. R., and make a judgment.
.
If C.R.<0.1, the consistency of judgment matrix meets the requirements; If C.R.>0.1, the consistency of judgment matrix does not meet the requirements, a revision is needed.
d) Total sorts of levels.
Calculate the relative weight of each level against its upper level, composing level by level from bottom to top.
e) Result analysis
The relative weights are sorted according to the results of the first four steps. And the decision scheme is determined after analysis.
2.3. Smart City Construction Assessment System-the Construction of “Quality Changsha as Case”
Changsha, capital city of Hunan Province, is the second largest city in central China. It is located in the east of Hunan province and the politics, economy, culture, transportation, and science and education center of Hunan province; it has more than three thousand years of splendid ancient civilization and also the birthplace of Chu-han culture and Hu-xiang culture. At present, to build a cultural city with international influence, Changsha is jointing Zhuzhou and Xiangtan, which are two big cities in Hunan province, to built Changzhutan city group and promote the construction of “Quality Changsha”.
Recently, the smart city construction in our country booms, and the Meixihu international service area of Changsha had entered the first list of national smart city construction, which provides a reference for the smart city construction of Changsha. The smart city construction of Changsha has been lasting for two years. This paper will take the “Quality Changsha” as example to assess the smart city construction of Changsha by building a smart city index system.
2.3.1. Building Recursion order Hierarchy Structure Model
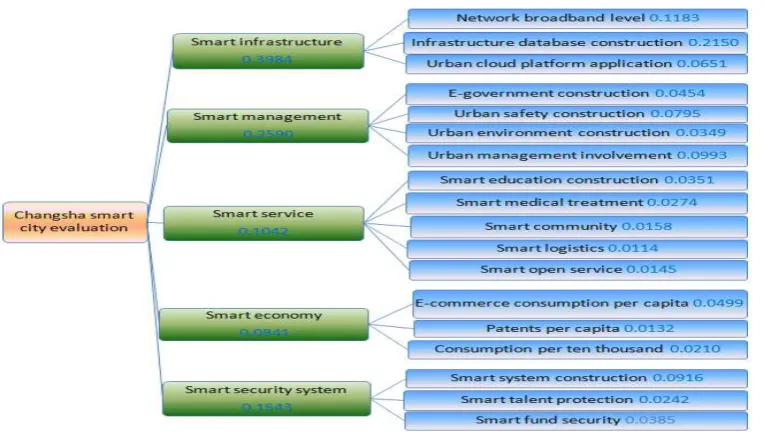
In recent years, there are a lot of researches on the evaluation system of smart city construction. The Austria Vienna University of Technology has assessed several medium-sized cities in Europe with a series of index by collaborating with other authorities (2007). IBM has proposed that the smart city construction should be based on a six level evaluation system involving people, business, transportation, communication, water and energy in a white book of smart city (2009). Deng et al. (2010) and China Intelligence Engineering Research Association (2011) have also proposed their assessment system. This paper references the index system of the fourth China smart city evaluation (2014), makes an evaluation based on the three principles of scientific, systematic and hierarchical and the actual situation of Changsha City. As displayed in the recursion order hierarchy structure model (Figure 2), the indicator system includes following aspects:
n 1 2 3 4 5 6 7 8 9 10 11 12
Figure 2. The smart city evaluation recursion order hierarchy structure model of Changsha
a) Smart infrastructure
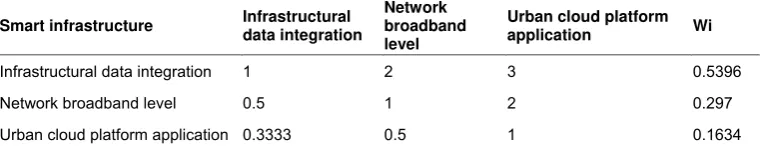
Smart infrastructure is the cornerstone for building a smart city, the city with mature infrastructure construction will lead in every aspect. It could be measured from these three aspects: network broadband level, infrastructure construction, urban cloud platform application.
b) Smart management
Smart management refers to the ability of intelligent ruling and urban management, mainly includes these four aspects: e-government construction, urban safety construction, urban environment construction, and urban management participation.
c) Smart service
Smart service refers to the usage of modern technology to provide smart services for people, including five aspects: smart education construction, smart medical treatment, smart community smart logistics, and smart open service.
d) Smart economy
Smart economy refers to the income brought by smart city construction, including three aspects: e-commerce consumption per capita, patents per capita and energy consumption per ten thousand yuan GDP.
e) Smart security system
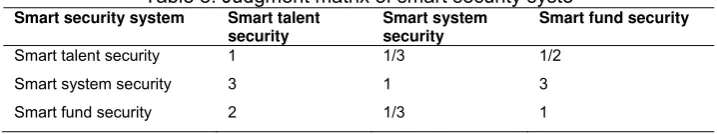
Smart security system refers to the use of the wisdom infrastructure to build up the smart protection, including three aspects: smart system construction, smart talent protection, and smart fund security.
2.3.2. Constructing the Judgment Matrix of All Levels
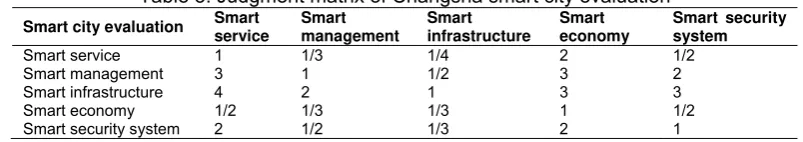
According to the actual development situation of Changsha city, combining the insights and evaluation of relevant domain experts for the smart urban construction, and referencing the binary comparison scale table, the judgment matrix can be obtained as Table 3-8:
Table 3. Judgment matrix of Changsha smart city evaluation Smart city evaluation Smart
service
Smart management
Smart infrastructure
Smart economy
Smart security system
Smart service 1 1/3 1/4 2 1/2
Smart management 3 1 1/2 3 2
Smart infrastructure 4 2 1 3 3
Smart economy 1/2 1/3 1/3 1 1/2
Table 4. Judgment matrix of smart service
Table 5. Judgment matrix of smart management
Smart management
Table 6. Judgment matrix of smart infrastructure
Smart infrastructure Infrastructural data integration
Network Broadband level
Urban cloud platform application
Infrastructural data integration 1 2 3
Network Broadband level 1/2 1 2
Urban cloud platform
application 1/3 1/2 1
Table 7. Judgment matrix of smart economy
Smart economy Patents
per capita
Table 8. Judgment matrix of smart security syste Smart security system Smart talent
security
2.3.3. Hierarchy Single Sorting and Consistency Checking
Table 9. Consistency checking of Changsha smart city evaluation
Changsha smart city evaluation Consistency ratio: 0.0315, Weight to “Changsha smart city evaluation” : 1.0000; λmax: 5.1411
Changsha smart city
Table 10. Consistency checking of smart service
Smart service Consistency check ratio: 0.0576
Weight to “Changsha smart city evaluation” : 0.1042; λmax: 5.2582
Smart service
Table 11. Consistency checking of smart management
Smart management consistency ratio: 0.0806;
Weight to “Changsha smart city evaluation” : 0.2590; λmax: 4.2153
Smart management
Urban environmental construction 0.5 0.5 1 0.5 0.1346
E-government construction 0.3333 0.5 2 1 0.1752
Table 12. Consistency check of smart infrastructure
Smart infrastructure Consistency ratio: 0.0088;
Weight to “Changsha smart city evaluation”: 0.3984; λmax: 3.0092
Smart infrastructure Infrastructural data integration
Infrastructural data integration 1 2 3 0.5396
Network broadband level 0.5 1 2 0.297
Table 13. Consistency check of smart economy
Smart economy consistency ratio: 0.0516;
Weight to “Changsha smart city evaluation”: 0.0841; λmax: 3.0536
Smart economy Patens per
capita
E-commerce consumption per capita
GDP consumption per ten thousand Wi
Patens per capita 1 0.3333 0.5 0.1571
E-commerce consumption per capita 3 1 3 0.5936
Power consumption/ten thousand yuan GDP 2 0.3333 1 0.2493
Table 14. Consistency check of smart security system
Smart security system Consistency ratio: 0.0516;
Weight to “Changsha smart city evaluation”: 0.1543; λmax: 3.0536
Smart security system Smart talents security
Smart system security
Smart fund security
Wi
Smart talents security 1 0.3333 0.5 0.1571
Smart system security 3 1 3 0.5936
Smart fund security 2 0.3333 1 0.2493
2.3.4. Total Ordering of Level
After the calculation of the matrix and relative weight in the third step, a table can be draw as Table 15 and 16:
Table 15. Weight sorting of middle layer elements to objective decision Middle layer
elements
Smart infrastructure
Smart management
Smart security system
Smart service
Smart economy
Weight 0.3984 0.259 0.1543 0.1042 0.0841
Table 16. Weight sorting of scheme level elements to decision goal
Alternatives Weight Alternatives Weight
Infrastructural database construction 0.215 Smart education construction 0.0351
network broadband level 0.1183 Urban environmental construction 0.0349
Participation of urban management 0.0993 Smart medical construction 0.0274
Smart system security 0.0916 Smart talents guarantee 0.0242
Urban safety construction 0.0795 GDP consumption per ten thousand 0.021
Urban cloud platform application 0.0651 Smart community construction 0.0158
E-commerce consumption per capita 0.0499 Smart open service 0.0145
E-government construction 0.0454 Patents per capita 0.0132
Smart fund security 0.0385 Logistics Smart construction 0.0114
Figure 3. The relative weight of each level in the recursion order hierarchy structure model
3. Result Analysis
From the above four steps calculation and analysis process, it can be seen that infrastructure plays the most important role in the criterion level for Changsha smart city construction, followed by the smart management, smart security system, smart service, smart economy. The infrastructure construction, which could support the construction of other aspect, is the foundation of smart city construction. The smart economy comes in last, which in some content reflects the embarrassment situation of central city because of its wicked geographical location. In totally, this assessment indicator system could make a good evaluation of Changsha smart city construction.
4. Conclusions
In the time of science and technology changing rapidly, the trend of smart city construction cannot be halted and the smart city construction in China has made some progress. This paper introduced the definition of smart city and AHP in detail, and builds a smart city assessment system of Changsha taking “Quantity Changsha” as example, based on the actual situation of Changsha smart city construction. Moreover, an evaluation of Changsha smart city construction has been made, setting a reference for the later smart city construction of Changsha.
References
[1] Song XP, Liang Y, Zhang C, et al. Research on the Estimate on the Orientation of the Seismic Signal Based on the Single Vector Vibration Transducer. Fire Control & Command Control. 2013; 38(5): 18-21.
[2] Shengzu Gu. On the National Strategy of Informatization.China Soft Science. 2001; 12: 5-10.
[3] Neirotti P, De Marco A, Cagliano AC, Mangano G, Scorrano F. Current trends in Smart City initiatives: Some stylised facts. Cities. 2014; 38: 25-36.
[4] Nair MP, Nithiyananthan K. Effective Cable Sizing model for Building Electrical Services.Bulletin of
Electrical Engineering and Informatics. 2016; 5(1): 1-8.
[5] Wei R, Shen X, Yang Y. Urban Real-Time Traffic Monitoring Method Based on the Simplified Network Model. International Journal of Multimedia & Ubiquitous Engineering. 2016; 11(3): 199-208.
[6] S Allwinkle, P Cr Uickshank. Creating Smarter Cities: An Overview. Journal of Urban Technology. 2011; 18(2): 1-16.
[8] Dadkhah M, Sutikno T. Phishing or hijacking? Forgers hijacked DU journal by copying content of another authenticate journal. Indonesian Journal of Electrical Engineering and Informatics (IJEEI). 2015; 3(3): 119-120.
[9] Cotilla-Sanchez E, Hines PDH, Barrows C, et al. Comparing the Topological and Electrical Structure of the North American Electric Power Infrastructure. Systems Journal IEEE. 2011; 6(4): 616-626. [10] T Sutikno, M Facta, GRA Markadeh. Progress in Artificial Intelligence Techniques: from Brain to
Emotion. TELKOMNIKA (Telecommunication Computing Electronics and Control). 2011; 9(2): 201-202.
[11] De NS, Leoncini X. Critical behavior of the XY-rotor model on regular and small-world networks.
Physical Review E Statistical Nonlinear & Soft Matter Physics. 2013; 88(1-1): 2252-2279.
[12] Schaffers H, Komninos N, Pallot M, Trousse B, Nilsson M, Oliveira A. Smart Cities and the FutureInternet: Towards Cooperation works for Innovation: Towards Cooperation Frame-works for Innovation. The Future Internet. Heidelberg: Springer. 2011; 431-446.
[13] Z Jiang, Y Liu, P Meng. Polygraph Survey and Evaluation Based on Analytic Hierarchy Process.
TELKOMNIKA Indonesian Journal of Electrical Engineering. 2014; 12(7): 5585-5590.