Prosiding Pelatihan untuk Pelatih, Pefrgeiokn Mayah Pesisir Terpadu
W U A S I
EKONONLI SU
PESllSIR
DAN
LAUTm
DR. IR. TRIDOYO KUSURaASTANTO, MS
Pusat G j i a n Surnberdaya Pesisir dan Lautan Fakultas Pefikanan dan Ilrnu Kelautan
InsGht Pertanian Bogor
tersebut. Sebagai ilustrasi Barbier (1 993) zone) mengemukakan kegunaan 6'Coastal Wetland" di
~ght"
Nicaragua seperti tercantum dalam Tabel 1. di wilayah tersebut di kelola oleh publik atau tidak (terlampir). Dari nilai ekonomi tersebut dapat terdapat kejelasm kepernilkamya. Pada negara- dinyatakan bahwa tingkatnegara berkembmg maupun maju
aktivitas
ekonorni penilaim e k o n o ~akan
selaludi wday pengelolm sumberdaya tvilayah pesisir, sehingga
'2 psatnya
/ i - pendekatan antar disiplin (interdisciplinauy ap-
berdaya pesisir termcm k e l e m L m 2 .
- Interhi antaratanahdanlautm gori peklaian ekonomi pang
hidrologi
di
t~iilayah pesisir mempuny& stik digunakan dalam rnernecahkan mas&&-masdah yang spesifik sehingga pembmgunan/pembahan kebijakan vvilayah pesisir @=bier, 1993) y a k 6 :pada wilayah tersebut dapat mengakibatkan 1. Pmgact analysis pakni kerusakan yang pengafuh (impact) ymg sangat "si
'.
Perilaku diakibatkan oleh suatu kegiatan pada sistem dari produsen yang mem t d m pesisir, khususnya berupadamp&
Lingkungan. konsumen ymg memaksi an utilitas d a l m Msal: penilaian kemsakm lingkungan pesisir memanfaatkan sumberdaya pesisir dapat karena-pahanminyak.mengakibatkan alokasi erdayadarm lin-gan 2. P a ~ I v a l u a b t t y a h i suatupenilaian atternatif ymgtidakefisiense~araekonorni.Dengandedan alokasi sumberdaya atau proyek yang campur tangan pemerintah diperlukan untuk lneng sistem pesisirlsumberdaya, dengan mengatur sumberdaya yang langka sehingga tuju atkm pilihm yang terbak pada
an (sus- p e m d a a m sistern sumberdaya pesisir.
Contoh : pemilihan altematif antara pernanfaatan Namm usaha-usaha tersebut sering menemrri sistem/sumber&ya pesisir untuk usaha perikanan
omi d m p e m e ~ t a h karang vs pariwisata bawah laut/karmg.
tentang d a i ekonomiJ 3. I;ion yakni penilaian ekonomi secara d a y a h pesisir. Kesulitanpenilaim dari sistern pesisir. Pendekatm ini ekonomi tersebut lebihnyata karena sutnberdaya
di
&l dalam menentukan nilai ekonomi total laya ah tersebut tidak diperdagmgkm di "pasar" m dalam akuntansi sumberdaya sehingga aplikasi dari p e ~ l a i a n sumberdaya yang nasional.Lid& dipasarkan (non market valuation) perlu
agar ' W e ofl" antara pembangunan $ari Wilingness to Pay WTP) dan WIZE'ngness to barang dan jasa yang disediakm oleh lingkungan Accept
W A )
dapat menjadi pertimbangan dalam pengmbilan Total kesejahteraan sosial (TotalSocial Wel- keputusan untuk pengelolaan wilayah pesisir fare) dari konsumsi barang dan jasa adalah sama (coastal zone managemenf/CZM) secara lestari. dengan jurnlah daxi setiap individu yakni area
pengeluaran (OXPb) dan consumer surplus (Pba). KONSEP DASAR PI%NILAIAN EKONOMI Dengan menggunakan harga (P) dan konsumsi
(X)
SMBERDAUA maka didapatkan minimum dugaan utilitas
Nilai sumberdaya pesisir tropis e.q mangrove (kegmaan) dari pemmfaatan faktor lingkungan. dan coral reef ditentukan oleh fimgsi surnberdaya Consumer surplus perlu dimasukkan untuk
Tabel 1. Uses of coastal wetland characteristics: North Pacific coast mangroves, Nicaragua
Forest resources Wildlife resources Fisheries
Forage resources Agricultural resources Water supply
Groundwater discharge Flood and flow control Shoreline stabilization Sediment retention Nutrient retention
Water quality maintenance Storm protectionhind break External suppoFt
Micro-climatic stabilization Recreation/tourism Water Transport
Biological diversity
Uniqueness to culturelheritage
cy: X = low
XX = medium XXX = high
menmgkap nil& kesel an bagi individu. Bila plus d m pengelu onsumsi pada pasar. Ben- f i o r Iingkungm
dini
(P=O) maka consumer efit sosial dapat d elalui fungsi pemintaan [image:2.595.61.555.63.662.2]Maksh&asi Kesejalateraara Sosial (Social
Wrenfare)
Barmg dan jasa yang dipasarkan dalam kondisi pasar yang tidak terdistorsi akan rnendapatkan harga yang mggarnbarkan harga Ymg se a untuk masyarakat. Nilhya sama dengm nilai pilihan t e r b d (best alternatza atau disebut sebagai "social" opportunity cost (shadw
Marginal Soc. Bent
price). Dithj au
dari
produsen maka marjinal cost rneningkat bila outputcost yang menggm
rneningkat dengan bertmbahnya supply. Harga ditetapkan di atas biaya maka daerah di atas supply dan di bawah harga disebut se Produser surplus
PS).
Kesejahteraan sosial total diukur dengan menjmlahkan PS d m CS d m nilalnya a k a
i d sosiaI beneJit WSB)
Valuasi ekonomi surnberdava ... (1
-
34) Nilai Ekonorni dam Metoda PennaianD d m pendekatan pedlaian secara ekonomi
d a l m penggunaan smberdaya klayah pesisir. CBA bertujuan untuk memaksimumkan kesejahteraan sosial dengan cara mengalokas&an surnberdaya seefisien mun-
Kriteria yang digunakan dalam evaluasi k e b i j h adalah sebagai berikut :
1. Net Present Value
e Total Economic Value = Total Use Value -I-
Non Use Value
=TDV
+
T I V+
OVe TDV
-
Total Direct Use Value :-
Extractive-
Non exkacfive e TEV-
Total Indirect Use Valuee OV
-
@tiom Value-
Potensial untuk digunakandi
masa depan.estruction yang ir reversible.
b. BV
-
Bequest Value-
preservasi natural heritage (warism darn) (tidak didiskon).c. EV
-
Existence ialuew V = B d + B e - C d - C e - C p
-
nilai dari ilmu pengetahurn tentang ekosistem.N2ai Ekolaomi dal*ir Penggunaan Ekosistem
Bd = Benefit langsung dari proyek Pesisir
Tabel 3. men ekonorrzi bervariasi yang
penggunaan yang multiple dan sering terjadi Cp = Biaya proteksi lingkungan penggunaan tersebut non compatible.
2. Internal Rate of Return (IRTig)
-
3.' Benefit Cost Ratio
4. Least Cost
Dalarn Total Valuation Approach dil
penilaian ekonomi
dari
se sistem sumberdaya pesisir. Tabel 2 menmjukkan konsep yang digunakan dalarn Total EGonomic Value.TEV = TUV
+
NUVMetoda Evaluasflenilaian Ekanomi
Beberapa metoda penilaian ekonofi disajikan pada tabel 4 berikut :
Sebslgian dari metodayang disajihpadatabel tersebut berdasarkan "'coast based & approach".
sebagian dari total economic value. Narnun demikian masih sangat berguna sebagai alat pengmbil keputusan.
1. COB (Chrmge o ~ z Productivty)
Pembahan kualitas lingkungan berpengaruh terhadap produktivitas dan biaya produksi. Diukur net and effect dari produksi pada saat dengan proyek dan tanpa proyek.
2. Haman Capital OfC)
-
Identifikasi pollutan yang menyebabkan sakit-
Tentukan hubungan dosis-responsedan
kejadianjumlah populasi yang terkena resiko
-
Hitung kehilangan waktu produktifdan
Valuasi ekonomi sumberdaya ... (1 - 34) IS $26 $4 m 1 yrs $I* $10 $212 %7 $11 175 05 18 $21 $374 199 $122 tin IQ Iha tm
r i a
$223 1113 LQ $138 ls M $52 $43 $32 $1 $112 % IO %7 $214 1548 P $12 $21 18 s t 5251 159 $14 $19 110 128 8% $4 $1
W n X a 6dim
&id* US.
CS w
CYM rn
CMI 9a&x
Temperate Forest (2955 million ha)
GrasslandslRangelands (3898 m~llton ha)
1
'OornguePm W2 S . $ i d R N c b f l O a s ) Dppxhadyma
euhealr(1eee) F - l W ( t e a 4 )
2 Nol S.$iSRNcb(1sSs) -& -dd.(tWl)
3 C W F n i ; * u a r 5 a b 6 R N c b ( l W 6 Porss (1994) BB)d
u n a * d . ( l B 1 ) F
- 6 P- (1994) 2--w=- k w k d d d . ( h p e s ) w&wdtfma Lweiapulhn Jwd.1(1%5)
-
( I S 1 B B ) s J r tw e d (1osa) o w h s a a L ( i s q
er?a*(1831) Natnni
5ab&-(lsss) J e . -d = L ( l S a % 7Sd-
( C l s 3 m l a n ) 5 a b h P n e i r ( l P q k r t e d d ( 1 s q r m a a ( 1 P q
9 W . s b . s a i -F
6 ma (1994) -*d (1996)
15- RnarsrdaL(lpas)
I t ~ o n a o i W d d . ( l P q
1 3 - m U S D d d C a m t l l i B n Ndnn
Tidal MushMangroves (165 million ha) T d d U32 W S232
Td* arrh
U Y
-*
HisCmn(1OOJ) WTp USAF-b-&;:z -dd(i9B4 m*
-*
us% UY:MNahw=l
z,
USA USALymh=;2 E g us4
U ( 1 9 B 4 ua;** VY
EEP -ad (1-q
Prosiding Pelatihan untuk Pelatih, Pengelolean Wileyah Pesisir Terpadu
USA USA USA USA USA
T W
TQm
Fil
USA
SwampslFloodplains (165 million ha)
USA
16. -R -1
z 2 z ( - l ThBr)au*DBo(lPO~) W + W P USA KVii.ri(lP95) T & d G+4=6Fc&s(tS?Sj W W t P m s M la* Fbms=m
cms;nnsan GRnSS%kqdd(l%a, wrr) m
ra&nOb.t.(18901 wIPh.mnr USA
GRnbSc6sWlt1%a, TCIBLvq m
Uhag
G R n S ~ l o i r ) T & W *ubtl
s
- (-1
T d e#.!sd a p h ~ F o a a ( ~ ~ IMPmr&tlo USA
-
--
-(190() IMP 0-34p t n r y m
LakeslRivers (200 million ha)
$Po tZY1
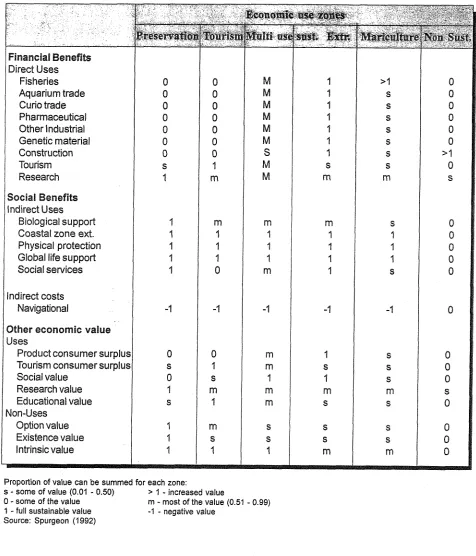
Table 3. Uses of coral reefs and economic use zoning
This illustrates the different proportions of each use and non-use value which could be added together in different reef use zones to give the Total Economic value of a reef system. The relevant proportions for each value are indicated here as multipliers which are further explained in the text
Financial Benefits
Direct Uses Fisheries Aquarium trade Curio trade Pharmaceutical Other lndustial Genetic material Construction Tourism Research
Sociaa Betliefits
indirect Uses Biological support Coastal zone ext. Physical protection Global life support Social services
Indirect costs Navigational
Other economic value
Uses
Product consumer surplus Tourism consumer surplus Social value
Research value Educa~onal value Non-Uses
Option value Existence value Intrinsic value
Proportion of value can be summed for each zone:
s
-
some of value (0.04-
0.50) > 1-
increased value0
-
some of t h e value m-
most of t h e value (0.51-
0.99)1
-
full sustainable value -I-
negative value [image:9.603.75.551.123.679.2]Valuasi ekonomi sumberdaya ... (1
-
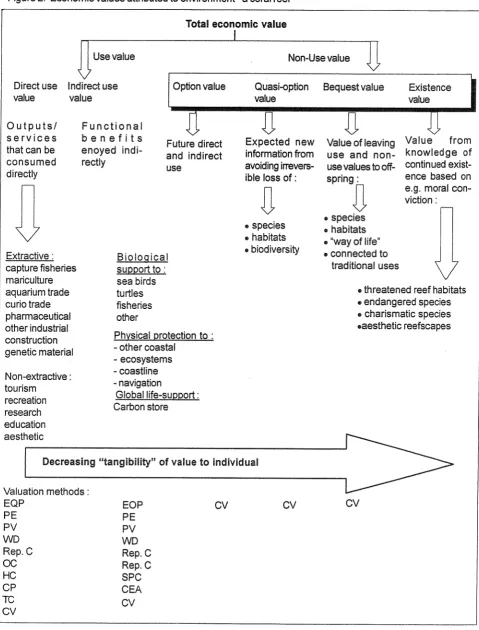
34)Figure 2. Economic values attributed to environment
-
a coral reefTotal economic value
Non-Use value
O u t p u t s / F u n c t i o n a l
i Future direct Expected new Value of leaving Value from
that can be enoyed indi- and indirect infomation fFom use and no"- kmowledge of consumed rectly
use avoiding imvers- use values to off- continued exist-
directly ible loss of : spring : ence based on
a
a
0
viction : -e.g. moral con-
species
species habitats
habitats "way of life"
Extractive : Bioloaical
.
.
connected tocapture fisheries s u ~ ~ o r t to : traditional uses
mariculture sea birds
aquarium trade turtles threatened reef habitats
curio trade fisheries 6 endangered species
pharmaceutical other charismatic species
other industrial .aesthetic reefscapes
construction Phvsical protection to : genetic material - other coastal
-
ecosystems Non-extractive :-
coastlinetourism
-
navigationrecreation Global life-support :
research Carbon store
education aesthetic
Decreasing ""tngibiliQn ' o f value to individual
Valuation methods : EQP
PE PV WD Rep. C
OC
HC CP TC CV
EOP CV GV CV
PE PV V\ID Rep. C Rep. C SPC CEA CV
[image:10.595.68.548.63.694.2]Prosicfino Pelafihan untuk Pefatih. PenaefoIaan WIayah Pesisir Terpadu
-
Nilai net contribu~on human capital terhadap produlrtivitas3.Oppclrtami& Cost Amproach (06)
-
Dengan CBA t e n a m net benefitdari
proyekbila positif selmjutnya
-
Nilai benefit &xi presenasi-
Bandin- keduanyaD PUS
Barbier, E.B. 1993. Sustainable use of wetlands-valuing
tropical wetland benefits. The Geographical
Journal 159.
Barton, D.N. 1994. Economic factors and valuation of tropi- cal coastal resources. University of Bergen.
spurge&, J.P.G. 1992. The economic valuation of coral reefs. Marine Pollution Bulletin 24.
Munasinghe, M. and E. Lutz. 1992. Envifonmental eco-
nomics and valuation in development decision mak-
ing. World Bank Emironmental Working Paper 51.
Dixon, J.A. and 6. Hodgson. 1988. Economic valuation of coastal resource. El Nido Study. Tropical CoatalArea Management 5-7.
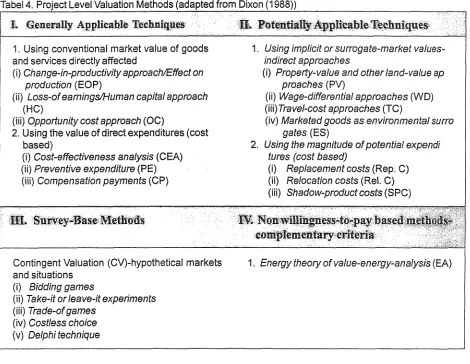
Tabel 4. Proiect Level Valuation Methods (adapted from Dixon (1 988))
1. Using conventional market value of goods and services directly affected
( i ) Change-in-productivity approacEflect on production (EOP)
( i i ) Loss-of eamingWuman capital approach (HC)
(iii) Opportunify cost approach (OC)
2. Using the value of direct expenditures (cost based)
(i) Cost-effectiveness analysis (CEA)
( i i ) Preventive expenditure (PE)
(iii) Compensation payments (CP)
1. Using implicit or surrogate-market values- indirecf approaches
(i) Property-value and other land-value ap proaches (PV)
(ii) Wags-differential approaches (WD) (iii) Travel-cost approaches (TC)
(iv) Marketed goods as environmental surro gates (ES)
2. Using the magnitude of potential expendi tures (cost based)
(ij Replacement costs (Rep. C ) ( i i ) Relocation costs (Rel. C) (iii) Shadow-product costs (SPC)
Contingent Valuation (CY-hypothetical markets 1. Energy theory of value-energy-analysis (€A)
and situations
(i) Bidding games
( i i ) Take-if or leave-it experiments
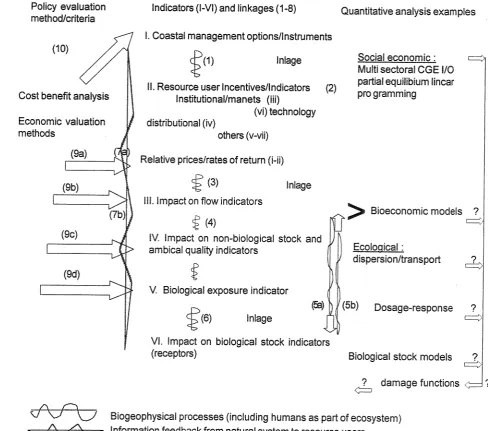
[image:11.601.76.546.282.646.2]Tabel 5. Integrated quantitative analysis and information flows
Policy evaluation methwriteda
ECONOMIC and ECOLOGICAL SYSTEMS interaction
lndicato~s (I-VI) and linkages (1-8)
Cost benefit analysis
Economic valuation methods
fl
1. Coastal management options/lnstrumentsQuantitative analysis examples
lnlage Social economic :
Multi sectoral CGE IlO padial equilibium linear I!. Resource user lncentivedndicators (2) programming
Institutional/manets (iii)
1 (vi) technology
distributional (iv)
others (v-vii)
Relative pnceslrates of return (i-iij
i l l . lmpact on flow indicators
$
(4)>
Bioe~~nomic models ?
i--.
I
IV. lmpact on non-biological stock and
ambical quality indicators Ecoloaical :
3 dispersionltranspolt
$
V. Biological exposure indicator
I
(5b) Dosage-response ?
lnlage 0
VI, lmpact on biological stock indicators
(receptors) Biological stock models 7
d
damage fundions 7~
Biogeophysicai processes (including humans as part of ecosystem) Information feedback from natural system to resource users
information flow from system indicators to quantitative analyses/models
[image:12.595.53.542.132.563.2]Prosiding Pelatihan untuk Pelatih, Pewlolaan Wlayah Pesisir Terpadu
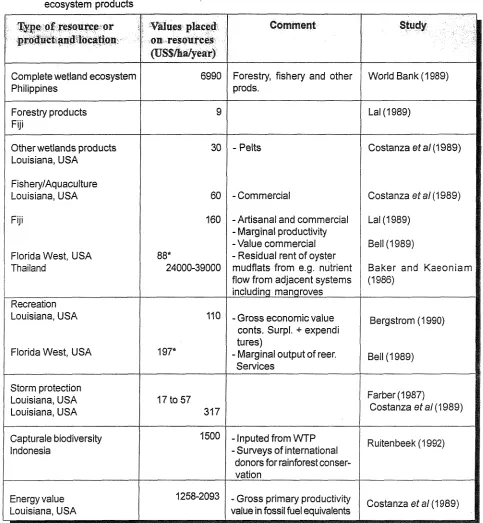
Table 6. Recent examples of economic values placed on tropical / sub-tropical wetland systems and wetland ecosystem products
Q p e OF ressurcebor Vdues placed Comment Study
proGucti.md40cagon. on resources
Complete wetland ecosystem Philippines
Forestry fishery and other
I
Wodd Bank (1 989)prods.
Forestry products Fiji
Other wetlands products Louisiana, USA
FisheryIAquaculture Louisiana, USA
Fiji
Florida West, USA Thailand
Recreation Louisiana, USA
Florida West. USA
30
-
Pelts-
Commercial-
Artisanal and comrnercial-
Marginal productivity -Value commercial-
Residual rent of oyster mudflats from e.g. nutrient flow from adjacent systems including mangroves-
Gross economic value conts. Surpl. + expendi tu res)-
Marginal output of reer. SewicesCostanza ef al(1989)
Costanza e f a1 (1 989)
Baker and Kaeonian (1 9%)
Bergstrom (1 990)
Storm protection Louisiana, USA Louisiana, USA
Farber (1 987)
Costanza et a1 (1 989)
Capturale biodiversity Indonesia
7500
-
lnputed from VVTPRuitenbeek (1 992)
-Surveys of international donors for rainforest conser- vation
Energy value Louisiana, USA
-
Gross primary productivityvalue in fossil fuel equivalents Costanza et a1 (1 989)
[image:13.603.74.557.80.603.2]GIS and
the
Value
of Everything
scar Wilde w o t e that a cynic is " a man who knows the price of
value of nothing. "S
scientists, econormists
and
even geographers have attempted to put a price tag on the planet's ecosys- tem goods md sewices (Co(1 997) notes, these ac
selves. They realize
that
the true value ofecologieal life-supprt systems is, in oply put, h m a n i v wou1dnY
However, the scientists also believe that it's tive to list the replaceme
system services
that
areporting E d ' s flora and fauna. How did they at- tempt such a Herculean effort ?
PuQthg a Price ora Natural Systems
ghow these scientists went about their work provides GIS professionals a methsdoloa for pricing the natural systems that might be damaged by building a Gghway through a national park, for exarnp1e. This wodd
be
vital informationin any cost- benefit analysis.The scientists first step involved determining which of the main ecosystem goods and services they would evaluate (Daily, 1997). Tiley identified 17 major categories including gas, climate and wa- ter regulation; disturbance regulation (e.g., amelio- rating the effects of floods and other extreme envi- romental events); water supply; erosion control
and
s e h e n t retention; soil formation; nutrient cycling; waste treatment; p b t i o n ; bioIo@cal contpols (e.g., prey/predator dynamics); habitat rehgia for tran- sientand
other populations; food and raw material production; genetic resources; recreation resources; and cultural resources (the aesthetic, artistic, edu- cational, spiritual and scientsc value of ecosystems). Sixteen primary biomes or ecosystem types were identified. These werethen
split into marine and terrestrial ecosystems. In tum, the marine sys- tems were divided into open ocean and four coastal categories: estuaries, sea grasdalgae beds, coral reefs and continental shelf areas. The terrestrial sys- tems consisted of two forest systems tropical and temperateboreal) grass or rangelands, two types of wetlands (tidal marsh/mangroves and swamps1), lakeslrivers, desert, tundra, icelrock,
Relvina on extensive previous research,
figme was expressed in U.S. dollars per hectare per year. The only task that remained was to multiply the value per hectare by the nurnber of hectares. The dataset table in spreadsheet format and copi- ous me tho dolor;^ notes may be downIoaded from Nature i o u a l ' s World Wide Web site at http:11' m~t:mture.com (users must register to .gain access to the site).
Pad Sutton, one of the article's co-authors an a geogapher &om the National Center for Geo- graphic infomation
and
sis at the universiw of C a o m i a at Smta Barbara, ~ o m e d me he used a GIS to produce the article's world map of ecosys- tem services. GIS also might be used to deternine the area of each biome, although it wasn't used in this study.Sutton told me even more accurate estimates might be made if NASA's land cover dataset were used. This dataset is being developed as part of
the
International Geosphere Biosphere Program. It appears that future ecosystem valuations will rely more on GIs datasets and analysis.
Why Did They Do Ht ?
The authors note that this type of exercise, although fraught with difficulties, helps to establish upper and lower limits on ecosystem's value. These limits were detemined to be US$54 trillion and US$16 trillion per annun, respectively. In adcSition, the exercise assesses the relative magnitude of eco- system services, which
-
if a middle range estimate of US$33 trillion is used-
are about 1.8 times the current global Gross National Product. The research establishes a framework for fbture studies of this kind, just as Costanza and his colleagues built onthe
work of Daily (1 997) and Pearce (1 993), among others. Finally, the study shows where more work is needed and is provocative enough to stimulateer research and debate.
Pelatihan untuk Pelatih, Pengelolaen WiIayah Pesisir Terpadu
tundra
and
iee/rock biomes. Such huge areas as the htaretic presurrmably are yet to be included inthe
analysis. Perhaps ongoing research conducted at the Uiversity of Calgary will pmGdebetter
mod- els of htaretica's role in proG&g v d o w ecosgrs- tern services (Giovinetto, 1990). In addi~on,s believe
that
more eeo- nsideredand
tIrat
more realistic representahon of emsystem d y n ~ c s an$s
vvlll
help to increase the x c m yA
Bargah at Any P ~ e eEcologists and economists now pay more attention to the worth of ecosystem services. They realize, to quote Wide again, that "no man is rich enou@ to buy back his past". Once destroye4 the services that ecosystems provided may become priceless.
REFENNGES
, R., et al. 1997. The Value of the World's Eco- system Services and natural Capital. Nature, VoI. 387 :
253
-
260.Daily, G., ed. 1997. Naturek Services : Societal Depen- dence on Natural Ecosystems. Island Press, Wash- ington, D.C.
Giovinetto, M.B., et al. 1990. Dependence of Antarctic Surface Mass Balance on Temperature, Elevation and
Distance to Open Ocean. Journal of Geophysical re-
search anddhospheres, Vol. 95 (D4) : 3,517- 3,53 1.
Pearce, D. W. 1993. Economic Values and the Natural World. B43T Press, Cambridge, Mass.
Pimm, S.L. 1997. The Value ofEve
Valuasi ekonorni surnberdaya. .. .. . . (1
-
34)Notes
to
Tab
m many key h'unc6ons,
h m
regula~ng the biosphere to the prmessing of clernents into countIess configurations of food webs, sdirnents, and watercolumn
forms.
We
havefocused
here
ona
subset of important functions to which we felt some value could or should be assigned.These
include the development of food webs teading to h m ~ a b l e food and haw materials, n u h a t cybng,and
b e role the weain playsin
regula~nggas exchanges ~ t h the atmosphere. Where possible, we ~ e d to pmGde
a
range of value eshates, recognikg that diEcnnt sets of assumptions can result in wide divergencein tbe
assignhg of value.For
food
and raw mate~als production, market values were determind fimthe
best
avaaabk
haes,For
biogwhedeal flues, weattempted to computc rcplacment values
if
thc naturalwere
no longer able to supply the particula service. Finally, we used estimates of real egate price di onic pnicing)as
a surrogate for rhe service that m a ~ n e ecosystems perFomin
chancing the cultural fabic of society.Some important values are m r e difficult to q m ~ f y than even the difficuIt evaluations
we
did cany out, 2nd far this reason were left out of the cunent an;iIysis.This
iaduda fiegszsmennt
of value of bidiversigy as such and the services of higher trophic tevclsas
controllersand
amplifiers of tcosystcrn processes. Many of these services simply have no convenient economic analog (cg., what is the repiacemcnt value of a species, ora
spceiesassemblage? surely it depcnds on the species and the lage). While achowledging hat these services L K ~ : probably important, we IeR them out for now.
Open
Oceans
1. Gas Rceulation
Occans play a critical rote in the balance of global gas regulation. Oygen
md
mbQn cyctes are inthatelyE ~ e d ,
as are N,
P,
and S cycles. We focused on the roleof
the meaas as (1) a sink for 602, since fersof
@02 $0 theatmosphere result in increases in greenhouse warning, and (2) a producer of methane,
a
secondw geenhouse gas.A. Two estimates of
CO?
-
abso~tion bv the worid's weans:I ) Schlesingcr (1991) esiimatcd oct norage of organic C in marine sdimeots at ea.
0.1
x 10IS gC
y-l,
which=
0.366 x g C02 pl
2) Butcher ct ai. (1992) discuss a simple model of Lhe global carbon cycle, in whicln the
mt
input ofG
to theoceans from the atmosphere is 1
x
1016 mol which = 44 x 10j6 g C 0 2 -j-l.Obviously thcrc is a largc discrepancy betwec~ tllcsc estimates. On page 309 of Schlcsingcr, net inputs o l e to the oceans is 2.4 x l0l5 g C y-l. and the amosphuic pool is 720 x 1015 g
C.
Thus. if the occan wereto
cease absorbing the net mount of C, itwould
take 300 yr to double theC pool
in
rhc ahospberc, which would leadto
an increase of 3 'C. Fankhauar and Pearce (1994) estimatedthe
economic cost of C02 as 120.4 perMT
carbon. Using the most and least consemalive estimates of net removal of 602 as C in marine sedlmesnts, we aAve at: a) 0.1 nc
y-l = 100x
106MT
y-l 132200 x 106 ha=
0.003 MTc
h r ly-f
0.003 MT C ha- l y-1 x 120.4 MT-I
=
$0.6 1 ha-l ymlb) I x
1016
molc
y-l=
12x
~ O ~ ~ M T C ~ - ~ 132200 x 106 ha= 3.73M T C ~ T ]
pl
3.73
MT
C ha-l y-l x 520.4 MT-I=
$76 ham1 y-11 1
The average of this low and high estimate is $38.3 &a'
y"
B. Methanoeenesis bv the world's oceans
Sehlcsinger (1991) estimated:
10
x 1012g
CH4
y-1=
7.5x
1012 g
C
y-I
.
Fsnkhauser andPearce
(L994)
also estimated the price ofCHq
as a greenhouse gas nsI1
10
perMT
CHq.
This
yields:10
xMT
CHq y.1
x$1
108.
N u t ~ e n t
cvelins.
Oce2ns arc cridal in nainaining global nutrient cycles, Here wc fmus only on nitrogcn @) and gRosphomus
(PI,
the major "macronu~ents". While we roco@ze that other macroou~ent cycles (eg. sulphur,a host of micronutrimts are also important, we have ignored &ern in Ihe c u m t study, irn
cstimarc. The valuc of thc weans for gtobrrl N and
P
cycling d & v s from their role as N aadP
sinks, lf the weans were not therc, we would bave to reereate this &action by rernoGngN
sndP
&m land rum@ and recycling it back to the land. We tod: two appraacbes to evaluating this hnclion.W cd ~t thc weans and coastat watc aB1 the woddk swa=tthat Row from
rivers, and rcceihs h n e watm proGdc a
.
If we a s m e that roughIy onethirdof this sehvice is provided by e s t d e s Wixon 1896 in press) inder by coastal and open mean,
12 3 1
(assume I 0 by shelf and
IO
by ocean), then the total quantity of water treat& is 40 x 10 m y".
Replament costs to rmoveM
andP
were esthatsd at $0.15-
0.42 m3 W c M 1991 as quoted in Postel andthe replacement cost for each biornek (ID) con~budoa to the total vdue is $2.0 x 10¹²
-
the value for ocean (32200 x 106 ba) is theo SQZI
-
174 ~ c I yolaI I. Biolokcal antrot
See data (Note 13, Mow) on & s t h t e s of fish production. We assutned b i t the contro1 h c t i o n of uppcr gop&c levels is at least 30% of the value of the satch (tvm thou& ahe prsdudon fn those WpMc ltvels is 3-5 h e s the catch) (Source: R. D'Arge* pemnal comunicmtioa), yielding an e s t h t e of $5 hae1
r1
1
3.
Food ~roduction
The following table summarizes data on globat fish production, catch and psoten~al catch for
troth
upwelling and open wean areas.Ecosystem lBrca Pr,Prod Fish Prod. Fish &tch Potcntiai Catch (108 ha)
05
c
me2 y-I) m a y-l) m-2 y-1) (g a$ y-l)@T
ha-1(1 988-89)
Upwdling 5 22'5 23 2 3.54" 4.97 0.8497
Oceanic 332 57 2.46' 0156 0.59 0.0059
Source: Houde and Rutherford 1993 (except fa fwtnotes).
These numbers are probably as good as we can get, and are probably gwithin a factor of 5. Average 1993 price, calcula;ed &om imporls and exports of total m&ne fish catches @y continent) is $2.28 (* $1.18 s.d.1 (FAOSTAS Database Calleftions (on W W ) . The value of fish cafdrw. in S ha-lyl, is assumed to be the average price h c s the quantiv (see main text for a discussion of this aswption). Thus for the total potmial catches in
these biomes, the valuc is:
-
1.Also not given by Houdc and Rutherford. I used the catch values providcd in Table 1 in Pauly and Christensen for total catch in 1988 and divided that by the shelf area given in Houde and Rutherford (which is 6 times the area of shelf determined by Pauly and Christensen, 1995).2
. .This number is likely to be a gross underestimate of ocean fish production, since it assumes production 2.5 trophic Ievets beyond primary producers. Most of the open ocean fish biomass is not comercitffly harvested and is composed of secondary consumers (c.g., myctophiids). If one follows the calculations of Woudc and Ruacrford
(19931, substituting trophic level 2 in place of trophic levcl2.5, the resulting annual occan fish production is 4.66
I
. .. -
---
-
kosysiern Am Potential Grrtch Value (ErlT x $22801MT)
(I
oB
ha) rnm2 y-lMT
yl
I
ba-I
y-l
Upwlling 5
4.97
0.0497 513
Ocanic 332 0.59 0,0058
.L%i
h a weight& average ( u p d l + open) SB5
9
4.
Raw
materials
Gnsidening only one product, i.e. the fornation of limestone In shallow ocean basins (and then "spreading" it out ovcr the entire ocean Floor):
Estimate #I. Source: Holland 1978: 0.5 rng crnm2 y f l = 5 g me2 yf']
(from
8 sbdy by Broecker and Takabashi 1966 on Bahma Grand Ba&)Estimate #2. Source: Sehlminger 1991. 1.5 x 10
IS
g y-1 (taken from Wolla 1981 .) dividrd by the area ofocean
=12 2
332 x 10 m = 4.52 m-2
y-I
.
These h a t e s are roughly equivalent to 0.05 MT h-I The m d e t price of limestone (f.o.b., determid by telephone intmiews with quarry managen) is spproxhately 610 If m a e W 84% of the price covers capital and labor costs, &en the ecosystem "valuc add&" mom! is woah $1.50 wI* The @that& value of
oceans
for
limestone prodvctioo is: 0.05 MT hav1 y-l x $1 -60 MTI = $0.08 hn-Ir1
.
17.
Cultural Values
A s reflected
in
literature, song, dueation, and other ways, h place trmendous value on ,nodines andoceans. One bngibfe economic manifestation of the cuItural value placed on these ecosystem is he willingness to pay for real. cstate in pmxkiQ to m a p i e s and ocm, cornpard to the price of comparably
sized
inlmd real estate (all other things being quai), Price digcrentials between inland and watwfront propertis in a rich md a poor partof the United States were cdleetd. We Ihen wsumed that this differential wwId be valid for the world"s wealthy nations (develop&) and would be 100 t h c s lower in thc remaiader of the world"s nations.
California: $0.5 x / 0.046 ba = S I0.8 x 106 ha"l Alabama: $0.1 x 10⁶ 10.186 ha = 50.54 x 1 ha-I
Coastline: ""Developed"". 194$35 km
"Undeveloped": 284,795 km
Assume that the value extends
from
the shorelirae and back 0.5km
from shore. Then the area of real estate is Devdoped 9.7 x lo6ha
Undevel. 14.2 x lo6 ha
.
Using the spread in real estate price differentials above, and assuming prices are 100 times less on undeveloped lands, we obtain
Develop& values (total): $5.24 to $105
x
1012Total vatuc: $5.32 ao 105.2 x 10¹²
Prosiding Pelanban untuk Felatih, Pengelo/aan Witayah<, Pesisif Terpadu
Estu e and mitsbla cnhment conditions for m y owl activities rad &a rnaintmce of the natural qualitis of the m Is rr W m d ~ a ~Wdvettess ~ O C W of
thGSG
1
n,b.
This &W not given incrtcbw
(fix
1988) tist& undw andcotrl syrtems, lardchid fVafuasi ekonomi sumbenfaya ... ( 9
-
34)rccrcational activities. The most common actiitia m: boating, G n d ~ f i n g , sflshin&
hunting and shore-beach rmreation. dc
Omol(1992)
s t h a t e d tbc to&l valueof
thae
activiticr st $195-
$567 ha-B
1y--l, w l an average
of
5381 ha- y'17.
Cultural
Many estuarioe areas are important sour- of histo~e information as well
as
sien6fiic and&de
Wies. de G m i 1 I(1992) crtimated the total value ofthesc activities at $25
-
$34 ba-I f'l9with
an avaagc of a9 ha- y-SeagrasslAlgae
Beds
8. Nutrient cycling
For calculation methods, see notes for Ocean &m = 200 x lo6 ha, value= S10,MIO
-
28,000 ha-Iyl*
1
1.
Biological
Control
Not
estimated, but probably considerable value.12.
WabitatlRefuyia
Not estimated, but probably considerable value.
13.
Food Production
Not estimated, but probably considerable value.
f
4.
Raw
maten'als
Norse (1993) states that scawads, agar. and earagecnans
an
wonh
5400M
y-l Dividingthis
byana
ofscagmsfalgae bcds (see note 8 above), we obtain f 2 ha-I y-l
.
Coral
reefs
General
Coral reefs are highIy productive, diverse and attractive ecosys(ems producing
a
wide rmge of valuable g& and services. From the studies that were found, the services of dimrbance renulationand
re~reatbn were particulaiywell quantified. Food pmduetion eonstikes another impomnt and beoefit
from
ooml iafs. ~h;diversity of the additional values is only an indication that there are many
goods
mind scwices still unqllilntified,such as medicins and research and education,
Continental Shelves
1
B
See notes for Ocean far assumptions. Area = 2660 x ha. Value= $752
-
2,110 ha-y
1.1.
Biological Control
See data Wote 13, below) on estimates of fish production, and notes for Ocean for assumptions.
Prosiding Pelatihan untuk Pelatih, Pengebiaan Mqlayah Pesisir Terpadu
1
3.
Food ~roduetion
Scc notcs for Ocmn for mefhOds and further details
Et'osystm Area Pr.Prd Fish
Prod.
Fishealch
Potential Catch2 1
0 0 8 ha) (g
c
rn-* y-i) (g m-2 y-1) (em-
yo ) (g m'2 y-1)(MT
ha-1yl)
(1 988-89)
Shelves 23 162 15.5 0.174 2.98 0.0288
Source: Noudc and Rutherford 1993.
Ecosyslcrn Area Pdential Qtch Value x $2280Ma>
(1
o8
ha) g m-2 y"lMT
ha-1
y-ls
ha-I y-lShelves 23 2.98 0.0298 S 68
Terrestrial
Systems
Terremial systems provibe a large number of senicer, but valuation studies have examined these &cer unevsdy. Little economic infomtion was available for the valuatbn of soil formarion, waste treatnnenl, gas regulation, biological control, pollination, or refugia, thougin :it is clear that lEtw systems c o n ~ b u t e signifimtly to these processes as well. Much of these contibutions that we lack infmation for, however, are included in lager scale studies and are included in the taily for total, global ecosystem s e ~ c e s .
General
Forests have obvious direct use values, as a source of many hasvatable products, rangng from timber to
food and drug prducts. Tbey have a more indirect value by providing a v ~ e t y of ecosystem
*a*;,. ,.,,?a
:..
A ,..... *-*:-- -,.:-r-qt :--*-a---
--.-a*-auru IVL\, I I I V U C L ( I L A U ~ I Q L U ~ Q U ~ l l ~ p a ~ Q U ~ watw bbmflstfofq they edanee geophysicahtabiiity, rediucing erosion
of soils. Excessive erosion would not only interfere k t h aquatic prwesses but w u l d reduce soil fertility itself and impede normal n u ~ e n t and hydrologic cycling. They provide valuable sir p ~ f i c a t i o n h n c ~ o n s , r m o h g lead and other potential toxins from the amosphere. Forests prote~t against pest infestations and help assure quality water supplies, Trees art h p o m t in water storage processes stodng water themselves, plafing a critical role in
evapotpansphtion, and providing pathways for water retention in subsurface reservoirs. The result is a more reliable a d constant flow of water downstrm, reductions
in
peak f l d i n g events and a larger average stock of available water supplies. They provide hpoflmt climate r~gulation services fiom Iocal to global scales, These services are a result of transpiration processes, albedo and roughness effects, sad cabon cycling. Local rainfall can be reduced as a result of deforestation, since water storage and evapotranspiration are dhinjshed, Forests serve toprotect against storm damages, acting as .Kindbreaks and creating roughness effects in diminishing storm intensities, Global warning potential from deficiencies in carbon sequestration capacig is well known, Forests provide option values associated with support of species and genetic diversity, They also have broader cultural values through their importance in folklore and broad cultural support.
Valuation of services of forests must take the types of service flows, such as timber and clim& regulation, and assign monetary values to them. These monetary values can be of two basic types: benefits received or costs avoided by provided equivalent services in another manner. For example, the benefits received margiaa'l value
of
timber would equal stumpage values; i.e,, market prices of timber net of harvest costs. The costs avoided marginal value of timber would be cost savings from using timber rather than other structunl materiais. .In well hnctioning
markets, these two valuations would be approximately similar at the margin. Climate regulation values, for which Hy
Valuasi ekonomi sumberdaya ... . (7 - 34)
prices or darnage wsts avoidcd, such as health costs. AlternaGveliy, costs avoided valuation wtxrld include the cost
saving from not having to control carban dioxide mi&ons in In well
fuoaioning
mlelipolicy maws, thcsc two valuatioos would
k
appmxhatcIys
likely than the rnrnpfions for well functionirog mwkets
for
m cn is cmidwbIe d e b g a ~whether
the benefits of climate conmi e x e d the costs of conml.As with other ccosystcm the scrviccs and vaba
Branl nuts are barvested in Brazili forests but oot in
Ma&
i m p a n t function in Mexico but not equally so in at! forest& Iocalions. Furthermore, valmtion may diRer significantly, depending upon supply and d m m d conditions and incomes. Spatial g valuation results is inherently problematic (Pearce and Moran, 1994).
Servl;ccs of ecosptems are flows s t e m k g fm the nanKal capital stock. Iherefm, inhcrent "sustainability'hrnotation. Keeping with this hpiicaGon,
wets
of wsy*m c"sustainable basis. Forests have value for their sustainable flow of h b c s raw mtedal, food prsducts,
squdntion, erosion contml, ctc. It is highly debatable whether existing flows dmcts, p
sustainable. We have atrempted lo use estimates of susbinable d c c s flows in estimating below.
2.
Climate Repulatio~
Estimates for the c t h t e rmlation value of forests wcrc based targely on avenge damage a v o i w cast studies (e.g., Lsmpietti and Dixon 1995) or avoided Gosts of alternative cootrols (e.g., -illa f 391). Thcst studies typically cstimatc the cubon -sage capacity t b t
would
bc
lost under various forms of forest d ~ a d a t i o n , relate that to fume damagcs or eumnt casts avoid&.SO.
forest cmvcfsion to otha land u q such as a g r i c u f ~or psture, rcleascs a flux of c a h n during eonvcrsioa and reduces glob1 carbon storage capasib.
For
Adgcr, et aP. (2995) estimated the avoided climate related damages from fosxls of l o w s in Mesco ahectare ger year. Indexing to $1996 resuIts in an csthted damage cost savings of 570 p a hectare pa year. h t i l l a (1991) estimated the costs of alternative controls from fort% loss at SC42N per hectare, h p w g an annualit& value of $336 (usiog 8%) whcn indcxcd up to $1996. A su of studies of trogical forests suggest
hi@ and low vafucs of $482 and $88 per hedare per year, respectively,
with
an avcmge of $223 pw hycar.
Tficsc are partial va!uations in scvcral ways. M i l e carbn scqucstration in forcsts would be proportiionate to forest biomrtss, increasing loss of forests may alter otha msystems so dramatically as to change their fundon in thc carbon cycle. For example, forest loss may alter temperature reglrnes and mean t e m p t m , change
tfic
carbon cycling value of oceans. Secondly, damagcs from reductions in carbon
scquesmtion
capacity may be higfily non-linear, perhaps with damages increases more than proportional to forest loss. Finally, even if damages were proportional to forest loss, the value of those damages may not be propoltiooal. For ple, global temperature may be liacarly reiatd to forest loss, and crop yields linearly rclatd to temperature. However, the economic mfue of crop toss may be more than proportional to that crop loss. In other words, there may be g d reasons to expect that the marginal valuc of forests for climate control may increase ~ 4 t h forest loss. If so, the marginal valuation methods used here may dramatically underestimte the economic value of total forest climate controI services.3.
Disturbance Reyulation
Disturbance regula~on services were based on a damage-avoid& cost study of Cmeroon tropical forests
(Lampietti and Dixon 1995).
4.
Water Renulation
Water regulation value estimates were based on damage costs incmcd when deforestation leads to reduction in water qualify or fisheries prduction (Adger eta/, 1995, mum^ 1995, Kramer eta/, 19921, or on damages avoided by forest preservation.
Only one study was uscd for esthates of water supply m i c e (Kumari 1995) based on market values of water lost to reduced quality created by .deforestation.
6. Erosion
Control
Erosion control services of forests refer to soil retention functions. Forest loss would result
in
increased siltation of streams and dms. Degradation in strmm quality would impede fishing and recreational activities, whileinstalling scdimcnt mpping Jcviccs. Both valuation m&&s have bccln
ustd.
For cxamplc, Cbmitz and Kumd(1995) estimated the avoided costs of altcmatiitive conMs to be worth
$54
pet hcclarc ia Ecuadorian q i c a t Adgcr eta/ (1995) estimate damages avoid& to be w d only $0.04 pcrh
~
perc
year, white Dkoaan
Wodgson (1992) cstimted d n e effects of w f f o a fishing and toudsnr hmcts, These valuations were indexed to global incomes pcr capia using the Purchasirig Powch of GNPpw
QpikHi&
and lowv a l ~
were$&I
and SO per beetarc p r year for tropical forests, respectively, wftb an average value of $1 85 per hcctiu;~ pet year,13.
Fmd
Production
Fortse production of f d producls was cstimtcd as an average for the production of bits, nuts, game, and swidden aMculture from several trogical forests of Asi d South Amcn'ca (eg, b p i
1995, Kunrari 1995, Pinedcz-Vasquez eta!, 19923. These a t 4 gross incomw in %me
incomes, the conect measure, in other cases. In wme ea les were asked
their
willithese services &ietti and Dixon, 1935). These arc h e f i t s type m a w , and & riot reflect the costs of %king alternative fd sources in the absence of forests. Tbtst valua wcre scald to global i n c a t s using the Purchasing Power adjument. Food p d u c t s il1usb;ate the valuation prcbluns. For market baed cuItures, net
incomes reasonably reflect the value of food products. Nowevever, 'for mbsistence cultur-es, f& prcrducts m y
have an infinite consumer surplus, since burnan existence is the h e f i t . atiltcnra~ve costs of f d supplies could be used to estimate valucs in these eascs, but nooe of wee &Milable, Furthmoac, produets an
unique to ~6osystcms. Even if there is a gencrdfy ct, such as Brau'l nuts, abated to be worth
nea~ty $1100 per hectare (Mori, 19921, one cannd gcnmlizc &is value &om tbe B r a i a n foresis. For 1%
while the hmesting of wiId fruit and latex h Ptnzvian Anromok is
ed
to be wo& o v a 516000 per h-e (Peters eta/, 1%9), this is not very gmemlizable. These ham& ualm must dGduct kmat costs to obhin netforest contribution.
14.
Raw Maten'als
The valuation of forest raw materials indudes values of atrattables, inelding timber and Don timber
forcst prohtucts. The goal was lo estimate these mateGI flows on a sust;linable yield basis, since &at would represcat the service flows from ecosystem capital. fQowever* there was no agmpt made to determine whether current flows of materials are sustainable. They arc most l%eIy non sustainable, implying that cunent flow valuations inflate sustained yield valuations. W i l e the propcr measwe of value
k
net of h m & cost, the vduesof extmctables somethcs were estimatd net of hahvesl costs and in other caws were not. Timber values were estimated from global value of production, adjusted for average harvest costs. Avcragc harvest costs were s m e d to be 20% of revenues ( S b m a , 1992). This value was used for all forests, btb temperate and tropicd.
.j
5,
Genetic Resources
Genetic resource vatue includes the present and future value of fauna and flora far medicinal p u p s e s , Present values would reflect the "'in situ" value of currently uscd drugs, net of processing and development costs. Future values would be a form of option value. For example, the pharmaceutical fm Mack has paid Cost am's
National Institute of Biodiversity $1 milfion for rights to develop future plant species. In principle, this value would reflect the minimum cxpccted net pr~fits Merck would anticipate fom future devclopmeot, The net social value may be considerably larger, reflecting the social value of cures for dim% which is liltely to be much greater &an
Merck's profits. Most of the studies s t h a t e d the market value of phamceuticals dcrlvd from h p i d foresb. The correct measure of value is market value net of costs of bringing tbt
aaw
materials to fhek markebbfe, mcdicinaf fom. Unfortunately, the cost adjustments could not be made. W e n drug sales in the US werethe
basis6br
an estimate, the US valuc was cxtrapotalcd globally by assuming that citizens of dcvelopcd countries in E q c , Australia, Ncw Zcaland, and Japan would purchase the m e value of drugs per capita. This acknowledges an inconic effcct in the demand for drugs, and a wcakncss of economic mluation. f e r m s of low income may placehigh valucs on life saving and enhancing drugs, but these valucs would not be reflected in the mrket place. For this reason, the genetic valuation may severely underrepresent the social value of genetic services.
f
6.
Recreation
Recreation vaiue estimates were based ola various methods in differcot country settings, including brave1 cost mcthds (Lampietli and Dixon, 1995) and contingent valuation methods (Kramer et a1. ,1992 and S h m a
,
1992). Thcsc arc proper methods of measurement for this value. Genemlizability is an obvious problem for recreation values, depending both on the quality of the forests and proximity to demanding populations. The c m n t recreation value of many forcsts may be ncar zero. Estimated generalized forest values may reflect potential value,Valuasi ekonomi sumbenlaya ... ( I - 34)
17.
Cuitural
Values for cultural services were bas& on shrdics of aggregate willingnesscs to pay, phmarily for cxis~ence values of ecosys!tc-ms or endangered species in the US (c.g., Pope and Jones 1990). These values
are
very likely lo depend upon income levels of the culture in question. So they have been adjusted to w o r l d ~ d e vatu= using the Purchasing Power of GNP per Gpita.General
We calculated the net rent for grassland and h b l a n d worldwide at 151.04 ha-' yf'. This value is a
weighted average of the net rent of those USA states for which the "potential" vegetaGon was ~ I a n d or shrubland (Kuchler, 1964)
(KS,
IA,klT,
ND,
NV,
UT, AR,NM,
TX,
OK,NE, SD,
MOP U, M,CO).
Data were obbinedfrom the Census of Agriculture 1992
WS
Dept, of Commerce, 1 995).1.
Gas
reeulation
We made indewndent estimates of this service for carbon dioxide, nitrous oxide, and methane.
a. n dioxide: We used estimates of C losses ated with a@cuItural use h m grassland mils
across the Great Plains of USA from Burke eta( (1989).
C
losses ranged horn 0.8 to 2 kg me2.
We uwd a value of I kg rn-2 in our calculations. We multiplied this numbcr by the cost of C02 uninions: 10.02 (FaPeaice 1994). The total cost of releasing this
C
was 6200 ha-I.
l o calculated an annual value, we asswned that this amount was r e l e a d during a 50 years period,We
used a discout rate of 5%.b. Nirrous oxide: Mosier eta/ (2991) showed that cdevdon of grasslands increast siMficanfly the emissions of nitrous oxide (a greenhouse gas) in the shortpss steppe of noriheastem &lorado. We estinratd xithe annual costs of nitrous oxide emissions based upon the difference in emissions betwen grasslands and adJ'acent what fields (0.191 kgN ha'l yfl) and the cost per unit of nitrogen emihed as nifrous oxide: $2.94 kg (Fankhauser and Pearce 1994)
c. Methane: Cultivation reduces by half the uptake of methane by grassland soils (Mosier et al. 1991). To calculate the cost of methane emissions we used the same approach as for nitrous oxide: we multiply the d i k e a c e in methane uptake between grasslands and adjacent wheaf fields (0.474 kg C ha-I y i l ) times the cost per unit of mthane ($0.1 i kg CH~-I).
2.
Climate regulation
By using a mesoscale climate model ( Pielke et al, 1992; 1996 ) , apeland 6td. (subfitted1
estimated that landuse change have caused an increase of 0.16 OC in the North h e r i c a n Great Plains as a consequence of the reduction of green cover and transpiration during part of the year, Nordhaus (1994) e s t h a t d that an increase of 3 OC in global telnperatrnre will produce a decrease in the global econodc output of 4%. Assuming a proportional effect of temperature, the impact of 0.16 OC would be 0.2% of the net economic output
1 1
(net rent): $0.1 1 ha' yr-
.
4. Water
regulation
We use data on runoff for grassland and cropland watershed for the southern plains of USA (Jones 5 a \ . 1985). WE assumed that the difference in runoff between cropland and rangeland watershed is an measure
$&k
water regulation service provided by grasslands. For this p&icular site (BushIand,Texas, average precipitation 462
Prosiding Pelatihan ontuk Pelatih, Pengelolaan Wilayah Pesisir Terpadu
regulation is $2.54 ha-l y i l . This alcullion considm only the on-sits value of wain regulation by g ~ 1 a n . d
ecosystems.
6,
Erosion control
\Ye valued soil losses based on Ihe rduetion of a~cultural yiel&. We ed that l m i n g the fust 10
cm
of the soil will result in a reduction of agieuIturaI yields of 50%. A rcduction of yields of 50% will reduce the net 1
rent of grasslands, at least, proportionatly. B a d on an average net rent for gassland worldwide of
.
$51.04 ha"e
(sce general assumptions above) thc costs of soil emion control service wili bc S 28,s ha"9r-I. This &mate compare reasonable well to the aggregated value provide by Pimmtel (1995). 5 26.1 ha-' yil, This considers only on-site s e ~ c e s of erosion control.
7.
Soil formation
The e s h a t e was derived From studies on carbon accumulation rates in old-fields b eastern eolorado, US
(Burke etal, 1995, Ihori etaj, 1995). These studies &owed that ~Aer 50 years of abandonmen$
C
stocks have increased 3000 w a . The costs of 602 emissions (calculated b d upon the negative effects ahat i n c r m i ~ g C02has on climate) was $20.4 pcr ton of
C
relcascd (Fankhauscr and Parcc 1994). lghc scrvl'cc provide by grasslands in capturing C was calmlafed as the rate ofC
accumulation(30W
kg.wl
/ 50 yean=
60 kg ba-lyrol) timesthe
cost of C ($0.0204 kgC'
). S 1.2 ha-I y i l.
9.
Waste treatment
Data from Phentel eta\
(1W6).
10.
Pollination
Data
from
Pimentel eta/ ((1996).I
I. Biological control
Data From Phentel eta/ (1996).
13
and
14. Food and
rawmaterial production
We use the average agricultural net rent for central USA (see above) as an ate of the value of f d and raw material production worldwide.
15. Genetic resources
The majority of the centers of origin of domesticated plants and animals are located in grasslmd and shnrbtand areas (McNeely era/, 1995). The estimate of the value of presenting genetie resuces of msdand areas was derived
from
data of the effect that incorporating genetic resistance to disease from wild vGeties havein
wheatproduction. Perrings (1995) value the effect of prodoction of linwrf~,rating genetic resistance to diseases at $50 millions per year.
16. Recreation
We provide 3 independent estimates of the recreation value:
a. Hikinglecotourism: We used data on ecotourism opporlunities for the Fpbos area in South Africa (Gowling eta/,
1996, Higpins eta!, 1996) ($22 visitof dayw1 ,0.01 visitor hi1). To atrapolate worldwide we assumed &at only
1% of the grassland'and shrubland areas are attractive enough for visitors,
b. Big game hunting: Based on data for Wyoming (USA) (Brwkshire, 1982): $250 hunting trip-] aod 800 ha huntcil
.
Valuasi ekonomi sumbedaya .... . . . ( 1 - 34)
General
For
the purpose of &is shKiy, the vdetland biorne was dividtd into fieshwtcr wctlands (sFiparian wellands and
fl
wdlaads (tidalmmha
aind
mangroves).
Estuaries Raveb
m
inclirdcd with the marine-c
son
for includmggdai
m d c s
and magrovcs ia oneca
due the fact that they pcrfm sirnilar fitnctions
in
the
tanperate and mpitaWetlanQs are highly pductive and d p ~ c qgm, perfodng
state. At Ihe same time, these chamcten'sties have Icd m n to converl w&m& to
sin
p s e of the loss of most ofher fitnctions, and the ori cally. Some of these conversions hsve
Id
to considthe dampening effect of ~ v & n e forests and floodplains on peakdischarga of rr'vws (cog. assissippi-flding in 1994 and the f l d s in Europe in 1933 and 1994) '
The estimates includcd in table 2 are badon actual case studits
in
various parts of the world;of
COU~SG both the social and economic value of most hoclioas will vary considetably, depending on them o m i c situation of the country involved. For example, the f d - p d u d o n value of a fldplar'n is valued differently Ln Africa CUSS
-
Barbier et. a!.lW1)
h
in A m ~ a (US$ Whalyear-
Gten 1394) both bccause of digercnce in market-values and in the infoma? (non-market) ec:oomy, Mile in A ~ c a paoplt maydepend on it for a large proportion of their &ity subsistence n d s , In other cotmtris if is ody 8 small *on of the f d - i t m s available
.
An even more extreme example of t h m discrepancies between *devclopchi'" md ""l develop6d"" countria is the value placed on (drinking) water proGdad by fi:&wter-smps. In the
USA
&is funcgon wasvalued at ovcr
US$
15,OWhiLlyc~~ (6upta snd Foster 1975)vsHile the m e knction wers valud at a liale ova 100ihdyear in Malaysia (Kumari 1995). which rnay partly be c a d by diffwences in water quality sbndards, and/or availability of alternatives and market values. We have attempted to compensate forthese
direrenw as tnuch as possible [see general discussion] butsome
discrepancies remain.Wetland-funclr'ons that rut of particular ecological and m n o A e hprtaoce are fiood-eronMI
,
stomprotection, nutrient cycling and waste recycling, accclunting for a h s t 80% of heir economic value. Within m e ecosystem (or biomc) some functions are not evenly distdbuted and we have attempted to coned for these spatial restn'ctions as muchi as possible: e.g. recreational actiGties ~ I I focus on the mst attractive
snd
accessible pEerts ofthe ecosystem SO valus found for the recreational imprianee of fidpliains or maDgroves have not k e n multiplied
for the total surface area but only 30 %.
Within the scope of &is surve)r, it was not possible to make an e&emive analysis off aII the i n f o m ~ o n available on the knctions and values of thcse biomes and also m e wetland functions sre under-exposed or not included in the table yet, aIthough their ecological and economic hportance is considerzlblc, like their influence on
local and even global climate, both through their physical influence on tcrngerature and precipitation, and rhelr influence on gas-exchange with rhe atmosphere, .
A h , except for their imprtancc as lnurscry areas and migration habitat, little lnfomation was found on tire economic impomnee of other biological aspects of the f~nctioning of wetland-ecosystems (e.8. biological control and genetic resources). Thus, the totals given in Tables 2 and 3 should be secn as a very conservative estimate of the total cconomic valuc of weeImd ecosystems.
I .
Gas
Regulation
Only one reference was found for the e c o n o ~ e value of carbon scquestratioa in Malaysia, represen~ng a value of 265 USmaly. This valuc could also be placed under the climate regulation k n c ~ o n (21, since the
economic calculations were based on avoided damage through reduction of the enhancd greenhouse effect.
3. Disturbance re~ulation
Disturbance regulation (3) mainly nlatcd to fld control (by swamps and fldplains) and stom protection (by tidal marshes and mangroves).
Flood control and storm pmtection values are b a d on estimations of prevented damage or the potentid, and in some cases actual, costs of replacing this hnction of the wetland by artificial constructions, Since these data \\lcre not available for all typcs of wetlands, we made a -best professional judgment" to convcrt these figures into a
a. total value for this function for all wetlands. For Rdplains in the
USA,
this service was valuedat
US$1 I , I37hdy phibodeao & Ostro, 1981). For swamps, no data
was
Found, but since they are usually found inpIaces
Prosidng Pelatthan untuk Pelafih, Pengelolaan W&yah Pesisir Terpadu
Stom prdelion values for iidal s n h e s mnge from
US$
Thiefor cstirnatcdi darnage costs IR the USA811, ta USS S67Ttlq in willingness-!*pay
fa
m~dintcnancc ofa
tidalmmh
fot thisand USb7.337lhaly for replacerne~t costs oftbe stmpEotection fuaction of
tidd
in the
UK
mmer, 1989). Tbe avemge was put atUS$
1,839 for&is
h d i min
Table
2, wbichis
cmlue found for the srrbsticution cost of the G m pmtcctioll fundm of mangroves in Maltmysia: USS 1,701
4.
Water Regulation
Only one rcfetence was found on the value of the swamp area ia Maysia for buffefing iPrigaGoa water for i c e paddies; the effect on prdudivity was c s t h a t d to be worth 30
US
Iy hncdon of Ihc swarnps .and Roodplains was at& lo be W OUSf16001haly, ~ king
the average of two very different shdies: cod
sa
area in m y s i awas etstimatcd to represent a value of USS 104h
,
1995) ~b a study in the USA &OW&that
the (additional) costs to obtain water From the next best alternative sure would beUS$
15,0351hdy (Gupta & Foster,1975).
6,
Erosion
Control and 7. Soit
Formation
For erosion control and mil formalion no exp&cit references m fd in tihis bsbrt) s?udy, althwnh
wdands certlinly play an impcflant role hen. ~arg'c. rballow nmdp
pie,
~cs:Gul&
silt (thus trapping soil partictes lost by erosion elscwhert] and are often used for cutevation during part ofthe
ycar. Usually the value of these hndioos is incldcd In economic ealculetions of othw bcticms, ~otabiy diswbance regulation (3) and fdprcwtuction (13).
8.
Nubient eveling and
9.
Waste Treatment
Because of their high prcrductiGty and dynamic nature
Nth
with regard to abide factorsand
food web stnrchucs), wetlands play a vcry impoflaat role in nutrim! cycEng and w e treahnent.They
can absorb and recycle large amounts of nutn'ents and other chemical substances without negative side-eEm& to the ovm1l functioning of the ecosystem. Especially the waste treatment funciioob
a considcrabte economic value which isincreasingly being recognized. alculatioas are mainly based on mst-ssving calcdations and @teatiat) Gosts of replacing this wedand function by means of artificial waste treatment, En only one
case
was a survey conducted to detmiine the wiifingncss-to-pay for thc azaintmnce of tiis ecosystem service, rtie total economic value of &isfunction, even if it is limited to sdaimble use levels, is considaable: dmst USF4,500 for coastal w e b & an8
about
US$
1,700 for ljreshwater wetlands. In the case of 1 wetlands, data was only available for tidal marshes and it was assumed that the con~bution of mangroves to this function, on a suStainabIe basis, is about 30%.10.
Pollination and
I
1.
Biological Control
Pollination and biological conkol are two functions for wbich wetlands arc less importan% at least. no
references were found on thesefunc6cxls
in
relation to wetlands, although there are indiations that cultivated areas adjacent to (natura!) wetlands do benefit fiom t6e pest conb.oI and pollinztion func~oa of certain wetland species.12.
HabitatRefuga
The habitatlrefugia function of wetlands is important, both with regard to their value as nursery BTW for
mmerciafly hportant species (fish and crustaceans) and as resthg and f d i n g areas for many migrabry (aod
sedentary) species. The nursery value was calculated to be worth
US$
170maly
@as& on mwket pnices), the habitat value for protection of (migratory) species was mainly derived Rrom willhpess-to-pay studies, adding up toan average of
USS
439hdy.13.
Food Production
and
f
4. Raw Mate~als
Because of their high productivity and nutrient turnover, wetlands are able to provide a large array of fwd
.
items and raw materials in considerabte quan~tics on a sustainable basis, including for exmple fish and shellfish'
(Goth through hamesting and aquaculture), furb s (for food and br), reed and forest products (including fuelwood and charcoal). Values found io literature mn up to
US$Z,?SWy
for commercial