TENSILE STRENGTH AND STIFFNESS MODULUS OF FOAMED ASPHALT APPLIED
TO A GRADING REPRESENTATIVE OF INDONESIAN ROAD
RECYCLED PAVEMENT MATERIALS
Sri Sunarjono1) 1)
Ph.D Candidate of University of Nottingham, UK e-mail: [email protected]
ABSTRACT
Saving energy and sustainable construction are becoming important issues in pavement engineering. These issues constitute a strong incentive towards the use of foamed asphalt technology worldwide. Unfortunately, there is no current research attempting implementation of foamed asphalt technology in Indonesia. Therefore, this paper contributes an important figure of cold recycling construction in which a deteriorated pavement with a grading representative of Indonesian road was stabilised using foamed bitumen. The specimens containing 2% foamed bitumen were fabricated with diameter 100mm and height 50mm. The specimens were cured at ambient temperature prior to tensile strength and stiffness modulus testing at various curing period. The results have provided preliminary indication of foamed asphalt characteristics. During curing period, the properties can be identified into 3 stages; (1) moisture dependent region in which the tensile strength and stiffness modulus increase with time due to loss of moisture, (2) critical region in which the correlation between moisture and properties is not clear and affected by temperature regime, and (3) ageing or loss of latent moisture region in which the properties is predicted increase with longer curing time. The correlation between tensile strength and stiffness modulus has been established in which its stiffness (MPa) is about 4 times of its strength (kPa).
Keywords:foamed asphalt, stiffness modulus, tensile strength, moisture content, recycling, Indonesian road.
INTRODUCTION
Foamed asphalt is an asphalt mix using foamed
bitumen as its binder. Foamed bitumen is composed
of gas and continuous hot bitumen liquid phase,
produced by injecting a small amount of air and cold
water into hot bitumen. During the foaming process,
the gas content increases rapidly causing the bitumen
The increasing application of pavement
construction using foamed bitumen in many
countries is driver by saving energy and sustainable
construction issues, as foamed bitumen enables
coating of wet aggregates and therefore can be
applied as a cold mix system. Foamed bitumen can
be used with a wide range of aggregat in Dahlan et
al. (1997). In 1992, a new specification for AC mixes
with high minimum binder content to improve mix
durability was launched. Recently on parts of the
national road network, Split Mastic Asphalt (SMA)
was also e types from conventional high quality
graded materials, reclaimed asphalt and granular
materials to marginal materials such as those having
a high plasticity index (Muthen, 1999).
Foamed bitumen technology known over 50
years ago; nevertheless this material has not yet been
applied in Indonesia. Also, as far as is known, there
is no current research attempting implementation of
foamed bitumen technology in Indonesia. Therefore
this investigation of foamed bitumen will be a very
important research especially concerning an attempt
to implement this binder in Indonesian road
construction.
Regarding historical road pavements in
Indonesia (described in Part 2), it should be
understood that Indonesian roads have mainly been
constructed using Asphalt Concrete (AC) or Hot
Rolled Sheet (HRS) as a surface layer, and are often
found to have failed prematurely due to cracking and
plastic deformation. Any new layer overlaid on to
that layer will deteriorate due to a lack of structural
support. Therefore, recycling technology is one
interesting alternative solution to overcome these
problems.
This paper presents an experimental work on
foamed asphalt applied to a grading representative of
Indonesian road recycled pavement materials.
Indirect Tensile Stiffness Modulus (ITSM) and
Indirect Tensile Strength (ITS) testing were used in
order to assess the foamed asphalt properties.
INDONESIAN ROAD DEVELOPMENT AND
ITS PROBLEMS
1975, many of Java’s roads were overlaid with
asphalt concrete (AC) and many others (especially
outside Java island) were built as new road
constructions with AC material.
Unfortunately, these constructions often failed
prematurely by cracking. There may be a need to
improve the flexibility and durability of mixtures.
Then in 1986, Hot Rolled Sheet (HRS) began to be
applied to overcome the weakness of AC material.
HRS is a material adapted from Britain, namely
Rolled Asphalt. However, actually HRS was applied
as a fine AC with high bitumen content and
faileprematurely by plastic deformation. The
weakness of Indonesian roads in associate with
cracking and deformation described above can be
found implemented. Figure 1 shows the common
pavement structures applied in Indonesia. Road
surface uses AC (and also HRS) material, whereas
Asphalt Treated Base (ATB) and unbound granular
base Class A and B were commonly used as base
material and unbound granular sub-base Class A, B
and C were commonly used for sub-base material.
The main problem with the existing pavement
layer materials that contain AC (or HRS) material is
their bad condition, caused by cracking and plastic
deformation. Any new layer overlaid on a
deteriorated pavement section will fail prematurely.
Furthermore, it is strongly predicted that base and
sub-base layers have a lack of structural capacity. It
can be understood that, in part, rutting indicates a
base or sub-base layer problem. Therefore, recycling
technology is one interesting alternative solution to
overcome those problems. The cold recycling system
using foamed bitumen is then
evaluated to
understand its properties.
A recycling system was first introduced in the
mid 1990s. The project location was part of a section
of main road between Bandung and Cikampek in
West Java. The failed old pavement layer was
recycled to full depth by a hot recycling system and
produced a new base course layer. A cold recycling
project has also been conducting in many Indonesian
road sections e.g. in Kutai, East Kalimantan, starting
in 2004 in which asphalt emulsion was used as a
binder for the reclaimed material.
TENSILE STRENGTH AND STIFFNESS
MODULUS TEST
Indirect Tensile Stiffness Modulus (ITSM)
Stiffness is one of the important mechanical
properties, defined as uniaxial stress divided by the
corresponding strain. A base layer behaving high
stiffness
can protect the soil foundation by
decreasing soil shear stress; although this brings a
risk that the base layer itself may crack (Brown,
1994).
The Nottingham Asphalt Tester (NAT)
developed at the University of Nottingham enables
measurement of stiffness properties, especially for
bituminous materials, using simple practical methods
provided by a simple closed-loop computer
controlled pneumatic testing system.
Stiffness of bituminous material can be
measured quickly and easily using the indirect tensile
stiffness modulus (ITSM) test (BS DD 213, 1993)
under the Nottingham Asphalt Tester (NAT), which
is a non-destructive method and has been widely
used for determination of stiffness modulus values
(Cooper and Brown, 1989). This testing method uses
cylindrical specimens that may be prepared in the
laboratory or sampled from the field. The standard
target parameters pertaining throughout testing are as
follows:
Test temperature
: 20
oC
Rise time
: 124 ± 4 ms
Horizontal
deformation
: 5±2µm (for
ø
100mm)
7±2µm (for
ø
150mm)
Poisson’s ratio
: 0.35
Prior to testing, all specimens are stored in a
conditioning cabinet at the test temperature of 20
oC
for at least two hours. During testing, it is important
to adjust the magnitude of peak load to result in a
transient horizontal deformation value of 5 ± 2 µm
for a specimen with nominal diameter 100 mm.
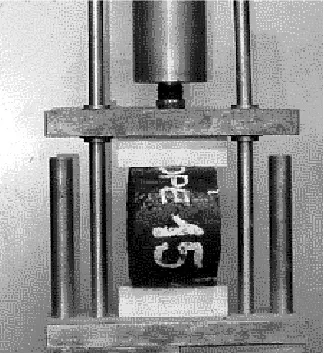
Figure 2 shows the typical test configuration for
ITSM. Based on the ITSM test, the stiffness modulus
of bituminous mixtures,
S
m, can be determined using
Eq.1 below:
Dt
L
S
m
(
0
.
27
)
(1)Asphalt concrete 40mm Marshall Stability > 750 kg Asphalt Treated
base
70mm Marshall Stability > 750 kg
Unbound granular base
200mm Aggregate class A CBR 80%
Unbound granular sub-base
500mm
200mm Aggregate class B CBR 60% 300mm Aggregate class C
CBR 30%
Compacted sub-grade
varies Selected materials
where:
S
mindirect tensile stiffness modulus (MPa)
L
peak value of the applied vertical load in
Newtons (N);
D
mean amplitude of the horizontal deformation
obtained from two or more applications of the
load pulse in millimetres (mm)
t
mean thickness of the test specimen in
millimetres (mm)
Poisson's ratio which for bituminous mixtures is
normally assumed to be 0.35
Figure 2. ITSM test configuration
Figure 3. ITS test configuration
Figure 4. Type of failure on ITS specimens
a) Clear tensile break – Specimen clearly broken along a diametrical line, except perhaps for small triangular section close to the loading strips,
b) Deformation– Specimens without a clearly visible tensile break line,
c) Combination– Specimens with a limited tensile break line and larger deformed areas close to the loading strips.
Indirect Tensile Strength (ITS)
The Indirect Tensile Strength (ITS) test may
very useful in understanding the tensile strength
characteristics and in predicting the crack appearance
in the mixture. The test method is also widely used to
determine the water sensitivity of bituminous
specimens once the volumetric design has been
completed.
BS EN 12697-23: 2003 describes the
procedure of determining the ITS value. The ITS test
can also be used to obtain the fatigue life and water
sensitivity using appropriate temperatures and
deformation rates (Table 1).
Table 1. ITS test protocol
Application
Deformation
rate (mm/min)
Temperature
(
oC)
ITS
50
25
Water
sensitivity
50
25
Fatigue
cracking
50
-10, 4, 20
In the ITS test, a cylindrical sample is
subjected to compressive loads between two loading
strips, which creates tensile stress, along the vertical
diametric plane causing a splitting failure. Diametral
load is applied continuously at a constant rate of
deformation until the peak load is reached, at which
point the specimen fractures (Figure 3). The type of
failure recorded may help the understanding of crack
appearance in the mixture (Figure 4). The ITS is the
maximum tensile stress calculated from the peak
load applied at break and the dimensions of the
specimen (Eq.2).
ITS =
Dt
P
2000
where
ITS
is the indirect tensile strength, expressed in kPa
P
is the peak load, expressed in kN
D
is the diameter of the specimen in mm
T
is the thickness of the specimen in mm
PROPERTIES OF MATERIALS USED
Foamed Bitumen
Foamed bitumen is produced by injecting air
and water droplets under high pressure into a
pre-heated penetration grade bitumen. As the water turns
into steam, bitumen changes from the liquid state
into foam. This is mainly a physical rather than a
chemical process. The life of the foam at ambient
temperature is very short, measured in seconds. Soon
after production, the foam bubbles quickly collapse
thus reverting the bitumen back to its liquid state and
gradually regaining its viscous condition.
Figure 5. Foamed bitumen produced in an expansion chamber
Foaming technology was first introduced by
Professor Ladis Csanyi (Csanyi 1957) and then
developed by Mobil Oil in the 1960s by creating an
expansion chamber. In the mid-1990s, the equipment
manufacturers Wirtgen developed this system by
creating the Wirtgen WLB-10 laboratory foaming
plant in which both air and water are injected into the
hot bitumen in an expansion chamber as shown in
Figure 5.
In this study, penetration grade bitumen pen
70/100 was selected for the production of foamed
bitumen. Basic properties of the bitumen including
penetration, softening point, and viscosity were
determined and the results are presented in Table 2.
0 6 12 18 24 30 36 42
0 1 2 3 4 5 6 7
Foam ing w ater (%)
M
a
x
E
x
p
a
n
s
io
n
R
a
ti
o
(
E
R
m
)
0 5 10 15 20 25
H
a
lf
-L
if
e
(
s
e
c
o
n
d
s
)
ERm
HL
Figure 6. Foaming characteristics of bitumen pen 70/100 at foaming temperature 150oC
Size 20-10mm Size 10-5mm Size < 5mm
Figure 7. Profile of RAP material
Table 2. Basic properties of bitumen pen 70/100
Penetration (25 C, 100 g, 5 s)(0.01 mm)
76
Softening point (ring & ball) (
◦C)
49.6
Viscosity @ 140
◦C (mPa s)
262
Viscosity @ 160
◦C (mPa s)
114
Viscosity @ 180
◦C (mPa s)
57
collapse to half of its maximum volume. For a given
temperature, there is an optimum percentage of
added water by mass of bitumen (foaming water) that
produces the most effective ERm and HL of the
foamed bitumen.
Figure 6
presents the foamed bitumen
characteristics at foaming temperature of 150
oC. It
can be seen that if foaming water increase, the ERm
increase and the HL tends to decrease. Wirtgen
(2005) recommends a minimum expansion ratio of 8
times and half-life of 6 seconds. In this study,
foaming water of 2.0% was selected to create the
most stable foam. The corresponding maximum ER
and HL values were 20 times and 10 seconds.
Reclaimed Asphalt Pavement (RAP)
Reclaimed asphalt pavement (RAP) was
collected from an asphalt producer with an in-plant
asphalt recycling facility. The RAP was originally
milled from various asphalt roads and brought
together into one stockpile. Composition analysis
was performed to determine the properties of RAP
and its extracted components. The results are shown
in Table 3.
In this study, to avoid variability of RAP
material, both in its gradation and other properties,
the materials are separated into 3 portions i.e. coarse
portion (10-20mm), medium portion (5-10mm) and
dust (< 5mm). Stone with size bigger than 20mm
was discarded since one or two big stones in a
specimen (diameter 100mm) would have an effect
inconsistent with specimen properties. RAP material
used in this study can be seen in Figure 7.
DEVELOPING ARTIFICIAL GRADING
In this study, an artificial grading means a
gradation of combined reclaimed pavement materials
in which the materials are collected from United
Kingdom sites but a grading was established closer
to that for an Indonesian reclaimed pavement. The
reason for this is that it is quite difficult to bring
large quantities material from Indonesia. As
described in Part 0, plenty of Indonesian roads suffer
premature damage in the surface layer, and this
situation is the main reason to reconstruct using a
recycling system.
Because there is no detail available of the
gradation of Indonesian reclaimed pavement, so
reference is made to the material specification used
generally in Indonesia (BM 1983 and DGH 1992).
This study investigated a scenario of 110 mm
recycling depth that contains recycled Asphalt
Concrete (AC) 40mm and Asphalt Treated Base
(ATB) layer 70mm (see Figure 1).
The recycling depth will be simulated with
100% RAP material. The grading of AC and ATB
was combined at a ratio of 40:70. The AC and ATB
grading was set from the lower limit of their
specifications. AC uses continuous grading whereas
ATB uses gap grading in which there is little
material size of 5 to 10 mm. The combined grading
is considered to be the desired grading. The artificial
grading for 100% RAP materials was then developed
by consideration of the grading limit for foamed
asphalt, the provided grading of RAP material and
the desired grading (see Figure 8). Because the
artificial grading has insufficient filler, so at least 5%
filler should be added to the artificial graded
material.
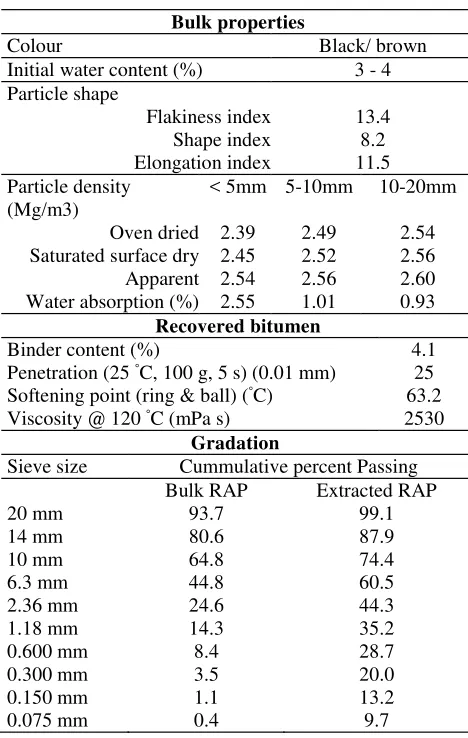
Table 3. Properties of RAP
Bulk properties
Colour Black/ brown
Initial water content (%) 3 - 4 Particle shape
Flakiness index Shape index Elongation index
13.4 8.2 11.5 Particle density
(Mg/m3)
< 5mm 5-10mm 10-20mm
Oven dried Saturated surface dry Apparent Water absorption (%)
2.39 2.45 2.54 2.55
2.49 2.52 2.56 1.01
2.54 2.56 2.60 0.93
Recovered bitumen
Binder content (%) 4.1
Penetration (25◦C, 100 g, 5 s) (0.01 mm) 25 Softening point (ring & ball) (◦C) 63.2 Viscosity @ 120◦C (mPa s) 2530
Gradation
Sieve size Cummulative percent Passing Bulk RAP Extracted RAP
20 mm 93.7 99.1
14 mm 80.6 87.9
10 mm 64.8 74.4
6.3 mm 44.8 60.5
2.36 mm 24.6 44.3
1.18 mm 14.3 35.2
0.600 mm 8.4 28.7
0.300 mm 3.5 20.0
0.150 mm 1.1 13.2
0.075 mm 0.4 9.7
SPECIMEN PREPARATION
Mix design procedure
0 10 20 30 40 50 60 70 80 90 100
0.0 0.1 1.0 10.0 100.0
Sie ve Siz e
%
P
as
si
n
g
Desired (A C+A TB ) grading
Lo wer specificatio n fo r FB
A rtificial grading
P ro vided RA P grading
Figure 8. Developed artificial grading
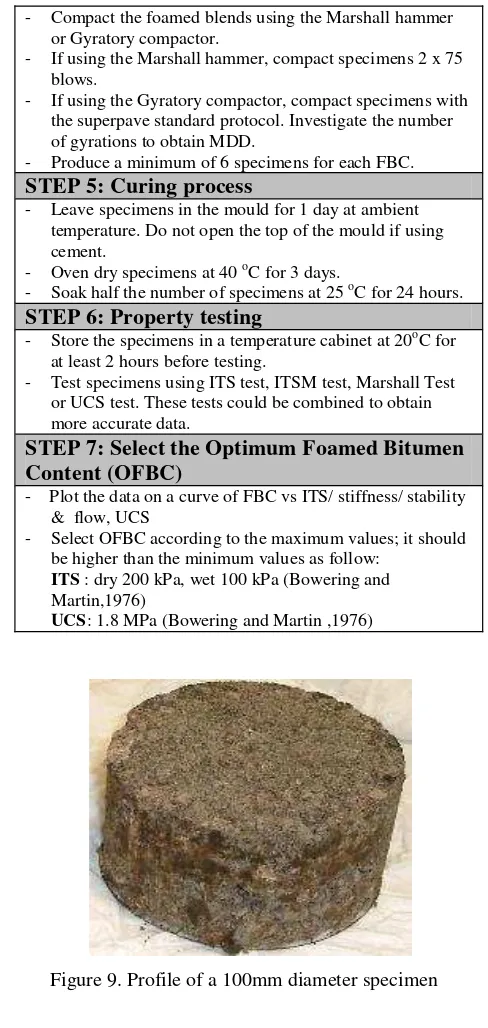
Specimen preparation procedure
All information of specimen preparation
procedure conducted in this study resulting briquettes
for further testing can be seen in Table 5. As an
example, a 100mm diameter of specimen compacted
using Gyratory compactor is shown in Figure 9.
Table 4. Mix design procedure
STEP 1: Determine the best foam quality
- Investigate ERmax and HL of foam at various temperatures and foaming water content.
- Select the best bitumen grade and temperature using the curve of ER vs HL
- Select the best foaming water using the curve of ER-HL vs foaming water and selected foam specification
STEP 2: Prepare the aggregate
- Check the Plasticity Index (BS 1377-2: 1990), add lime 1% for high PI aggregate.
- Check the gradation (BS EN 933-1:1997), ensure that gradation is located within the specification envelope for foamed asphalt (Akeroyd and Hicks ,1988). Minimum filler should be 5%.
- Determine maximum dry density (MDD) and optimum moisture content (OMC) using modified Proctor (BS 13286-2: 2004).
- Prepare 3 x 10 kg mass samples, check initial moisture content (MCintial) using duplicate sample.
- If using cement or lime, it should replace the equivalent percentage of filler
STEP 3: Mixing process
- Calculate the amount of water (mass by percentage of total aggregate mass) using the equation OCC = OMC– MCreduc.- MCinitial.
- Select 3 values of FBC. Calculate the amount of foamed bitumen by percentage of total aggregate mass. Add 25% to calculated foam mass. Set timer of foaming machine appropriate to foam mass.
- Add water to the aggregates first and mix for about 1 minute, continuing with spraying foam and extend mixing for a further 1 minute.
- Complete mixing the three 10 kg samples with selected FBCs.
STEP 4: Compaction process
- Compact the foamed blends using the Marshall hammer or Gyratory compactor.
- If using the Marshall hammer, compact specimens 2 x 75 blows.
- If using the Gyratory compactor, compact specimens with the superpave standard protocol. Investigate the number of gyrations to obtain MDD.
- Produce a minimum of 6 specimens for each FBC.
STEP 5: Curing process
- Leave specimens in the mould for 1 day at ambient temperature. Do not open the top of the mould if using cement.
- Oven dry specimens at 40oC for 3 days.
- Soak half the number of specimens at 25oC for 24 hours.
STEP 6: Property testing
- Store the specimens in a temperature cabinet at 20oC for at least 2 hours before testing.
- Test specimens using ITS test, ITSM test, Marshall Test or UCS test. These tests could be combined to obtain more accurate data.
STEP 7: Select the Optimum Foamed Bitumen
Content (OFBC)
- Plot the data on a curve of FBC vs ITS/ stiffness/ stability & flow, UCS
- Select OFBC according to the maximum values; it should be higher than the minimum values as follow:
ITS : dry 200 kPa, wet 100 kPa (Bowering and Martin,1976)
UCS: 1.8 MPa (Bowering and Martin ,1976)
Figure 9. Profile of a 100mm diameter specimen
0 200 400 600 800 1000 1200 1400 1600
0 7 14 21 28 35
Curing period (days)
IT
S
M
(
M
P
a
)
0 100 200 300 400 500 600 700 800
IT
S
(
k
P
a
)
ITS line ITSM line
Table 5. Specimen preparation procedure
RAPcomposition
10-20mm = 45% 5-10mm = 15% Less than 5% = 35%
Filler = 5% (limestone)
Foamed bitumen
Bitumen Pen 70/100 Foaming temperature 150oC Foaming water 2%
Foamed bitumen content 2% Foaming
machine setting
Air pressure= 5 bar Water pressure= 6 bar
Setting calculation for FBC 2% (mass of aggregate 8000g)
Mass of foamed bitumen = 2% x 8000g = 160g FB used = 1.25 x 160 = 200g Setting timer = 200/100 = 2 seconds Moisture
content calculation
OMC = 5.2 % MCreduc. = 1.28 % MCinitial = 0.3 % OCC = 3.62 %
Mixing Using Hobart mixer 20 quarts Mass of aggregate = 8000g Mass of water =3.62% x 8000g
= 289.6g ~290g Water used = 1.05 x 290g
= 305g (3.81%) Density MDD = 2.145 Ton/m3 Specimen
preparation
Specimen size: diameter 100mm, height 50mm
Mass of dry material=MDD x Vol = 2.145 x 392.70 = 842.4g Mass of water = 3.81% x 842
= 32.1 g Total mass of FA blending
= 842.4 +32.1 = 874.5 g ~ 875g Checked moisture content =
4.46% (higher than calculation) Gyratory
compaction
Force 600 kPa
Compaction angle = 1.25 degree Setting = density control
Curing At ambient temperature
0 200 400 600 800 1000 1200 1400 1600
0 7 14 21 28 35
Curing period (days)
IT S M ( M P a ) 0 100 200 300 400 500 600 700 800 IT S ( k P a ) ITS line ITSM line
Figure 10. ITS and ITSM properties at various curing period
Table 6. ITS and ITSM test Results
Samples
Age
(days)
Moisture
content
(%)
ITS
(kPa)
ITSM
(MPa)
1
1
1.651
58
232
2
1
2.002
65
206.5
3
1
1.289
77
280
4
3
0.705
174
620.5
5
3
0.611
136
624
6
3
0.636
174
756
7
7
0.349
296
1114
8
7
0.295
271
1097
9
7
0.366
290
1180
10
14
0.207
367
1427
11
14
0.218
277
1502
12
14
0.217
225
1081
13
29
0.169
288
1248
14
29
0.218
335
1477
15
29
0.199
275
1285
0 200 400 600 800 1000 1200 1400 1600
0 0.3 0.6 0.9 1.2 1.5 1.8 2.1
m ois ture conte nt (%)
IT S M ( M P a ) 0 100 200 300 400 500 600 700 800 IT S ( k P a )
Curing 1 day Curing 3 days Curing 7 days Curing 14 days Curing 29 days
ITSM line
ITS line
Figure 11. Effect of moisture content on ITS and ITSM
TEST RESULTS AND DISCUSSION
Table 6 shows the results of ITS and ITSM
testing at different curing time.
All specimens were subjected to stiffness
modulus investigation (ITSM test) prior to strength
testing (ITS test). This procedure is allowed due to
the ITSM testing is a non-destructive assessment. All
tests were conducted at temperature of 20
oC in order
to establish a correlation between stiffness modulus
and strength properties.
The ITS tests were performed in an Instron
machine. The apparatus is displacement controlled
and both load and displacement can be recorded by
load cell and LVDT respectively. In this test, the
load was set at 10 kN and the maximum stroke
10mm. The tests were conducted using standard
displacement speed i.e. 50 mm per minute.
Figure 10 shows the results of ITS and ITSM
tests on all specimens. The specimens cured at
ambient temperature were tested at 1 day, 3 days, 7
days, 14 days and 29 days age. It can be seen that an
increased curing period significantly increased the
tensile strength and stiffness of specimens. The
initial properties is very low i.e. ITS and ITSM
values are about 50 kPa and 200 MPa respectively
and then its properties improve sharply during 7
days. This can be explained by Figure 1 that presents
moisture content data during the curing period. It can
be seen that during 7 days, the moisture content
reduce significantly. It is clear that increasing
strength and stiffness of specimens during the curing
period is mostly caused by loss of moisture.
As shown in Figure 10 and 11, there is no
significant different between ITS and ITSM trend
data in relation to curing time and moisture content.
Figure 12 gives strong support in that ITS and ITSM
have approximately linear correlation with R
2equal
0.9298. It is found that ITSM value (MPa) is about 4
times of ITS value (kPa). This correlation is very
important in order to understand a relationship of
fundamental and engineering properties of foamed
asphalt materials. However, more data is still
required to develop a valid equation of those
properties.
Figure 13 explains the characteristics of
material stiffness depending on the amount of
moisture loss during curing time. The various data
from specimens cured at ambient temperature from 1
day until 60 days and specimens cured with
accelerated curing were collected together to
construct this relationship. The logarithmic trend line
was established to allow the possibility of forward
forecasting.
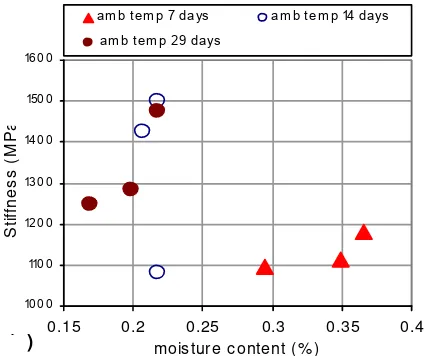
As shown in Figure 13, it can be stated that the
stiffness of specimens, during curing, are moisture
dependent until this reach a critical region. In the
critical region, the moisture appears very difficult to
lose. It may be that this point is the latent moisture
content of the specimen, hidden inside the aggregate
or trapped by the foam. In other observation, it was
also found that the latent moisture content both of
covered and uncovered specimens reached around
0.2 to 0.3 %. In this study, as shown in
Figure Figure 4, the critical region was
found to be around 0.2 to 0.4 % of moisture content.
In the field, Batista (2005) found that the moisture
content of pavements during 60 days varied between
0.25 and 1.5 % in the case of a study on emulsion
mix.
y = 4.3712x - 21.988 R2 = 0.9298
0 200 400 600 800 1000 1200 1400 1600 1800
0 100 200 300 400 500
ITS (kPa)
IT
S
M
(
M
P
a)
Figure 12. Relationship between ITS and ITSM values
After passing the critical region, it is unknown
what will happen in term of change to specimen
properties and moisture. This is because, in this
study, the specimens still stand within the critical
region at 60 days and no data is yet available after
that. It is strongly predicted that stiffness will
increase with longer curing time (Thom, 2005).
However, it is as yet unanswered what might came
such an increase in stiffness. In hot mix asphalt,
ageing of asphalt, the tendency for bitumen to harder
has been known as the cause of increasing stiffness
during pavement life. But the increase is very small,
around a quarter of the ageing index during mixing
(Read and Whiteoak, 2003). In the case of emulsion
asphalt, Batista (2005) found that during 2 to 4
months the stiffness increased significantly from
1000MPa to around 2000 MPa (uncovered
specimens) and from 1500 MPa to 2000 MPa
(covered specimens). In case of foamed asphalt,
which only uses a small amount of bitumen and has
imperfect coating of the aggregate particles, and also
with the presence of low water content in the
material, increasing stiffness after the critical region
can not be explained directly?
properties at low moisture content with avoid
temperature effect, the vacuum method is adopted.
0 500 1000 1500 2000 2500 3000 3500
0 0.2 0.4 0.6 0.8 1 1.2 1.4 1.6 1.8 2 2.2 2.4 moisture content (%)
IT
S
M
(
M
P
a
)
moisture regime
critical region effect of ageing and loss of latent moisture
Figure 13. ITSM-moisture content relationship
10 0 0 110 0 12 0 0 13 0 0 14 0 0 150 0 16 0 0
0.15 0.2 0.25 0.3 0.35 0.4 mois ture c ontent (% )
S
ti
ff
n
e
s
s
(
M
P
a
am b t em p 7 days am b t em p 14 days
am b t em p 29 days
(e )
Figure 14. Foamed asphalt properties at critical region
The specimens were put in a vacuum cabinet at
30 mBar for 15 hours. Two temperatures were
selected i.e. 20
oC and 30
oC. Figure 15 shows the
results relative to the specimens cured at 40
oC (3
days) and ambient temperature (29 days). It can be
seen that the final moisture content of all specimens
approached to the critical region (0.2-0.4%). The
stiffness of specimens using vacuum method are
found lower than specimens cured at 40
oC and
ambient temperature. This fact gives support that
temperature applied during curing period affects to
the stiffness of specimens.
600 800 1000 1200 1400 1600
0.1 0.15 0.2 0.25 0.3 0.35 0.4 0.45
Moisture content (%)
IT
S
M
(
M
P
a
)
Vacuum at 30 C Vacuum at 20 C
Oven 40C-3 days Amb temp-29 days
Figure 15. Effect of accelerated curing on ITSM
CONCLUSIONS
This
paper
summarizes
a
laboratory
investigation on the strength and stiffness modulus
properties of foamed asphalt in which the gradation
of material used was established closer to that for an
Indonesian reclaimed pavement. Based on the
results, the following conclusions are drawn:
1) The initial strength and stiffness modulus of
foamed asphalt material are low; however these
properties improve significantly during curing
period. The increasing strength and stiffness of
specimens is mostly caused by loss of moisture.
2) The ITS and ITSM values have approximately
linear correlation in which the ITSM value
(MPa) is about 4 times of ITS value (kPa).
3)
The curing time period of foamed asphalt can be
divided into 3 stages:
first,
moisture dependent
region in which the properties improve with
reducing moisture content;
second
,
critical
region
in which the correlation
between
moisture and properties is not clear;
and
third
,
ageing or loss of latent moisture region in which
the properties is predicted increase with longer
curing time
.
4) Temperature during curing time plays
important effect on the properties especially
in the critical and ageing region.
ACKNOWLEDGEMENTS
REFFERENCES
Akeroyd, F.M.L. & Hicks, B.J., 1988. Foamed
Bitumen Road Recycling.
Journal of Highways
,
Volume 56, Number 1933, pp 42, 43, 45.
Batista, F.A., 2005.
Asphalt Cold Mixture for
Pavement
Rehabilitation
Overlays
and
Recyclings.
Laboratorio National de Engenharia
Civil, Portugal.
Bina Marga, 1983.
Spesifikasi Lapis Aspal Beton
(Laston).
BM No 13/PT/B/1983, Dirjen Bina
Marga, Jakarta, Indonesia.
Bowering, R.H. & Martin, C.L., 1976. Foamed
Bitumen Production & Application of Mixed
Evaluation & Performance of Pavements.
Proc.,
Assn of Asphalt Paving Technologist (AAPT)
,
Vol. 45, 1976, pp. 453-477.
British Standard, 1993.
Method for determination of
indirect tensile modulus stiffness of bituminuous
mixtures
. Draft for development, DD 213: 1993.
British Standard, 2003.
Determination of the indirect
tensile strength of bituminuous specimens
.
Bituminous mixtures
–
test methods for hot mix
asphalt, BS EN 12697-23:2003.
Brown, S.F., 1994.
Properties of road layers
. In:
Bituminuous mixtures in road construction, pp
43-63. Edited by Hunter, R.N. Thomas Telford,
London.
Cooper, K.E. and Brown, S.F., 1989. Development
of a Simple Apparatus for the Measurement of
the Mechanical of Asphalt Mixes.
Proceedings,
Eurobitument Symposium 1989
, pp 494-498.
Csanyi, L.H., 1957. Foamed Asphalt in Bituminous
Paving Mixes.
Highway Research Board Bulletin
Vol.10 No.160 Pp 108-122.
Dahlan, A.T. et al, 1997. Improved Design Procedure
of hot mix asphalt. Overseas Center, Transport
Research Laboratory, Crowthorne, Berkshire RG
45 6AU, United Kingdom in association with PT
Yodya Karya, Indonesia. Paper presented at
2
ndConference of Eastern Asia Society for
Transportation Studies
, Seoul, Korea, 29-31
October 1997.
DGH, 1992.
Specifications for Dense Graded
Asphalts
(Asphaltic
Concrete).
Directorat
General of Highway, Jakarta, Indonesia.
Lee, H.D and Kim, Y.J., 2003.
Developing of a mix
design process for cold-in-place rehabilitation
using foamed asphalt
. Final Report for TR-474
Phase I. Report on Research Sponsored by Iowa
Department
Transportation,
Public
Policy
Center, Civil and Environmental Engineering,
The University of Iowa, Desember 2003.
Mobil Oil Australia Ltd. Foamed Bitumen
–
A New
Development.
Technical Buletin, Bitumen
No.6.
Muthen, K.M., 1999.
Foamed Asphalt Mixes, Mix
Design
Procedure.
Contract
Report
CR-98/077,June 1999. CSIR Transportek, South
Africa.
Read, J. and Whiteoak, D., 2003.
The Shell Bitumen
Handbook
. Fifth edition, ISBN: 0 7277 3220 X,
Shell UK Oil Products Limited.
Thom, N.H., 2005.
Cold-Mix Asphalt
. Lecture notes.
University of Nottingham.
Sunarjono, S. 2006.
Pavement Stabilisation using
Foamed Bitumen
, First year report, Report No.
NCPE 3, School of Civil Engineering, University
of Nottingham.