(Case Study in Districts / Cities in Riau Province Period of 2010 to 2014)
ANALISIS PENGARUH JUMLAH PENDUDUK,
PENGELUARAN PEMERINTAH DAN PRODUK DOMESTIK
REGIONAL BRUTO (PDRB) TERHADAP
PENDAPATAN ASLI DAERAH (PAD)
(Studi Kasus di Kabupaten/Kota di Provinsi Riau tahun 2010-2014)
Author:
Muhammad Yusuf
20120430280
FACULTY OF ECONOMIC
ANALISA PENGARUH JUMLAH PENDUDUK, PENGELUARAN PEMERINTAH DAN PRODUK DOMESTIK REGIONAL BRUTO (PDRB) TERHADAP PENDAPATAN ASLI
DAERAH (PAD)
(Studi Kasus di Kabupaten/Kota di Provinsi Riau Tahun 2010-2014)
UNDERGRADUATE THESIS
In partial fulfillment for the requirement for the degree of Bachelor of Economics
(Sarjana Ekonomi) at International Program for Islamic Economics and Finance (IPIEF),
Economic Department
WRITTEN BY
MUHAMMAD YUSUF
20120430280
FAKULTAS EKONOMI
UNIVERSITAS MUHAMMADIYAH YOGYAKARTA
Student Number : 20120430280
I hereby, declare that this undergraduate thesis entitled: ”ANALYSIS OF TOTAL POPULATION, GOVERNMENT SPENDING AND GROSS REGIONAL DOMESTIC PRODUCT (GRDP) INFLUENCE TOWARDS LOCAL REVENUE (PAD) (Case Study in Districts/Cities in Riau Province on Period of 2010 to 2014)” does not consist of any content that ever being purposed for any degree in other university, ideas of any research and publication of others, in exception all quotes and ideas which are purposely taken are considered as the research references and listed in the reference list. Therefore, if any violation of intellectual right is found in this study, I agree to accept any relevant academic consequences.
Yogyakarta, 22nd of August 2016
اذإ
مظعلا
دتشإ
د جلا
دتمإ
داؤفلا
ه ب
دح تإ
ل ف
ح ج ن
نسح
م تخلا
نل
درُي
اذإ ف
تغرف
صن ف
#
ىلإ
ك بر
غر ف
(Al-Insyirah: 8-9)
Orang yang paling banyak mengambil inisiatif, maka dialah yang akan banyak mendapat. Karena dia berfikir, berbuat dan banyak mendapat hasil. Hasil dan keberhasilan dari kerja
keras adalah hiburan baginya.
(KH. Abdullah Syukri Zarkasyi)
Jangan tidak berbuat karena takut salah, lebih baik berbuat salah dari pada salah karena tidak berbuat.
1. My Beloved Parent.
2. My Big Family of IKABAYU and M.H Soebandi.
3. My Beloved Campus GONTOR, Darussalam Islamic Boarding School.
4. My Beloved Campus Muhammadiyah University of Yogyakarta.
5. All Lectures of International Program for Islamic Economic and Finance (IPIEF) and
Economic Study Program, Muhammadiyah University of Yogyakarta.
partners, The Creator of everything in this Universe, and none Creature stand against Him.
Who has given his Gracing for health and opportunity till I can finish and complete writing
this Undergraduate Thesis entitled: “Analysis of Total Population, Government Spending and
Gross Regional Domestic Product (GRDP) Influence towards Local Revenue (PAD), (Study
Case in Districts/Cities in Riau Province 2010-2014)”. And also Peace and Salutation always
delivered to our best messenger Muhammad Peace be upon Him. Who has become Uswatun
Hasanah for all of us.
This Undergraduate Thesis has been structured in partial fulfillment for the requirement
for the degree of Bachelor of Economics on Economic Department in Muhammadiyah
University of Yogyakarta. With expectations, this Undergraduate Thesis can be used as input
for related parties in region to promote the basic sector.
The completion of structuring this Undergraduate Thesis is cannot be separated from
the guidance and support of various parties. Therefore, in this opportunity author would to
say a lot of thanks to:
1. My highest gratitude to Almighty Allah and my Prophet Muhammad Peace be upon
Him, Who has given us mercies and blessing until I can finish my undergraduate thesis
without any problems.
2. My Beloved Family, especially my parents Mr. Thomas Baharuddin and Mrs.
Komalasari Soebandi, who always already support me, work hard for me, for my
educational period in Muhammadiyah University of Yogyakarta, I won’t let you down,
University of Yogyakarta.
4. Dr. Nano Prawoto, SE.,M.Si., as a Dean of Economic Faculty.
5. Dr. Masyhudi Muqorrobin, S.E., Akt., M.Ec., as the Director of International Program
for Islamic Economics and Finance. Muhammadiyah University of Yogyakarta.
6. Dr. Imamudin Yuliadi, S.E., M.Si., as the Head of Economic Department.
Muhammdiyah University of Yogyakarta.
7. Mr. Agus Tri Basuki, S.E., M.Si., and Mr. Ayif Faturrahman, S.E., M.Si, as my
supervisor in writing this Undergraduate Thesis.
8. All Lectures and staff for Economics and IPIEF: Dr. Lilies Setiartiti, SE.,M.Si, Dimas
Bagus W and other Lectures, Mr. Umar, Mr. Sahlan and Mrs. Linda who has provided
amazing knowledge.
9. My Beloved Campus GONTOR, Darussalam Islamic Boarding School, who has been
guiding, teaching and educating me. I’m so sorry that I cannot yet be what you want to
be. And contribute as much as I can.
10. Big Family of Himpunan Mahasiswa Ilmu Ekonomi (HIMIE) UMY, (Amar ma’ruf,
Wafi, Hafid, Fadly, Endah, Malik, Adilah, Muthia, Nadia, Fitra, Haryadi, Diah,) and
others.
11. Big Family of IPIEF Student, especially batch 2012. (Bima, Bayu, Fathur, Irfan, Ardi,
Puguh, Andika, Adjie, Nurul, Widhia, Dini, Fitri, Lia, Caca, Fanny). Thanks for four
years of togetherness.
12. Big Family of Kontrakan Permata (Ibnu Kholil, Maulana Najmuddin, Ahmad
Amin, Iman, Fatin, Ena, Bita, Dyah, Mirna, Mya, Intan, Yuni). Thanks for supporting
me, for being second place to accept my weakness.
14. Team of Seven Days (Weni, Thomi, Addin, Luki).
15. Big Family of Prime Yogyakarta and AB10YK.
16. My Old Friends (Mahrus, Yahtadie, Aziz, Brongky, Wahyu, Kamal, Irfan, Zaky,
Robin, Dion, Rifqy).
17. And all parties who have provided support and encouragement until this undergraduate
thesis was completed.
Hopefully, this research will give benefits to anyone who needs, and there are still more
weakness and mistakes, therefore, it required to criticism and best suggestions for any better
results.
Yogyakarta, 22nd of August 2016
EXAMINER AGREEMENT………... iii
DECLARATION ... iv
MOTTO………. v
DEDICATION……….. vi
ABSTRACT ... vii
FOREWORD……… viii
CONTENTS ... xi
TABLES ... xiii
FIGURES ... xv
CHAPTER ONE INTRODUCTION ... 1
A. Research Background ... 1
B. Limitation Research ... 11
C. Problem Formulation Research ... 11
D. Research Purposes…... 12
E. Benefits of Research………... 12
CHAPTER TWO LITERATURE REVIEW ... 13
A. Outline of Theory and Decline Hypothesis ... 13
1. The Concept of Local Revenue ... 13
2. Sources of Regional Income ... 14
3. The Relation Between Total Population and Local Revenue ... 24
4. The Relation Between Government Spending and Local Revenue ... 25
5. The Relation Between Gross Regional Domestic Product ... 25
B. Previous Studies ... 26
C. Framework ... 31
D. Hypothesis ... 31
CHAPTER THREE RESEARCH METHODOLOGY ... 32
A. Object / Subject of Research ... 32
B. Types and Sources of Data ... 32
G. Quality Test Data……… . 42
H. Statistical Analysis Regression Test………. 45
CHAPTER FOUR GENERAL DISCRIPTION ... 49
A. Local Revenue ... 49
B. Total Population ... 52
C. Government Spending ... 55
D. Gross Regional Domestic Product (GRDP) ... 60
CHAPTER FIVE ALAYSIS AND DISCUSSION ... 68
A. Classical Assumption Test ... 68
B. Model Selection ... 71
C. Estimation Results and Regression Panel Model………. 75
D. Statistic Test………. 78
E. Theoretic Test (Economic Interpretation)……… 81
F. Implication……… 90
CHAPTER SIX CONCLUSIONS, SUGGESTIONS AND LIMITATIONS ... 93
A. conclusions ... 93
B. Suggestions ... 94
C. Research Limitations……… 96
Table 1.2 Local Revenue for Districts/Cities in Riau Province
Years 2010-2014 ... ... 8
Table 1.3 Total Population in Riau Province in 2010-2014... 9
Table 1.4 Government Spending of Districts/Cities in Riau Province Years 2010-2014 ... 9
Table 1.5 Riau Province on The Basis of Gross Regional Domestic Product (GRDP) Series 2010 at Constant Market Prices By Category Including Oil and Gas in 2010-2014………. 10
Table 2.1 Previous Studies ... .. 29
Table 4.1 Realization of Local Revenue in Districts/Cities According to The Acceptance (thousands rupiahs), 201-2014 ... 50
Table 4.2 .Realization of Local Revenue in Every Districts/Cities in Riau Province, According to The Acceptance (thousands rupiahs), 2010-2014 ... 51
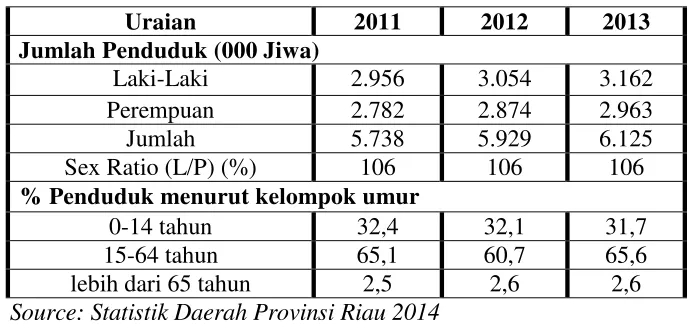
Table 4.3 Indicators of Riau Population ... 53
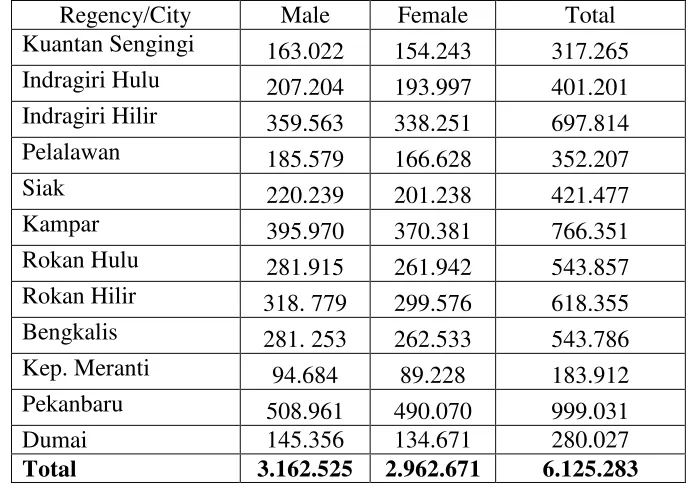
Table 4.4 The Distribution of Population for Districts/Cities by Gender in Riau Province in 2013... 54
Table 4.5 Realization of the Regional Budget (APBN) Riau Province in 2014 . 56 Table 4.6 Realization of Government Spending in All Districts/Cities, Riau Province, 2010-2014 ... 57
Table 4.7 Realization of Government Spending by The Districts/Cities (thousands rupiahs) Riau Province in 2010-2014 ... 59
Table 4.8 The Economic Growth of Districts/Cities in Riau Province on 2012-2014 ... 62
Table 4.9 The Economic Growth of Districts/Cities in Riau Province 2010-2014……….. 65
Table 5.1 Multicollinearity Test (Coef Covariance Matrix)………... 69
Table 5.2 Heteroscedasticity Test with Park Test……….. 70
Table 5.3 Chow Test Result……….. 73
for Districts/Cities in Riau Province at 2014 ... 63 Figure 4.2 Economic Structure with Oil and Gas For Districts/Cities
Riau Province in 2010-2014.
This Study uses a quantitative approach. The research data were secondary data from 12 Districts/Cities in Riau Province in 2010-2014. The analysis model was data panel analysis with Fixed Effect Model.
The results showed that Total Population has no effect to Local Revenue. While, Government Spending and Gross Regional Domestic Product (GRDP) have positive significant effect to Local Revenue.
1
With the implementation of governance reforms in the form of regional
autonomy in every county and city in Indonesia, then each region is expected to
be ready in facing the implementation of regional autonomy by the central
government as responsible for the implementation of the reform. Implementation
of Regional Autonomy implemented with the support of personnel, equipment,
and adequate financing. In the Constitution of Republic of Indonesia number 32
of 2004 explained that Regional autonomy is the devolution of government power
from central government to autonomous regions to organize and manage the
system of government in the Republic of Indonesia.
The implementation of regional autonomy aims to relieve the central
government of burdens and unnecessary handling of domestic affairs; the central
government is expected to be able to concentrate on the formulation of national
macro policies that are strategic. On the other hand, the autonomous region will
undergo a significant process of empowerment. It is used as a basis for regional
autonomy policy (Harris in Aryanti and Indarti, tt).
Autonomous regions have the authority and responsibility to community life
based on the principles of openness, participation and accountability to the public.
The principle in question is more aware of local needs and services for the region,
with the hope of autonomy granted to spur regional economic growth and welfare.
of 2004 explains that the source of financing of the regions in the implementation
of the decentralization comes from: 1) the local revenue, 2) the balance funds, and
3) other legitimate income (Tobing, 2015). By implementing this decentralization,
local governments are expected to optimize the reception area as well as be more
independent in managing finances and reduce reliance on the central government.
One indicator to measure the level of local capacity to implement regional
autonomy is the Local Revenue (PAD). Regional Autonomy itself can have a
positive impact for the district / city that has the potential of natural resources, but
not so with the district / city are poor in natural resources, which is one of the
problems facing the government district / city in general is limited funding
originating from the region itself (PAD), so that the process of regional autonomy
has not been able to run as it should (Aziz in Datu K., 2012).
Granting autonomy to the regions is one alternative in efforts to increase the
real role and independence of the region as well as an increase in the prosperity of
the people in a fair and equitable. Then the regional development carried out in a
planned, comprehensive, integrated, effective, independent and sustainable can
realize the life that is parallel to the other more developed regions as well as the
aggregate of improved well-being of the nation and the state fair and equitable.
The local government has a necessary role in exploring and developing the
potential of the region as a source of revenue that can determine the success of a
region in carrying out the implementation of local development, community
service and even autonomy. To that end, local governments are expected to move
development, especially in the development of potential revenue (PAD). The
existence of regional autonomy policy, in the hope local governments can
optimize the management of financial resources originating from the area local
revenue. The development potential of the region's autonomy through the Local
Revenue is visible from the development potential and role of the community
through taxes and levies. In this current era of decentralization, the function and
role of taxes as one feels very important state revenue in the form of self-reliance,
independence either in planning or in the management of financial resources of
the area (Aryanti and Indarti, tt).
Soleh and Rochmansyah (in Atmaja, 2011) states that the context of autonomy
and decentralization is still dominated on the aid and assistance from the
government, either in the form of General Allocation Fund (DAU), Funds (DBH),
while the proportion of income (PAD) is relatively small, because of the presence
of the General Allocation Fund (DAU) became dependency. So with the holding
of fiscal decentralization, local governments are expected to optimize the
reception area, so that local governments can be independent in the area of
financial management and reduce dependence on the central government, both in
terms of financing, construction, and management of the area.
Instead, the success of economic development and the performance of a region
can be seen from several indicators, in particular of macro indicators. Macro
indicators which can be analyzed and which would be material in this study is the
Gross Regional Domestic Product (GRDP) which is the sum of gross value added
Regional economic growth associated with the progressive increase in the
production of goods and services, as measured by the amount of the economic
conditions of a region in a given period.
The total population is also an indicator of economic growth of a country or
region. The high number of the population is highly correlated with the increase in
the amount of labor that is considered positive in stimulating economic growth,
the more the population will increase the productivity of an area, But all of it,
depending on the local government and the economic system in managing human
resources in the area.
Coupled with a visible indicator of government spending in the public service
improvement and prosperity of the region, the regional government and
parliament is expected to produce a budget that truly meets the needs of local
communities in accordance with the potential of each. To see whether the area has
been prepared financially to meet local autonomy, namely by looking at the
sources of budget revenues it is able to close the state budget. As well as the
budget allocation for development expenditure on projects that directly touch
productive economic sectors, so as to improve the community economy (Datu K,
2012).
Local Revenue is the essential partner in the implementation of Development,
because the funds used are owned by the local government itself. So the
government has the authority to manage the fund. The local government is also
the local communities who have the right to get back the funds in the form of
development in the area.
In Act No. 33 of 2004 article 2 explained that the financial balance between
the government and the local government is a subsystem of state finances as a
consequence of the division of tasks between the government and local
governments. The central government is also in charge of maintaining fiscal
balance in the region, by providing matching funds. In Act No. 33 of 2004 Article
3 explains that the Balance Fund aims to reduce the fiscal gap between the
government and local authorities and inter-regional governments. Balance Fund
includes DBH, DAU and the Special Allocation Fund.
Prakosa (in Atmaja, 2011) said that, with the transfer of funds from the central
government, local government is a source of funding for the implementation of
the authority. But in reality, the transfer of these funds is the main funding source
of local governments to finance their spending. The purpose of this transfer is to
reduce (if not possibly eliminate) the fiscal gap between the government and
ensure the achievement of the minimum standard of public services across the
country. Supposed shortage of funds transfer is expected to be taken on its own
funding sources are Local Revenue (PAD).Variables that can be controlled are the
variables and institutional policies set by local governments, including the initial
conditions of a region, increased expansion and intensification acceptance of
Local Revenue (PAD), the procurement of new development, the search for new
sources of revenue, regulatory changes and tariff adjustments. While the
author, such as, population, government spending and Gross Regional Domestic
Product (GRDP). Riau is a Developing Province in Sumatra that has a lot of
potential in all aspects such trade aspect, management of industry, agriculture and
tourism. All of these aspects can support economic growth in Riau. There are 12
areas. The twelfth Districts / cities in Riau can increase the income of the area,
which later twelfth the area can be independent by utilizing the aspects mentioned
above in each district / city. So that local governments could no longer rely on the
revenues from the central government and the results can be directly felt by the
local community. The increasing acceptance of Riau Province in the five-year
period (2010-2014) can be seen in the table below. The level of acceptance in
Riau, make them as the top three Provinces in Sumatra with the largest number of
admissions. Thus, the authors assume that the amount of revenue can be increased
more for the implementation of economic development in Riau Province. And it
also will affect Local Government to boost revenues of the Districts/Cities in Riau
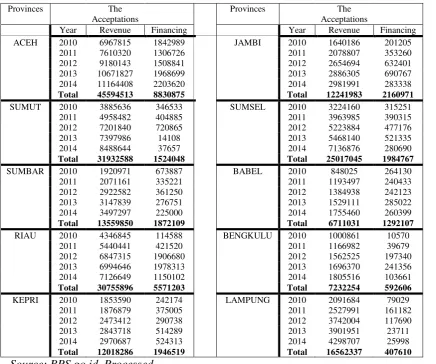
Table 1.1
Recapitulation of Local Government Revenuesin Sumatra’s Province
Years 2010-2014
Provinces The Acceptations
Provinces The Acceptations
Year Revenue Financing Year Revenue Financing ACEH 2010 6967815 1842989 JAMBI 2010 1640186 201205
2011 7610320 1306726 2011 2078807 353260 2012 9180143 1508841 2012 2654694 632401 2013 10671827 1968699 2013 2886305 690767 2014 11164408 2203620 2014 2981991 283338
Total 45594513 8830875 Total 12241983 2160971
SUMUT 2010 3885636 346533 SUMSEL 2010 3224160 315251 2011 4958482 404885 2011 3963985 390315 2012 7201840 720865 2012 5223884 477176 2013 7397986 14108 2013 5468140 521335 2014 8488644 37657 2014 7136876 280690
Total 31932588 1524048 Total 25017045 1984767
SUMBAR 2010 1920971 673887 BABEL 2010 848025 264130 2011 2071161 335221 2011 1193497 240433 2012 2922582 361250 2012 1384938 242123 2013 3147839 276751 2013 1529111 285022 2014 3497297 225000 2014 1755460 260399
Total 13559850 1872109 Total 6711031 1292107
RIAU 2010 4346845 114588 BENGKULU 2010 1000861 10570 2011 5440441 421520 2011 1166982 39679 2012 6847315 1906680 2012 1562525 197340 2013 6994646 1978313 2013 1696370 241356 2014 7126649 1150102 2014 1805516 103661
Total 30755896 5571203 Total 7232254 592606
KEPRI 2010 1853590 242174 LAMPUNG 2010 2091684 79029 2011 1876879 375005 2011 2527991 161182 2012 2473412 290738 2012 3742004 117690 2013 2843718 514289 2013 3901951 23711 2014 2970687 524313 2014 4298707 25998
Total 12018286 1946519 Total 16562337 407610
Source: BPS.go.id, Processed
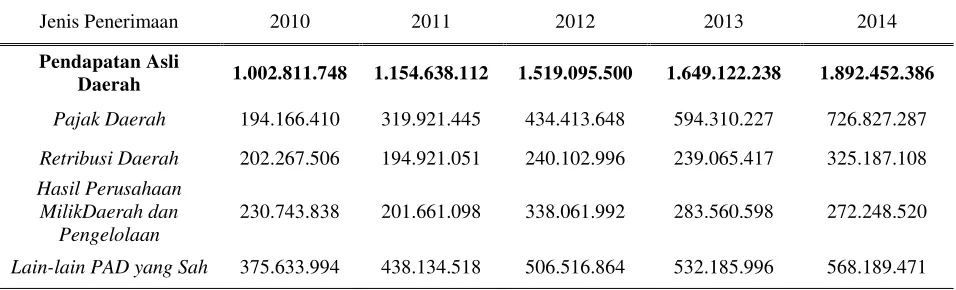
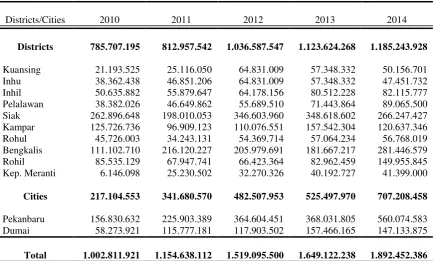
Instead, the amount of Local Revenue (PAD) in Riau province also continues
to increase. Local Revenue (PAD) was taken from the taxes, levies, local-owned
company results and management as well as other legitimate of Local Revenue
(PAD) from each Districts/ Cities in Riau. Riau Province was included in the top
three provinces in Sumatra, which get the largest revenues among seven other
provinces. So, the Total Revenue during five years is Rp. 30.755.896. And Aceh
reaching Rp. 45.594.513. In this case, Riau Province has increased revenues from
year to year, the same as the two provinces with the largest amount of revenue
other.
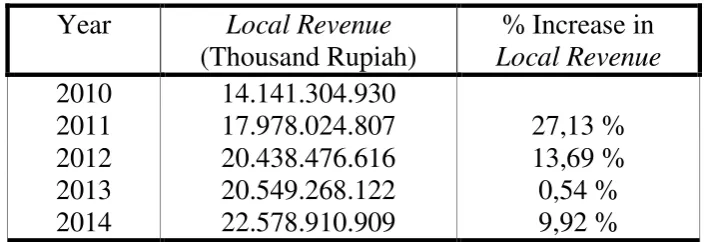
Table 1.2
Local Revenue for Districts/Cities in Riau Province Years 2010-2014
Year
Local Revenue
(Thousand Rupiah)
% Increase in
Local Revenue
2010
14.141.304.930
2011
17.978.024.807
27,13 %
2012
20.438.476.616
13,69 %
2013
20.549.268.122
0,54 %
2014
22.578.910.909
9,92 %
Source: BPS Riau Province, Processed
So, we can in this table that Local Revenue has increased every year. In 2011
has increased by 27.13%. In 2012 has increased by 13.69%. 2013 increased by
0.54% and in 2014 increased by 9.92%.
And Author interested to analyze the effect of macro variables to Local
Revenue (PAD) in the province of Riau. The reason is the author examines in the
district / city Riau province because there are 12 districts / cities in Riau Province,
where the population is scattered in almost all districts / cities, with an income of
each region varies. Thus, the government can manage and optimize the area fairly
and equally, both in terms of development, public welfare, and other facilities that
support the advancement of the region. Local governments also do not need to
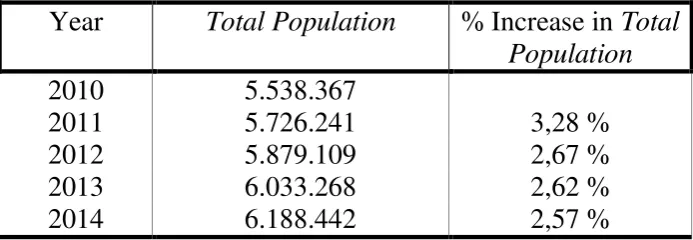
Table 1.3
Total Population in Riau Province in 2010-2014
Year
Total Population
% Increase in
Total
Population
2010
5.538.367
2011
5.726.241
3,28 %
2012
5.879.109
2,67 %
2013
6.033.268
2,62 %
2014
6.188.442
2,57 %
Source: BPS Riau Province, processed
In this table it can be seen that the number of people in Riau province has
increased every year. In 2011 the total population increased by 3.28% in 2012
increased again to 2.67% in 2013 and 2014 still increased by 2.62% and 2.57%.
Table 1.4
Government Spending of Districts/Cities in Riau Province 2010-2014
Year
Government Spending
(Thousand Rupiah)
% Increase in
Government Spending
2010
18.051.491.048
2011
21.286.863.983
15,20 %
2012
25.427.002.061
19,45 %
2013
26.908.947.932
5,83 %
2014
27.640.093.785
2,72 %
Source: BPS Riau Province, Processed
In this table, it can be seen also that government spending has increased in
accordance with the needs of the year 2011 to the year 2014 amounted to 15.20%
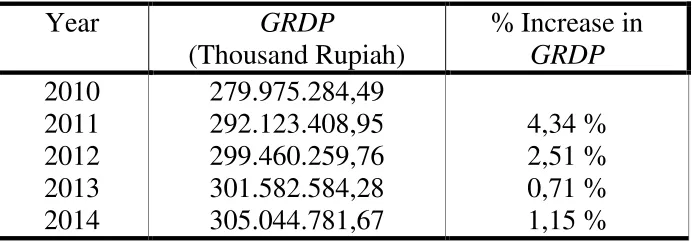
Table 1.5
Riau Province on The Basis of Gross Regional Domestic Product (GRDP)
Series 2010 at Constant Market Prices By Category Including Oil and Gas in 2010-2014
Year
GRDP
(Thousand Rupiah)
% Increase in
GRDP
2010
279.975.284,49
2011
292.123.408,95
4,34 %
2012
299.460.259,76
2,51 %
2013
301.582.584,28
0,71 %
2014
305.044.781,67
1,15 %
Source: BPS Riau Province, processed
GRDP in the table can also be seen an increase every year, Riau Province in
2011 GRDP increased by 4.34%, 2.51% in 2012, the year 2013 amounted to
0.71% and in 2014 increased by 1.15%.
From the tables above it can be seen that the factors of macro variables
showed an increase in each year, both of the Total Population, Government
Spending and Gross Regional Domestic Product (GRDP). However, the size of
Local Revenue (PAD) was influenced by economic growth. Therefore, the authors
are interested in researching related to macro variables (Total Population,
Government Spending and GRDP) that affect Local Revenue (PAD) in the
districts/cities in Riau Province and pour results on this study entitled
"ANALYSIS OF TOTAL POPULATION, GOVERNMENT SPENDING
AND REGIONAL GROSS DOMESTIC PRODUCT (GRDP) INFLUENCE
TOWARDS LOCAL REVEANUE (PAD)” (Case Study in Districts/Cities in
B. Limitations Research
The scope of this study is to analyze the influence of Total Population,
Government Spending and GRDP in the districts/cities Riau Province from 2010
to 2014 period. Variables used in this research are the Total Population,
Government Spending and Gross Regional Domestic Product at constant prices
was obtained from the Central Statistics Agency of Riau Province.
C. Problem Formulation Research
Economic potential can be seen from several macro variables include Total
Population, Government Spending and GRDP. While the local financial capacity
seen from the success of local governments to dig source of revenue, especially
from Local Revenue (PAD).
Based on the above, the formulation of the problem in this research is how the
influence of Total Population, Government Expenditure and GRDP to revenue
(PAD) with the following details:
1. Is Total Population significant effect on Local Revenue (PAD) in Riau
Province 2010-2014
2. Is Government Spending a significant effect on Local Revenue (PAD) in
Riau Province 2010-2014
3. Is Gross Regional Domestic Product (GRDP) significant effect on Local
D. Research Purposes
1. To analyze the effect of Total Population towards Local Revenue (PAD)
in the districts/cities Riau Province on 2010-2014.
2. To analyze the effect of Government Spending towards Local Revenue
(PAD) in the districts/cities Riau Province on 2010-2014.
3. To analyze the effect of Gross Regional Domestic Product (GRDP)
towards Local Revenue in the districts/cities Riau Province on 2010-2014.
E. Benefits of Research
1. As a comparison and reference for professors / lecturers to explain the
influence of Total Population, Government Spending and Gross Regional
Domestic Product (GRDP) of the Local Revenue (PAD).
2. As a reference in future studies, as well as enrich the research on Local
Revenue (PAD).
3. As consideration for the local government in analyzing the influence of
Total Population, Government Spending and Gross Regional Domestic
13 1. The Concept of Local Revenue
According to the study (K, 2012) explained that the Local Revenue (PAD)
is based on article 157 paragraph a of Law Number 32 Year 2004 on Central
Government suggests that local governments in taking care of their own
household needs to be given the sources of income or receipts of local finance
for finance all activities within the framework of the implementation of the
tasks of administration and development for the welfare of society as a fair
and equitable, that component is derived from the results of local taxes, levies
Results, wealth management area results that are separated and Other Local
Revenue results are valid. The fourth component of Local Revenue is also the
financial resources of the region; therefore, the original income is one
component of local financial resources. Local Revenue sources are part of
regional financial levied under the laws and regulations in the area.
Local Revenue importance as a source of local finance, autonomous
regions must have the finances and ability to dig up the financial resources of
its own, manage and use their own finances are sufficient to finance the
implementation of a local authority. Dependence on central assistance should
be as minimal as possible so that the Local Revenue should become part of the
financial balance as a fundamental prerequisite in the system of administration
of the State (Koswara, 1999: 23) in (K, 2012).
Sources of local revenue derived from: Local Taxes, Levies local, regional
wealth management results were separated, Other Local Revenue legitimate.
While, The Fund Balance is consists of DBH, General Allocation Fund, and
the Special Allocation Fund (Safitri, 2009) in (Atmaja, 2011).
2. Sources of Regional Income
Law Number 32 Year 2004 on Regional Government hinted that the local
government in taking care of their own households is given the sources of
income or financial reception area is to finance all the activities in the
framework of the implementation of the tasks of government and development
for the welfare of society as a fair and prosperous.
a. Local Revenue (PAD)
With Local Revenue, it can be used as an important indicator to assess
the degree of independence of Local Government in the field of finance.
As for the sources of Local Revenue (PAD) consisting of:
1) Results of Local Taxes
Local Tax is one of the key elements that have contributed greatly
to the Local Revenue (PAD). Definition taxes are dues of the people to
the state treasury, the shift of wealth (from the sector private to the
of reciprocity which can be directly appointed and is also used for
general expenses (Soemitro, 1965: 19) in (Kusumastuti, 2002).
In Munawir (1990) some experts also provide an understanding of
different, but still in the same meaning and purpose of the tax, some
definitions are:
a) According to Soemitro, tax is people’s payment due to the state
treasury (the transition of wealth from the private sector to
government sector) by the legislation (Enforceable) without
getting the service of lead (Tegen Prestatie) which directly
appointed and used to finance the general expenses. In other
words, the tax is a wealth of transition from people to state
treasury, to finance the regular expenses and it surplus can be
used for public saving which is a main source to finance the
public investment.
b) According to Soemamidjaja, tax is obligatory contribution in
the form of money or goods levied by the authorities based on
the norms of law, in order to cover the cost of production of
goods and services collectively to achieve common prosperity.
c) According to Djajadiningrat, tax is an obligation to give up
some of the wealth to the state caused by a state, events and
actions that give a certain position but not as punishment,
enforced, but there is no merit forth from the country directly to
maintain the general welfare.
In Law No. 34 of 2000 on the amendment of Law No. 18 of 1997
on Local Taxes and Levies Article 1 (6) is a local tax, hereinafter
called the tax is obligatory contribution made by an individual or entity
to areas without direct payment are balanced, which can be imposed by
legislation that applies, which is used to finance the implementation of
local government and regional development.
According to Law No. 28 Year 2009 on Regional Taxes and Levies
in Article 1 (10) is a local tax, hereinafter called the tax is a mandatory
contribution to the regions that are owed by individuals or entities that
are enforceable under the Act, by not getting the rewards directly and
used to the area for the purposes of the overall prosperity of the people.
Local tax based on the level of local government, local taxes and
local taxes Provincial District / City level. In accordance with Act No.
28 Year 2009 concerning on Regional Taxes and Levies, the types of
taxes are (Frediyanto, 2010):
a) Regional Tax Level I (province), consisting of:
(1) The vehicles tax and the vehicles fuel tax, tax collection
and utilization of underground and surface water.
(2) Taxes of vehicle title transfer fee and Customs of Vehicle.
(3) Taxes of materials motor vehicle fuel.
(5) Cigarette taxes.
b) Regional Tax Level II (district/city), consisting of:
(1) Hotel Taxes
(2) Restaurant Taxes
(3) Entertainment Taxes
(4) Advertisement Taxes
(5) Street Lighting Taxes
(6) Collection Excavated Material Taxes class
(7) Parking Taxes
2) Results of Levies
The sources of income other important areas are levies. Levies are
dominated for a reception area. Based on Law No. 34 of 2000 which
meant the levies are local taxes as payment for services or certain
special permits provided and / or provided by local governments for
the benefit of the individual or entity (Datu K, 2012).
Prakosa (in Atmaja, 2011) said that the Levies are local taxes as
payment for services or granting certain permissions are specifically
provided or granted by the regional government for the benefit of
private persons aau body, so that it can be concluded that the levies are
retribution levied because of the existence of a fringe benefits provided
by local governments levy collector.
From the definition of the levy it can be argued that some of the
collected by the state in this regard that all local revenue collection
areas of public revenue, Second; in the collection there are economics.
And Third coercion; Levies imposed on any person / entity who uses
the services were prepared countries (Datu, 2012).
Frediyanto (2010) The types of levies according to Law No. 28 of
2009 can be grouped into three (3) categories, namely general service
levies, fees and charges licensing of certain services.:
a) Public service levies that services provided or given to local
government interests and public benefit purpose and can be
enjoyed by private persons or entities. Common types of levies are:
(1) Health Care Levies
(2) Service Fees Waste / Hygiene Levies
(3) Reimbursement Identity Card and Civil Certificate Levies
(4) Funeral Service Fees and Aching Corps Levies
(5) General Services of Roadside Parking Levies
(6) Levy of Market Services
(7) Levy of Vehicle Testing
(8) Levy Inspection of Fire Extinguishers
(9) Replacement Levy of Reprinting Maps
(10) Retribution Supply / Suction Latrine
(11) liquid waste management levies
(12) Levy of Educational Services
b) Business service levies are local taxes as payment for services
supplied a special effort and / or provided by local governments for
the benefit of private persons or entities. Types of charges for
services such as:
(1) Retribution of a Wealth Usage Area
(2) Retribution of Wholesale Markets/Shopping
(3) Retribution of Auctions
(4) Retribution of Terminal Charges
(5) Retribution of Special Place for Parking
(6) Retribution of Venues, Home stays and Villas
(7) Retribution of Slaughterhouses
(8) Retribution of Port Services
(9) Retribution of Recreation Places and Sport Areas
(10) Retribution of Water Crossings
(11) Retribution of Sales Business Production Area
c) Licensing Certain Levies are local taxes as payment for the
provision of certain special permission granted by the local
government for the benefit of private persons or entities. Licensing
levy certain types namely:
(1) Retribution of Building Permits
(2) Retribution Sale of Alcoholic Beverages
(3) Retribution of Nuisance Permits
(5) Retribution of Fishery Business License
Levies are more relevant than the tax on short-term interests.
This is based on the relationship it directly to the public. Society
will not pay if the quality and quantity of public services is not an
increase.
3) Results of Regional Wealth Management Separated
To meet the financing needs of household’s relatively large area,
then the area is also provided sources of income in the form of wealth
management outcomes separated areas in accordance with the Act
No.32 of 2004. The management of that wealth comes from a local
company established under Law Invite the whole or a part of capital
riches separated areas (Datu, 2012).
Local Company category is divided into two, namely: First; PAD
Company which is a company incorporated enumerated by the region
itself. Second; Companies from the area supervisor. The purpose of
forming a local company is to donate the local economy and increase
the income of the area. BUMD business field covers various aspects of
the service by prioritizing the provision of services to the community,
organizing public services and contribute to the economy of the whole
region should be implemented based on the principles of sound
corporate economy (Financial Notes Proposed Budget 1995/1996 in
Local Company or local government position is very important and
strategic as one of the institutions belonging to the area in increasing
acceptance of PAD. Regional governments could also undertake
efforts to increase revenue by optimizing the role of enterprises that
are expected to function as a primary driver. This type of income
includes the following income:
a) Equity in net earnings of companies owned by regional
b) Section profit financial institution bank
c) Equity in net earnings of non-bank financial institutions
d) The share in income on the statement of capital / investment.
4) Others Local Revenue (PAD) Lawful
These revenues are derived from the reception area outside of taxes
and levies or other legitimate local government-owned and supplied to
allocate reception area. According to Law No. 33 of 2004 explains the
original Revenue Regional legitimate, provided for budgeted reception
area is not included in these types of local taxes, and wealth
management outcomes separated areas.
According to Datu Indra K, this revenue type includes objects as
follows:
a) Proceeds from sales of regional assets that are not separated
b) Acceptance Gyro services
d) Fine delay in the execution of work
e) Receipts for compensation for damage / loss of regional assets
(Datu K, 2012).
a) Balance Fund
According to Law No. 33 In 2004, the Balance Funds are funds from
the state budget allocated to the regions to fund the needs of the region in
implementing of decentralization. Balance Funds consists of
revenue-sharing, allocation of funds General and Special Allocation Fund
(Feriyanto,2010).
1) Revenue-Sharing Fund
Revenue-Sharing (DBH) is a fund sourced from APBN allocated to
the regions with the potential of producing area noticed a certain
percentage to fund the needs of the region in the implementation of
decentralization. DBH include:
a) Tax revenues, which are comprised of: land and building tax
(PBB), fees for acquisition of land and buildings (BPHTB), the
personal income tax.
b) Acceptance of Non-Tax (SDA), which consists of: forestry,
2)
General Allocation FundFunds sourced from APBN allocated to bring equality among the
regions financial ability to finance expenditure in the framework of
decentralization. General Allocation Fund (DAU) an area allocated on
the basis of fiscal gap and basic allocation. General Allocation Fund
(DAU) allocation for regional fiscal potential is great but small fiscal
needs would acquire relatively lower allocation. Conversely, a small
area of fiscal potential, but needs a large fiscal will receive a relatively
higher General Allocation Fund (DAU).
General Allocation Funds granted to all counties and cities for the
purpose of filling the gap between capacity and fiscal needs, and is
distributed by a formula based on certain principles which generally
indicates that the poor and underdeveloped regions must receive more
than richer regions. In other words, an important goal DAU allocation
is to ensure equal distribution of public service delivery capabilities
between the Local Government (Atmaja, 2011).
3)
Special Allocation FundSpecial Allocation Funds allocated to help finance certain needs,
which is a national program or activity which does not exist in other
area. In other words, DAK is intended to help finance specific
activities certain areas that are regional affairs and in accordance with
national priorities. Infrastructure is the basic services that society has
region. DAK also come from the state budget and allocated to the
district / city to finance the specific needs of particular importance,
depending on the availability of funds from the state budget (Atmaja,
2011).
3. The Relations between Total Population and Local Revenue (PAD)
The Total population is essential to economic development is the driving
force and executive in the economy as well as the workforce. Residents of an
area can be seen from the positive and negative sides. The positive side where
a large population can encourage the development itself, therefore the
population factor is very important in the development plan, so that
development be realistic. In the other hand, the negative impact of the
population is the growing number of social and economic services to fulfill the
rights of those whose numbers increase.
The Total Population is one of the deciding factors in income between
regions. The addition of a population is an important element in stimulating
economic growth and development. Large population is an asset for national
development, but also a burden. Be an asset if it can increase national
production. And become a burden if the quality, structure and distribution do
not fit to become a burden on the working population effectively. Adam Smith
(Santoso and Rahayu 2005 in Atmaja, 2011) Explaining that, supported by
empirical evidence, a high population growth will be able to raise output by
4. The Relations between Government Spending and Local Revenue
(PAD)
Implementation of a regional development program requires the
participation of all elements of society. Local government's role is as a
facilitator would require the support of factors including the budget. Those
spending are partially used as other partial development funding for local
infrastructure development. The spending increase aggregate spending and
economic activity levels. Infrastructure development and provision of various
facilities made to increase the attractiveness of the investment. Given adequate
public service facilities will stimulate people to be more active in their work
so that the productivity of the community and local investment be increased,
which will result in an increase in Local Revenue.
According to Wong in (K, 2012), infrastructure development have an
impact on local tax increases. Taxes and charges are components of PAD in
increasing the added value obtained from optimal growing industry sector.
The industrial sector came from capital expenditures. Capital expenditures are
capital expenditures including land, capital expenditure buildings, roads and
bridges capital expenditures, capital expenditures generation tools, capital
expenditures heavy equipment and other capital expenditures.
5. The Relations between Gross Regional Domestic Product and Local
Revenue (PAD)
The relationship between GRDP with Local Revenue (PAD) is a
function of GRDP. The increase that occurred in GRDP effect on increasing
the amount of revenue local governments in implementing development
programs that will increase local government services to the public so that also
increase the productivity of the region. With increasing government revenues
will boost public services in hopes of improving productivity levels of society
so that economic growth again increased, including the level of income per
capita which is ultimately encourage people in the community's ability to pay
taxes and other levies.
B. Previous Studies
Several studies have been conducted with a discussion of the analysis of the
factors that affect Local Revenue in the districts/cities of Riau province is as
follows:
1. Pahala Bellarminus Lumban Tobing in 2015 conducted a study entitled
Analisis Pengaruh Jumlah Pekerja, Pengeluaran Pemerintah dan Produk
Domestik Regional Bruto terhadap Pendapatan Asli Daerah tahun
1999-2013 : Studi pada Malang Raya. The analytical method used is the Panel
Data with multiple linear regression analysis. The results of the study
explained that government spending in the form of direct spending is
effective, in improving the Local Revenue. The development of
infrastructure such as roads, education and improvement of Human
Resource, which is part of the direct expenditure, is very important in
Product, showing its influence in the improvement of Local Revenue. The
more number of GRDP will effect to increasing the Total of Local
Revenue. Because GRDP is an indicator of economic growth. And on the
side of Population showed less effective in improving the Local Revenue,
because the more number of working people is not necessarily effect to
increase the Local Revenue.
2. In Indra Rindu Datu K. research on 2012 entitled Analisis Faktor yang
Mempengaruhi Pendapatan Asli Daerah (PAD) di Makassar tahun
1999-2009 by using multiple regression analysis method 2 SLS, explained that
the realization of the development of the Local Revenue in Makassar
continue to increase. From the empirical results that show that government
spending was positive and significant impact towards Local Revenue, as
well as the GRDP of Makassar was positive and significant impact
towards Local Revenue. This is because the balance that occurs in
government spending to improve infrastructure and infrastructure that
support an increase in the Local Revenue.
3. Eni Aryanti and Iin Indarti do research entitled Pengaruh Variable Makro
terhadap Pendapatan Asli Daerah periode 2000-2009 di Kota Semarang.
The method used in this research is Multiple Linear Regression Analysis,
with the result that the Macro variables used in the form of the GRDP and
inflation shows that the GRDP variable was positive influence towards
Local Revenue in Semarang and variable inflation does not affect the
consideration of amendments such as tariffs by setting the tax rates and
levies that are flat, although the tax rate and levy are set high or low it is
not striving towards acceptance of the original income Semarang. Because
the rate of inflation just as useful as consideration rates change. This
condition causes the inflation variable that should negatively affect to the
acceptance of the Local Revenue, became influential in the city of
Semarang.
4. Arief Eka Atmaja in his research on 2011 conducted a study entitled
Analisis Faktor-Faktor yang Mempengaruhi Pendapatan Asli Daerah
(PAD) Di Kota Semarang. The method used was Ordinary Least Square
(OLS). From the results of his research explained that the variables used is
Regional Spending, population and the GRDP summed together these
variables affect the Local Revenue. Individually, the variables such
Regional Spending , Total Population and the GRDP may influence Local
Revenue, which has the greatest influence on Local Revenue in Semarang
is Total Population. This is evidenced by the highest regression coefficient
5,742.
5. Diyah Kusrini in 2015 conducted a study entitled Analisis Pengaruh
Belanja Langsung, Produk Domestik Regional Bruto dan Jumlah
Penduduk Terhadap Pendapatan Asli Daerah (Studi Kasus
Sekabupaten/Kota di Provinsi Sumatera Selatan tahun 2010-2014). The
model used in this study is the Panel Data Regression. The results of this
significant and positive effect towards Local Revenue. This indicates that
the respective district/city in South Sumatra took a positive policy in the
development potential and attractiveness of the area by doing physical
development. Gross Regional Domestic Product Also has a positive and
significant effect to the Local Revenue. This happens because the
movement of GRDP is dominated by primary and tertiary sectors. While,
[image:46.595.31.555.343.741.2]North Sumatera Province is rich in Natural Resource.
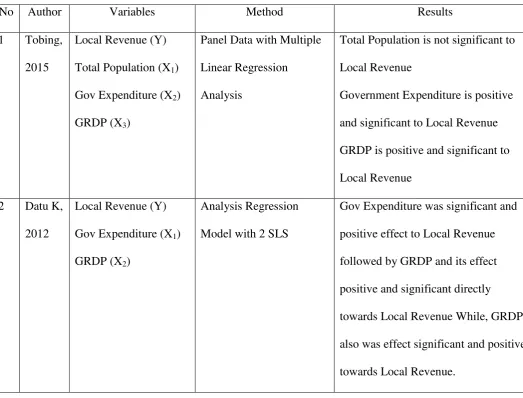
Table 2.1 Previous Studies
No Author Variables Method Results
1 Tobing,
2015
Local Revenue (Y)
Total Population (X1)
Gov Expenditure (X2)
GRDP (X3)
Panel Data with Multiple
Linear Regression
Analysis
Total Population is not significant to
Local Revenue
Government Expenditure is positive
and significant to Local Revenue
GRDP is positive and significant to
Local Revenue
2 Datu K,
2012
Local Revenue (Y)
Gov Expenditure (X1)
GRDP (X2)
Analysis Regression
Model with 2 SLS
Gov Expenditure was significant and
positive effect to Local Revenue
followed by GRDP and its effect
positive and significant directly
towards Local Revenue While, GRDP
also was effect significant and positive
3 Aryanti
and
Indarti,
tt
Local Revenue (Y)
GRDP (X1)
Inflation (X2)
Analisis Regresi Linear
Berganda
GRDP was effected the increasing of
Local Revenue positively.
Inflation was not effect to the
increasing of Local Revenue.
4 Atmaja,
2011
Local Revenue (Y)
Local Expenditure (X1)
Total Population (X2)
GRDP (X3)
Ordinary Least Square
(OLS)
For all variables were effected towards
Local Revenue.
As individually, Total Population was
having a great effect to Local Revenue.
5 Kusrini,
2015
Local Revenue (Y)
GRDP (X1)
Direct Expenditure of
Local Government (X2)
Total Population (X3)
Panel Data Model GRDP has effect significantly to the
increasing Local Revenue.
The growth value of Direct
Expenditure of Local Government was
affected significantly.
Total Population was not affecting to
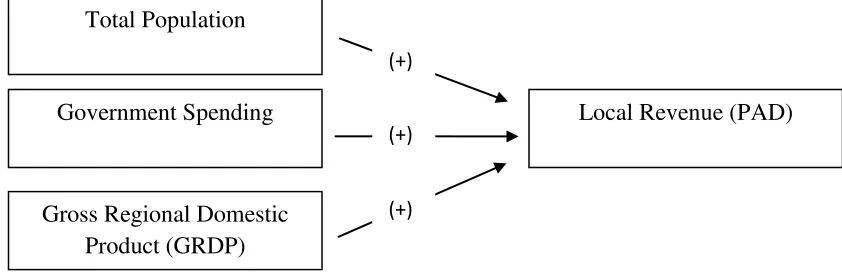
C. Framework
The Tests associated with the development of macro variables, such Total
Population, Government Spending and Gross Regional Domestic Product (GRDP)
that have a functional relationship with the Local Revenue (PAD). In this study,
the framework of reasoning as follows:
FIGURE 2.1
Scheme of Framework
D. Hypothesis
The hypothesis to be tested on the macro variables in this study are:
1. Presumablythe positive influencebetween Total Populationtowards Local
Revenue (PAD).
2. Presumably the positive influence between Government Spending towards
Local Revenue (PAD).
3. Presumably the positive influence between Gross Regional Domestic
Product (GRDP) towards Local Revenue (PAD). Total Population
Gross Regional Domestic Product (GRDP)
Local Revenue (PAD)
(+)
(+)
(+)
[image:48.595.111.532.261.397.2]32 A. Object / Subject of Research
This study is aimed at districts / cities in Riau Province. Pekanbaru municipal
elections as the study area due to facilitate the collection of data, in addition
Pekanbaru is the capital of Riau province.
B. Types and Sources of Data
The data used in this study are primary and secondary quantitative method
which is the time series data from 2010-2014. About the Local Revenue (PAD),
Total Population, Government Spending and Gross Regional Domestic Product
(GRDP) is obtained from the Office of the Department of Revenue, the Central
Statistics Agency (BPS) Riau, literature-literature / books and reports related to
this writing.
C. Data Collecting Technique
Data collecting was done in this study by way author proposes permit research
to agencies associated with this author in a study area, after being given
permission research and obtain the data required, and then the data will be
processed and used as materials analysis to prove the hypothesis that has been put
D. The Variables Operational Definition of Research
In this study consisted of the dependent variable [Y] is Local Revenue (PAD)
of Riau Province, Independent Variables [X1] is Total Population, [X2]
Government Spending, and [X3] Gross Regional Domestic Product (GRDP) of
Riau Province.
Local Revenue (PAD) is a source of local revenue derived from the results of
local taxes, levies result, the results of companies belonging to the region and
other areas of wealth management results were separated and others Local
Revenue (PAD) legitimate in Riau Province. Unit in thousand rupiah, data is
taken from the Central Bureau of Statistics Riau Province 2010-2014.
Total Population is the number of people living in the province of Riau. Data
is taken from the Central Statistics Agency of Riau Province 2010-2014.
Government Spending is the expenditure including the government sector and
purchases of goods and services used for the payment of subsidies which
implements the functions of government. Government expenditure data is taken
from the Central Statistics Agency of Riau Province 2010-2014.
Gross Regional Domestic Product (GRDP) is the total value of production of
goods and services produced in the region (regional) within a certain specified
time (one year) in the province of Riau. Data is taken from the Central Statistics
E. Analysis Method
Data analysis technique used quantitative approach which quantitatively
explains the object of study is based on facts and data. Then, analyze descriptively
to answer the problem of research. This approach is expected to explain the
condition of the object under study to look at the Total Population, Government
Spending in the form of direct and indirect spending and Gross Regional
Domestic Product at constant prices of the Local Revenue in districts/cities in
Riau Province.
This study uses panel data. Panel data regression is used to answer the purpose
of this study is to determine whether the number of Total Populations,
Government Spending and Gross Regional Domestic Product affect Local
Revenue in districts/cities in Riau Province. Panel data is a combination of time
series data (time series) and data cross (cross section). There are several
advantages of using panel data in economic research. According to Gujarati
(2010) in (Tobing, 2015), the advantage of using panel data is as follows:
1. Data Panel is able to accommodate the level of heterogeneity of the
variables that are not included in the model.
2. Data Panel able to indicated and measured the effect is the same and
cannot be obtained with a simple cross section pure or pure time series.
3. Data Panel was able to reduce co linearity between variables.
4. Data Panel can test and build more complex behavioral models.
5. Data Panel can minimize bias generated by individual regression because
The data used in this panel data is a combination of cross section data and
time series. Time series data used are annual data for 5 years from 2010 to 2014,
and the cross section consists of 12 districts/cities in Riau Province which consists
of Kuantan Singingi, Indragiri Hulu, Indragiri Hilir, Pelalawan, Siak, Kampar,
Rokan Hulu, Rokan Hilir, Meranti Islands, Pekanbaru, Dumai.
Panel Regression models are as follows:
Y= α + b1 X1 + b2 X2 + b3 X3 + e
Where:
Y= Dependent Variable (LDR) α = Constants
X1= 1st Independent Variable X2= 2nd Independent Variable X3= 3rd Independent Variable
b{1,2,3} = Regression Coefficient of each Independent Variable e = Error term
In the regression model estimation method using panel data can be performed
through three approaches:
a. Common Effect Models
Panel data model approach is the simplest because only combines the data
time series and cross section. In this model neglected dimension of time as
well as individuals, so it is assumed that the behavior of corporate data
together in different periods. This method can use the approach Ordinary
Least Square (OLS) or a least squares technique for estimating panel data
model.
The regression equations in the model Common Effect can be written as
Y
it= α + X
itβ + ε
itWhere:
i = Kuantan Singingi, Indragiri Hulu,…. Dumai t = 2010, 2011, 2012, 2013, 20214
Where i indicate the cross section (people) and t is the time period.
Assuming the error component in the processing of ordinary least squares,
estimation process separately for each unit cross section can be done.
b. Fixed Effect Models
This model estimates that the differences between individuals can be
accommodated on the difference intercept. To estimate the Fixed Effects panel
data models using the technique of dummy variables to capture the difference
between the company's intercept, the intercept differences can occur due to
differences in the work culture, managerial, and incentives. Nevertheless, it
slopes equally between the companies. The estimation model is often called
the Least Squares Dummy Variable technique (LSDV).
In the Fixed Effects models, each individual is an unknown parameter and
estimated by using dummy variables as follows:
Yit= α + iα + X’itβ + εit
[ ] = [ ] + [
][ ] + [
] [ ] + [ ]
These techniques are called Least Square Dummy Variable (LSDV). In
accommodate a systemic effect. This can be done through the addition of a
dummy variable in the model.
c. Random Effect Model
This model will estimate the panel data where possible disturbance
variables are interconnected across time and between individuals. In the
Random Effects Model intercept differences are accommodated by the error
terms of each company. The advantages of using a model are remove
heteroscedasticity of Random Effect. This model is also called the Random
Error Component Model (ECM) or technique Generalized Least Square
(GLS).
Random Effects Model equation can be written as follows:
Y
it= α + X’
itβ +
w
iti = Kuantan Singingi, Indragiri Hulu,…. Dumai t = 2010, 2011, 2012, 2013, 2014
Where:
wit =
ε
it + u1; E(wit) = 0; E(wit2) = α2+ αu2;E(wit’ wjt-1) = 0;1 ≠ j; E(ui’
ε
it) = 0;
E(εi’εis)= E(εit’εjt)= E(εit’εjs)= 0.
Although, the error components of wt are homoscedastic, in fact, there is a
correlation between the wt and wit-s (equicorrelation), namely:
Corr(w
it’w
i(t-1)) = α
u2
/ (α
2+ α
u2
)
Therefore, the OLS method cannot be used to obtain an efficient estimator
effects models is the Generalized Least Squares (GLS) assuming
homocedastic and no cross sectional correlation.
F. Selection of Model
For the selection of the right model to manage the data panel, can be tested as
follows:
1. Chow Test
Chow test is a test to determine the model Fixed Effect or Random Effect
most appropriately used in estimating panel data.
2. Hausman Test
Hausman test is a statistical test to select whether the model Fixed Effect
or Random Effect most appropriately used.
3. Lagrange Multiplier Test
To determine whether Random Effect Model is better than Common
Effect Method (OLS), test was used Lagrange Multiplier (LM).
After obtaining the right model, the regression results of the model is to prove
the hypothesis the presence or absence of significant influence then tested the
significance of the t test and F test. Inthe test specification models in the study,
the authors used several methods:
a. Chow Test
Chow Test is a test to determine the model Fixed Effect or Random Effect
most appropriately used in estimating panel data. The hypothesis of the Chow
H0: Common Effect Model or pooled OLS
H1: Fixed Effect Model
Basic rejection of the above hypothesis is by comparing the calculation of
the F-statistic with F-table. Comparison is used if the results of the F count is
greater (>) of F table then H0 rejected, which means the most appropriate
model used is the Fixed Effects Model. Vice versa, if F count is smaller (<) of
F table then H0 is accepted and the model used is Common Effect Model
(Widarjono in Basuki and Yuliadi, 2015).
Calculation of F statistics obtained in Chow Test formula (Baltagi in
Basuki and Yuliadi, 2015):
Where:
SSE1: Sum Square Error from Common Effect Model
SSE2: Sum Square Error from model Fixed Effect
n : Number of Companies (Cross Section)
nt : Number of cross section x Number of time series k : Number of Independent Variables
While F table obtained from
Where:
α: The Significance level used (Alfa)
n: Number of Companies (cross section)
nt: Number of cross section x Number of time series
k: Number of Independent Variables
b. Hausman Test
After completing the Chow test and obtained the right model is Fixed
Effect, then the next we will examine which model among models Fixed
Effect or Random Effect most a
ppropriate, this test is referred to as Hausman test.
Hausman test can be defined as statistical tests to select whether the model
Fixed Effect or Random Effect most appropriately used. Tests conducted by
the Hausman test the following hypotheses:
H0: Random Effect Model
H1: Fixed Effect Model
Hausman Test will follow the distribution of Chi-squares as follows:
m =
̂ ̂ ̂
Hausman test statistic follows the Chi Square statistic distribution with a
degree of freedom as much as k, where k is the number of independent
variables. If the value of the Hausman statistic is greater than the critical
value, H0 is rejected and the right model is a model Fixed Effect while
conversely if Hausman statistic value is smaller than the critical value, the