QUALITY PERFORMANCE OF INDONESIA FROZEN
DESSERT (
ES PUTER
) ENRICHED WITH FERMENTED
BLACK GLUTINOUS RICE (
Oryza sativa glutinosa
L.) AND
GREEN TEA (
Camellia sinensis
L.)
SARIDA WARDANI
DEPARTEMENT OF FOOD SCIENCE AND TECHNOLOGY
FACULTY OF AGRICULTURAL ENGINEERING AND TECHNOLOGY BOGOR AGRICULTURAL UNIVERSITY
STATEMENT LETTER OF MANUSCRIPT AND SOURCES OF
INFORMATION*
Hereby I genuinely stated that the manuscript entitled Quality Performance
of Indonesia Frozen Dessert (Es Puter) Enriched with Fermented Black Glutinous Rice (Oryza sativa glutinosa L.) and Green Tea (Camellia sinensis
L.)is an authentic work of mine under supervision of academic counselor and never
being presented in any forms and universities. All the information taken and quoted from published or unpublished works of the writers has been mentioned in texts and attached in the bibliography at the end of this manuscript.
Hereby I bestow the copyright of my manuscript to the Bogor Agricultural University and Mae Fah Luang University.
Bogor, Mei 2014
Sarida Wardani
ABSTRACT
SARIDA WARDANI. Quality Performance of Indonesia Frozen Dessert (Es Puter) Enriched with Fermented Black Glutinous Rice (Oryza sativa glutinosa L.) and Green Tea (Camellia sinensis L.). Supervised by ADIL BASUKI AHZA and CHUTAMAT NIWAT.
Fermented black glutinous rice (Oryza sativa glutinosa L.) and green tea (Camellia sinensis L.) contain bioactive compounds including flavonoids and anthocyanins which are potential to enrich es puter as functional food. This study was aimed to find the best formula of es puter enriched by fermented black glutinous rice and green tea. The local variety of fermented black glutinous rice (FBGR) was prepared by steaming it until cooked then fermented by using ragi tape (traditional yeast cake) at 27 oC for 3 days. A completely randomized design experiment was used to study the effects of proportion of FBGR (25, 30, and 35%) and green tea powder (2, 3, and 4%) on the physical and chemical properties of es puter. The results showed that the FBGR had higher total phenolic content (p<0.05), antioxidant activity (p<0.05), and anthocyanin content (p<0.05) than the unfermented black glutinous rice. The best es puter was the 30% FBGR and 4% green tea formula. The physical characteristics of the best es puter were good with the total solid 33.46±0.26%, 7.31±0.10% overrun, 2,794.33±0.58 cP viscosity, and 9.57±0.87 min of melting time. The antioxidant activity (DPPH), phenolic content and anthocyanin content were 1,865.81±161.63 µmol Trolox/100g dry basis, 0.09±0.01 GAE in g/100 g sample and 0.30±0.11 mg/100g sample dry basis, respectively.
Keywords: anthocyanin, fermented black glutinous rice, green tea, phenolic, es puter
Manuscript
submitted as a partial fulfillment of the requirement for degree of
Sarjana Teknologi Pangan
at Departement of Food Science and Technology
QUALITY PERFORMANCE OF INDONESIA FROZEN
DESSERT (
ES PUTER
) ENRICHED WITH FERMENTED
BLACK GLUTINOUS RICE (
Oryza sativa glutinosa
L.) AND
GREEN TEA (
Camellia sinensis
L.)
DEPARTEMENT OF FOOD SCIENCE AND TECHNOLOGY FACULTY OF AGRICULTURAL ENGINEERING AND TECHNOLOGY
BOGOR AGRICULTURAL UNIVERSITY BOGOR
2014
Title : Quality Performance of Indonesia Frozen Dessert (Es Puter) Enriched with Fermented Black Glutinous Rice (Oryza sativa glutinosa L.) and Green Tea (Camellia sinensis L.)
Name : Sarida Wardani Student ID : F24090010
Approved by
Dr. Ir. Adil Basuki Ahza, MS Advisor
Acknowledged by
Dr. Ir. Feri Kusnandar, M.Sc
Head of Departement of Food Science and Technology
PREFACE
Praise to Allah for the mercy, the graciousness, and the guidance throughout
the research and manuscript completion. The research entitled “Quality Performance of Indonesia Frozen Dessert (Es Puter) Enriched with Fermented Black Glutinous Rice (Oryza sativa glutinosa L.) and Green Tea (Camellia sinensis L.)” was carried out in Mae Fah Luang University from June to October 2013.
By completion of this research and manuscript, the author would like to express great appreciation and sincere thanks to my lovely father, mother, sisters and brother, for their endless love, care, and support, my academic advisor Dr. Ir. Adil Basuki Ahza, MS, for his time, correction, input, concern, and all forms of the guidance during study in Bogor Agricultural University, Dr. Chutamat Niwat for her time, advice, support, and knowledge in guiding the author to complete the research in Mae Fah Luang University, my examiners Dr. Nancy Dewi Yuliana, STP, M.Sc and Dr. Puspo Edi Giriwono, STP, M.Agr for their time, correction, input and advice in guiding the author to complete the manuscript, all of staff in Scientific Lab 4 and Scientific Lab 3 for help and kindness, all of staff in Department of Food Science and Technology.
The author would like to sincere thanks to my lovely “The Minis and
friend” Farahski, Afikah, Ichaski, and Ichal for awesome and beautiful friendship, help, and support. The author feels very lucky has you guys. My lovely
“MendadaKatering” crews Farahski and Adski for precious experience for lesson of life during manage MendadaKatering business. AIMS friends Afikah, Bang Ardi, Desi, Olga, Stella, Adul, Jenny, Richard, Chacha, and Anan for friendship, help, and support. My friends Ayasho, Milski, Sobih, Seno, Kyo, Dani, Deva, Reyni, Bang Nanang, and Achay for great friendship, help, and support.
Last but not least, hopefully this manuscript is useful for the readers and gives a real contribution in food science development.
TABLE OF CONTENT
LIST OF TABLE x
LIST OF FIGURE x
LIST OF APPENDIX x
INTRODUCTION 1
Background 2
Objectives 2
RESEACH METHODOLOGY 2
Materials 2
Instruments 2
Experimental Design 2
Method 3
Method of Analysis 3
RESULT AND DISCUSSION 9
Physical quality of es puter 9
Chemical quality of es puter 12
Sensory evaluation 15
Consumer test 16
Proximat analysis 17
CONCLUSION AND RECOMMENDATION 17
Conclusion 17
Recommendation 18
REFERENCES 18
APPENDICES 22
LIST OF TABLE
1 Formulation of es puter 3
2 Overrun, viscosity, melting time, and total solid of es puter 9 3 Determination of three selected es puter formulations based on
overrun, viscosity, and melting time that approach range of physical
quality of commercial es puter 12
4 Antioxidant activity (DPPH), phenolic content, and anthocyanin content of unfermented and fermented black glutinous rice 12 5 Antioxidant activity (DPPH), phenolic content, and anthocyanin
content of es puter 13
6 Characteristics of panelists (n=100) 16
7 Chemical composition of the best formula of es puter 17
LIST OF FIGURE
1 Hedonic result of three selected formulations of es puter 15 2 The best formula of es puter (4% of green tea powder and 30% of
FBGR with the total solid 33.46±0.26%, 7.31±0.10% overrun, 2,794.33±0.58 cP viscosity, and 9.57±0.87 min of melting time) 15 3 Preference test result of the best formula of es puter 16 4 (a) Degree of acceptance and (b) willingness to buy the best formula
of es puter 17
LIST OF APPENDIX
1 The flow process diagram of es puter preparation 22 2 Materials that used to make fermented black glutinous rice 23
3 Materials that used to make es puter 23
4 Moisture content of fermented and unfermented black glutinous rice 24
5 Total solid of es puter 25
6 Percent overrun of es puter 26
7 Viscosity of es puter 27
8 Melting time of es puter 28
9 Preparation of standard solution 29
10 Total phenolic content standard curve of unfermented, fermented black glutinous rice and three formulations of es puter 29 11 DPPH standard curve of unfermented, fermented black glutinous rice
and three formulations of es puter 30
12 Result of total phenolic content 31
13 Result of DPPH assay 32
14 Result of anthocyanin content 33
15 Sensory analysis of three selected formulations of es puter 35 16 Sensory analysis score sheet of three selected formulations of es
puter 37
18 Consumer test score sheet of the best formula of es puter 41
19 Statistic of es puter physical analysis 43
20 Statistic of es puter chemical analysis 67
21 The manual calculation of paired samples t-test of unfermented and
fermented black glutinous rice 70
22 Statistic analysis of es puter sensory analysis 73 23 Statistic analysis of es puter consumer test 77
24 Ash content of es puter 78
25 Protein content of es puter 79
26 Fat content of es puter 80
INTRODUCTION
Background
Es puter is one of the favorite traditional frozen desserts in Indonesia. The physical appearance of es puter product is just like an ice cream, but its taste is more like to ice milk or mellorine, i.e. a little bit colder than ice cream in general due to its nature of coarser ice crystals and lower fat content. It is different from ice cream in terms of the raw materials as it uses coconut milk for the main ingredients. Es puter is highly preferable by Indonesian people because it is tasty and has affordable price. It can be consumed in very wide range, from kids to adults. Es puter has a potential to be developed in Thailand as the coconut production is pretty high which is about 1,055,320 ton in 2011 (FAOSTAT, 2011). Es puter can be modified by adding the other ingredients like functional ingredients in order to increase its healthy benefit.
This research is focused on, firstly, utilization of functional compound such as flavonoids and anthocyanins of the black glutinous rice which is commonly grown in Thailand. Vichapong et al. (2010) revealed that varieties of Thai pigmented rice such as black glutinous rice has higher phenolic compound, total flavonoid and antioxidant activity than the normal white staple rice. In addition, the anthocyanin content of black glutinous rice is higher than red rice (Sung Yod), red rice (Mon Poo), red rice (Hom Mali Daeng), purple rice (Hom Nil), and purple rice (Riceberry) (Plaitho, 2012). Anthocyanins are commonly a group of pigments found in pigmented rice such as purple, black and red rice. These compounds have biological property as scavenging free radicals (Wang and Jiao, 2000). Moreover, the fermented black glutinous rice has higher phenolic content, anthocyanin, antioxidant activities, and antimutagenicity (Plaitho, 2012).
2
increased beta – oxidation and thermogenesis. Chu et al. (2010) reported that
green tea “catechins” are among a number of antioxidants such as vitamin C,
vitamin E, lutein, and zeaxanthin thought capable of protecting the eye. Combination of these two products, fermented glutinous rice and green tea, as enricher of the es puter is expected to increase popularity and health benefits of es puter.
Objectives
The objective of this study was to find the best formula of es puter enriched by fermented black glutinous rice and green tea.
RESEARCH METHODOLOGY
Materials
Black glutinous rice was obtained from local market in Chiang Rai, Thailand. A commercial yeast cake starter called “ragi-tape” (Cap Bawang Brand) was bought from local market in Jakarta, Indonesia, coconut milk commercial (AROY-D brand), Sodium Carboxymethyl Cellulose (CMC), Glyceryl-Mono-Stearate (GMS), salt (Aro brand), sugar (Mitr Polt brand), and green tea powder (Wirun Green Tea Powder brand).
Chemical reagents that used in this research were Folin-Ciocalteu’s phenol reagent and H2O2 (Merck, Darmstadt, Germany), anhydrous sodium carbonate
and methanol were purchased from Ajax (Amsterdam, Netherlands), Gallic acid, 2,2-diphenyl-1-picrylhydrazyl (DPPH) and trolox-6-hydroxy-2,5,7,8-tetramethyl-chroman-2-carboxylic acid were purchased from Sigma-Aldrich, Inc. (St. Louis, Mo, USA), potassium chloride buffer pH 1, sodium acetat buffer pH 4.5, hexane, and distillated water. All other chemicals and reagents were of analytical grade.
Instruments
Equipments that used in this research were homogenizer (Model T-18 Basic Ultra-Turrax, IKA, Inc., USA ), home ice cream maker (Model 68330R 4-Quart, Hamilton Beach Brands, Inc., USA), refrigerator and freezer. Some analytical instruments to analyse the es puter products such as Brookfield viscometer (Model RVDVII, Brookfield Engineering Laboratories, Inc., MA, USA), water bath, centrifuge, vortex, spectrophotometer (UV Vis. Biochrom/Libra S22, England), oven, analytical balance, and pH meter.
Experimental Design
3
Method
Fermented black glutinous rice preparation
Black glutinous rice was soaked in water for 12 h, and then steamed at 98
oC for 2 h. The sample was cooled down and then mixed with “ragi-tape” that
previously had been crushed into powder (0.27% w/w of sample) and fermented in plastic bag at room temperature (±27 oC) for 3 days.
Es puter preparation
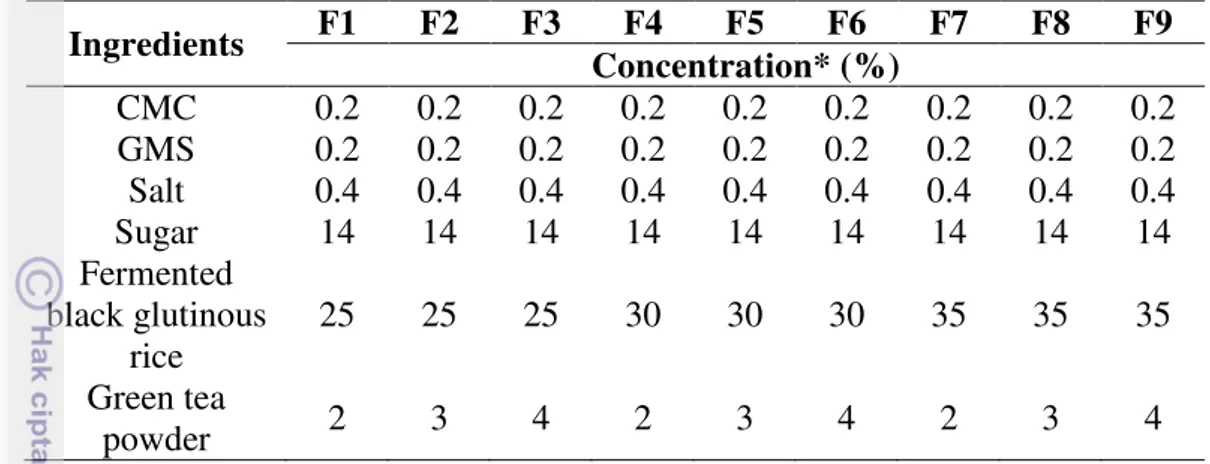
The es puter formulations had this following composition: coconut milk commercial (AROY-D brand) as the basis (8% fat), 0.2% Sodium Carboxymethyl Cellulose (CMC), 0.2% Glyceryl-Mono-Stearate (GMS), 0.4% salt (Aro brand), 14% sugar (Mitr Polt brand), 25% - 35% fermented black glutinous rice, and 2% - 4% green tea powder (Wirun Green Tea Powder brand). The flow process diagram as depicted in Appendix 1.
Method of Analysis
1 Physical quality determination
1.1 Determination of overrun (Marshall et al., 2003)
Overrun was estimated using a standard 100 ml cup. Es puter mix and frozen es puter at 100 ml were weight and overrun was calculated according to the equation:
Overrun (%) = W1W1-W2× Where:
W1= weight of the es puter mix (g) W2= weight of the es puter (g)
Table 1 Formulation of es puter
Ingredients F1 F2 F3 F4 F5 F6 F7 F8 F9
Concentration* (%)
CMC 0.2 0.2 0.2 0.2 0.2 0.2 0.2 0.2 0.2 GMS 0.2 0.2 0.2 0.2 0.2 0.2 0.2 0.2 0.2 Salt 0.4 0.4 0.4 0.4 0.4 0.4 0.4 0.4 0.4
Sugar 14 14 14 14 14 14 14 14 14
Fermented black glutinous
rice
25 25 25 30 30 30 35 35 35
Green tea
powder 2 3 4 2 3 4 2 3 4
4
1.2 Determination of viscosity (Nadeem et al., 2009)
Viscosity measurement was carried out by filled 180 mL es puter mix in cylinder glass (6 cm diameter × 9 cm height). The viscosity readings were taken after aging mix at 4 °C for about 24 hours with a Brookfield viscometer (Model RVDVII, Brookfield Engineering Laboratories, Inc., MA, USA). The viscometer was operated at 20 rpm (spindle number 2).
1.3 Determination of melting time (Clark et al., 2009)
Melting time was determined based on the time required for sample to melt at room temperature (±27 oC) by taking a scoop sample (±5.00 g) and then placing it on a plate.
2 Chemical quality determination
2.1Sample Preparation
2.1.1 Preparation of test sample procedure (es puter) (AOAC 969.20, 2007)
Two or three pieces were selected at random, place in cup of high-speed blender, and close tightly. Let soften at room temperature
and mix (≤7 min). Do not let temperature exceed 12°C at any time
during softening and mixing steps. If the fat separation or "churning" occurs, discard sample and repeat the step with shorter mixing time. Immediately pour mixture into wide-mouth jar and cap tightly.
2.1.2 Lipid removal from es puter (Shumow and Bodor, 2011)
(a) Two grams of each sample was tared in 50 mL disposable centrifuge tube. Recorded the weight of the sample (WSAMPLE). (b)
Then approx. 40 mL hexane (dispenser) was added into the sample and was cap tightly. (c) The sample was mixed until it was completely dispersed (visually checked). (d) It was centrifuged for 5 minutes at 2500 × g. (e) The sample then was carefully decanted and disposed from the hexane phase immediately. (f) The defatting steps (b) to (e) were repeated for one additional time. (g) The cap was removed, allowing the residual solvent to evaporate in an appropriate fume hood until the remaining hexane was evaporated (e.g. overnight).
2.1.3 Sample extraction (unfermented, fermented black glutinous rice, and es puter) (Sutharut and Sudarat, 2012)
5 flask. The residue was again mixed with 3 mL of methanol. All the supernatant obtained from the extractions then were combined in the tube. The tube containing supernatant was adjusted to 10 mL. The extracted solution was kept in 0°C until analysis.
2.2 Determination of DDPH radical scavenging activity (Molyneux, 2004)
50 µl of diluted sample extract was mixed with 1950 µl of 60 µM DPPH solutions. Then, the mixtures were kept in the dark room for 30 minutes and the absorbance was measured at 517 nm using methanol as blank and Trolox as standard. The radical scavenging activity was presented in µmol Trolox/100g dry basis and the assay was carried out in triplicate.
2.3Determination of total phenolic content (ISO 14502-1, 2005)
The total phenolic content was determined using gallic acid as a standard. 1.0 ml of diluted sample extract was transferred into tubes containing 5.0 ml of 10% v/v Folin-Ciocalteu’s reagent. Then, 4.0 ml of 7.5% w/v sodium carbonate solution was added. The mixture was kept at room temperature for 1 h and then measured the absorbance at 765 nm using water as blank. The TPC was expressed as gallic acid equivalents (GAE) in g/100 g sample. The assay was carried out in triplicate.
2.4 Determination of total anthocyanin content (Guisti and Wrolstad, 2001)
The total anthocyanin content (TAC) was determined using the pH-differential method. Anthocyanin pigments underwent reversible structural transformations with a change in pH manifested by strikingly different absorbance spectra. The colored oxonium form predominates at pH 1.0 and the colorless hemiketal form at pH 4.5. The pH-differential method was based on this reaction, and permits accurate and rapid measurement of the total anthocyanins, even in the presence of polymerized degraded pigments and other interfering compounds.
Briefly, 1 mL extracted solution was transferred into 10 mL volumetric flask for preparing two dilutions of the sample. One sample was adjusted for its volume with potassium chloride buffer, pH 1.0, and the other was adjusted with sodium acetate buffer, pH 4.5 to dilute each. Let these dilutions equilibrate for 15 min. Measure the absorbance of each dilution at the 510 and 700 nm (to correct for haze), against a blank cell filled with distilled water. All measurements should be made between 15 min and 1 hr after sample preparation, since longer standing times tend to increase observed readings. Absorbance readings were made against water blanks. The samples to be measured should be clear and contain no haze or sediments; however, some colloidal materials may be suspended in the sample, causing scattering of light and a cloudy appearance (haze). This scattering of light needs to be corrected by reading at a wavelength where no absorbance of the sample occurs, i.e., 700 nm. Calculate the absorbance of the diluted sample (A) as follows:
6
The monomeric anthocyanin pigment concentration in the original sample was calculated by using the following formula:
Monomeric anthocyanin pigment (mg/L) = (A×MW×DF×1000) (ε×1)
and it was converted to mg of total anthocyanin content /100 g sample.
Where MW is the molecular weight, DF is the dilution factor, and ε is the molar absorptivity, calculate pigment content as cyanidin-3-glucoside, where MW
= 449.2 and ε= 26,900
3 Proximate analysis
3.1 Total solids and moisture content measurements (AOAC 941.08, 2007)
Covered dishs were dried in a hot air oven at 105 oC for 12 hours and then cooled in desiccator and weighed. Weighed 2 g of sample in a dish that has been dried and known weight. Then evaporated it by using steam bath for 30 minutes. Loosen the cover (not until the cover was removed) and heat it at 105 °C until it reached its constant weight then immediately tighten cover on dish, transferred to desiccator, and weighed soon after the sample temperature was equal with room temperature. Total solids ratio was obtained from dry sample weight divided with initial sample weight and multiplied by 100%. Percentage of moisture content was obtained from 100 - percent total solids.
3.2 Determination of ash contents (AOAC 923.03, 2007)
Crucibles were dried in a hot air oven at 105 oC for 24 hours and then cooled in desiccator and weighed. Weighed 2-3 g of sample in a crucible that has been dried and known weight. A major of water evaporated (not dried completely) on a hot plate in fume hood. Further placed in the furnace at 550 oC for 18-24 hours or until light gray ash results. Sample was cooled in a desiccator and the weight recorded. Ash content of the sample could be calculated using the following formula:
Ash (% wb) = (a ‒ b) / c % Ash (% db) = Ash %wb
‒ Moisture content %wb × %
Description :
a = weight of ashed sample and crucible (g) b = weight of crucible (g)
c = weight of wet sample (g)
3.3 Determination of protein contents, micro Kjeldahl (AOAC 960.52, 2007)
7 mL H2SO4 were added, also boiling chips which pass No. 10 sieve. Test portion
was digested 1 h after all H2O is distilled and acid comes to true boil.
Minimum volume of H2O was added to dissolve solids, cooled, and thin
film of petroleum jelly placed on rim of flask. Digested and boiling chips transferred to distillation apparatus and flask rinsed 6 times with 2 mL portions H2O. Under condenser with tip extending below surface of solution was placed
125 mL Erlenmeyer contained 5 mL saturated H3BO3 solution and 4 drops
indicator Added 10 mL NaOH-Na2S2O3 solution to still, collected ca 15 mL
distillate, and diluted to ca 50 mL. Titrated to end point. Made blank determination and calculate. Nitrogen content calculated by the equation:
%Nitrogen (wet basis) = normality HCl × corrected acid volume mL × . g N/mol
weight of wet sample g ×
%Nitrogen (dry basis) = normality HCl × corrected acid volume mL × . g N/mol
weight of dried sample g ×
%Protein = %N × Protein factor
= %N × 5.45 (combination of coconut and rice protein factor)
3.4 Determination of lipid contents, soxhlet extraction (AOAC 963.15, 2007)
Fat flask were dried in a hot air oven at 105 oC for 1 hour and then cooled in desiccator and weighed. Weighed 2 g of sample used fat-free cotton and wrapped by filter paper Whatman® no 1 then tied with a white thread. Placed thimble containing test sample in soxhlet, supported it with spiral or glass beads. Rinsed digestion beaker, drying beaker, and watch glass with three 50 mL portions petroleum ether, and added to wash the thimble. Reflux digested test sample 4 h adjusted heat so that extractor siphons ≥30 times. Removed flask, and evaporated solvent on steam bath. Dried flask at 105°C until it reached its constant weight. Cooled in desiccator to room temperature and weighed.
Calculated fat content by the following equation: %Fat (wet basis) = (a ‒ b) / c %
%Fat (wet basis) = Fat %wb
‒ Moisture content %wb ×
Description :
a = weight of flask and fat (g) b = weight of flask (g)
c = weight of wet sample (g)
2.4.5 Determination of carbohydrate, by difference
8
Carbohydrate levels (%) = 100% ‒ (MC + A + P + F) Description:
MC = % moisture content A = % ash content P = % protein content F = % fat content
4 Sensory evaluation (Lawless and Heymann, 1998)
Sensory analysis was carried out to determine the best sample using thirty five untrained panelists. Three formulations were given to the panelists in frozen condition. Then, 9-point hedonic scale was used for testing. Es puter was evaluated on the basis of acceptance of appearence, color, aroma, bitterness, sourness, taste, texture, and overall liking.
5 Consumer test (Meilgaard et al., 2007)
Consumer test was done to determine the acceptance of es puter final product. The location of consumer test was in the central location of Mae Fah Luang University, Thailand, with 100 responses.
6 Statistical analysis (Meilgaard et al.,2007)
9
RESULT AND DISCUSSION
Physical quality of es puter Overrun
Overrun is defined as the volume of air whipped into the product during the freezing process. Overrun occured because the air trapped by short-chain protein, fat, and lactose (Arbuckle et al. 1986). Commercial es puter has overrun values around 4.37-7.54% (Setiawan, 2009). Overrun values in this study were all lower than 50% which ranged between 5.35-24.77% (Table 2). Es puter in this study had higher overrun values than commercial es puter. Es puter relatively contains low protein and fat, moreover it does not contain lactose from milk. The presence of GMS as emulsifiers in es puter in this study improved the ability of the mix to incorporate air (Kilara and Chandan, 2007) while commercial es puter does not contain it. Overrun of formulations 4%:30% (7.31±0.10%) and 4%:35% (5.35±0.41%) approached the range of commercial es puter overrun values (4.37-7.54%).
From the data shown in Table 2 it could be seen that the higher the content of green tea powder and fermented black glutinous rice results in the lower the overrun value. The high content of green tea powder increased the viscosity of the es puter mix. Arbuckle (1986) revealed that increasing of viscosity will increase the surface tension which causes increasing of capability to entrap air. However, the data showed that the higher es puter viscosity, the lower overrun. It was caused by adding the intact glutinous rice into the mix after the homogenization process. In the homogenizer, the large fat droplets are elongated and broken up Table 2 Overrun, viscosity, melting time, and total solid of es puter
Formulations
Overrun (%) Viscosity (cP) Melting Time (min)
Total Solid (%) Green
tea powder
Fermented black glutinous
rice 2%
25% 24.77±0.79a 476.93±0.90i 6.01±0.29i 31.60±0.18h 30% 20.07±0.33a 952.60±0.53h 7.57±0.68fic 32.32±0.18g 35% 18.98±0.66b 1,119.00±0.89g 8.56±1.16c 32.47±0.18g 3%
25% 17.59±0.31d 1,226.47±0.47f 6.68±1.03ig 31.89±0.46eh 30% 15.45±0.71e 1,400.67±1.53e 8.86±0.74dfb 32.53±0.76degb
35% 12.30±0.37f 1,916.67±0.49d 10.32±0.59b 33.40±0.07d
4%
25% 9.95±0.82g 2,247.33±0.75c 7.68±0.55g 32.95±0.08b 30% 7.31±0.10h 2,794.33±0.58b 9.57±0.87d 33.46±0.26b 35% 5.35±0.41i 3,523.00±1.00a 12.93±0.27a 34.22±0.41a Results were expressed as mean±SD (n=3)
nssuperscript in column was not significantly different (p>0.05)
10
into a fine emulsion of much smaller droplets (about 1µm in diameter), greatly increasing the surface area. After homogenization, the protein readily adsorb to the bare surface of the fat droplets. The protein are mostly adsorbed on the aqueous side of fat-matrix interface, with hydrophobic parts at the interface. Interaction between the proteins on the outside of the droplets make it harder for the droplets to come into close contact. This is known as steric stabilization (Clarke, 2008). But the stabilization that had been formed was disturbed by the presence of fermented black glutinous rice and made the mix was difficult to incorporate and stabilize air bubbles when the mix was frozen. It caused the overrun value tend to get lower in line with the increasing amount of black glutinous rice was added.
Viscosity
Viscosity is a measurement of resistance to flow of a fluid (Toledo, 2007). A certain level of viscosity seems essential for proper whipping and for retention of air (Marshall and Arbuckle, 2000). The viscosity of an es puter mix is affected by compositions (fat and stabilizer), kind and quality of ingredients, processing and handling of the mix (pasteurization, homogenization, and aging), concentration (TS content), and temperature (Marshall and Arbuckle, 2000). Commercial es puter contains some ingredients as filler such as hunkue flour and tapioca starch (Hestiana, 2009). The presence of starch in the commercial es puter play a role in increasing its viscosity.
Different from commercial es puter, there are two factors that play a role in increasing the viscosity of es puter in this study that are stabilizer and total solid. One of stabilizer function is to develop viscosity in the es puter mix, since a more viscous mix has a better capacity to retain air bubbles (Cottrell et al., 1980; Bolliger et al., 2000a; Chavez-Montes et al., 2004). Green tea powder that added to es puter increase its total solid replacing the water content in the mix which also happened to increase the viscosity, nutritive value, and improving the body and texture of the es puter (Marshall and Arbuckle, 2000). The data showed that the viscosity values in this study (476.93-3,523.00 cP) were lower than commercial es puter (4,000-6,000 cP) (Table 2). It showed that starch gave a stronger effect on viscosity of es puter mix than stabilizer and green tea powder.
11
Melting time
Melting time is the time that required to es puter perfectly melts in room temperature. Table 2 showed that es puter in this study (6.01-12.93 min) had melting time higher than commercial es puter between 6.64-9.08 min and the longest melting time was formulation with 4% green tea powder and 35% fermented black glutinous rice (12.93 min). The meltdown characteristics are influenced by the protein stability, fat agglomeration, and air cell size. Partially coalesced three-dimensional network formed by the fat globules with air and ice is in part responsible for the melt resistance and smoother texture of the frozen dessert. Presence of surface-active proteins will stabilize the weak fat-serum interface first. Increased emulsification results in depletion of protein from the fat molecule that increases fat destabilization decreases melting rate and enhanced shape retention during the melting process (Bolliger et al., 2000b). The factor that play a role in decreasing melting time of es puter in this study is stabilizer. In addition producing smoothness in texture during eating, stabilizer can reduce the rate of meltdown (i.e. the rate at which the es puter loses mass as it melts) (Clarke, 2008) yet the commercial es puter does not contain it.
The data showed the high content of green tea powder and fermented black glutinous rice, the longer of its melting time. Generally, as the viscosity increases, the resistance to melting increases too (Marshall et al., 2003). From melting time data, formulation 2%:25% (6.01±0.29 min), 2%:30% (7.57±0.68 min), 2%:35% (8.56±1.16 min), 3%:25% (6.68±1.03 min), 3%:30% (8.86±0.74 min), and 4%:25% (7.68±0.55 min) approached range of melting time of commercial es puter (6.64-9.08 min).
Total solid
The total solid is the sum of all ingredients other than water (Clarke, 2008). Product, such as es puters, sorbets, milk ices or water ices contains a subset of the ingredients of ice cream. In the es puter in this study, total solid come from coconut milk, sugar, salt, stabilizer (CMC), emulsifier (GMS), green tea powder, and fermented black glutinous rice. Total solid replaced water in the mix, thereby increasing the nutritive value and viscosity and improving the body and texture of the ice cream (Marshall and Arbuckle, 2000). The data showed that total solid values of es puter were around 31.60-34.22 % (Table 2). When compared with commercial es puter, total solid values of es puter in this study were higher than commercial es puter (19.47-23.08 %) caused by adding fermented black glutinous rice.
12
achieved the most of commercial es puter criterias. Then the three formulations were analyzed further by using chemical analysis and sensory evaluation to get the best formula.
Chemical quality of es puter
Antioxidant activity (DPPH)
The DPPH radical scavenging activity (DPPH) was one of method that used to analyze the antioxidant activity of the samples. The DPPH antioxidant activity expressed as µmol Trolox equivalent/100 g dry weight of each sample as shown in Table 4. Antioxidant activity of fermented black glutinous rice (248.42±9.90 µmol Trolox equivalent/100 g dry weight) was higher than unfermented black glutinous rice (65.44±15.45 µmol Trolox equivalent/100 g dry weight) (p<0.05).
The results of fermentation was consistent according to other researches. Sadabpod et al. (2010) reported that DPPH scavenging activity of fermented black glutinous rice were higher than those of raw rice and cooked rice while fermented maize (Daker et al., 2008) and Phellinus-fermented adlay and rice (Liang et al., Table 3 Determination of three selected es puter formulations based on overrun, viscosity, and melting time that approach range of physical quality of commercial es puter
Parameter
Formulation
Green tea
powder (%) 2 3 4
Fermented black glutinous
rice (%)
25 30 35 25 30 35 25 30 35
Overrun - - - √ √
Viscosity - - - √ √ √
Melting
time √ √ √ √ √ - √ - -
Total 1 1 1 1 1 0 2 2 2
‒ : formulation of es puter that did not approach range of physical quality of commercial es
puter.
√ : formulation of es puter that approached range of physical quality of commercial es puter.
Table 4 Antioxidant activity (DPPH), phenolic content, and anthocyanin content of unfermented and fermented black glutinous rice
Black glutinous rice Antioxidant activity (DPPH) (µmol Trolox/100g dry basis) Phenolic content (GAE in g/100 g
sample)
Anthocyanin content (mg of total anthocyanin content
/ 100g sample) Unfermented 65.44±15.45B 0.04±0.01B 0.24±0.01B
Fermented 248.42±9.90A 0.07±0.01A 0.36±0.07A
Results were expressed as mean±SD (n=3)
nssuperscript in column was not significantly different (p>0.05)
13
2009) had better DPPH scavenging effect than that of unfermented ones. S. cerevisiae fermented watermelon rind was shown to have higher DPPH scavenging capacity than that of unfermented one (Erukainure et al., 2011).
The increasing of the DPPH scavenging activity of fermented rice might be due to the increasing of phenolic and anthocyanin contents. Anthocyanins are natural phenolic pigments that were reported to scavenge free radicals such as superoxide (O2-), singlet oxygen (˙O2), peroxide (ROO-), hydrogen peroxide
(H2O2) and hydroxyl radical (OH-) (Wang and Jiao, 2000). Normally, the
antioxidant activity of the anthocyanidins (aglycons) was generally greater than those of the corresponding anthocyanins (glycosides) (Wang and Stoner, 2008).
Table 5 showed that antioxidant activity of formulations 4%:30% and 4%:35% was higher (1,865.81±161.63 and 1,971.11±118.49 µmol Trolox equivalent/100 g dry weight, respectively) than formulation 4%:25% (1,105.36±117.84 µmol Trolox equivalent/100 g dry weight) (p<0.5) while the phenolic and anthocyanin content were not significantly different each other (p>0.05). The addition of fermented black glutinous rice played a role in decreasing of pH of es puter. Anthocyanins being more stable in acidic media at low pH values than in alkaline solutions with high pH values (Rein, 2005). Therefore, the high content of fermented black glutinous rice, the higher of its antioxidant activity.
Table 5 showed that antioxidant activity was not always linearly with the phenolic compound. Black glutinous rice content bioactive compounds other than phenolic compounds i.e. phytic acid, –oryzanols, –tocopherol, and –tocopherol (Moongngarm et al., 2012). These compounds contribute in increasing antioxidant activity of black glutinous rice.
Antioxidant activity of es puter (combination of green tea and fermented black glutinous rice) compared with fermented black glutinous rice had higher antioxidant activity.The addition of green tea played a role in increasing of antioxidant activity of es puter. Major catechins present in green tea i.e. epicatechin (EC), epigallocatechin gallate (EGCG), epigallocatechins (EGC) and epicatechin gallate (ECG) have strong antioxidant potentials (Rai et al., 2012). Table 5 Antioxidant activity (DPPH), phenolic content, and anthocyanin content
of es puter
Formulations es puter Antioxidant activity (DPPH) (µmol Trolox/100g dry basis) Phenolic content (GAE in g/100
g sample)
Anthocyanin content (mg of total anthocyanin content / 100g
sample) Green tea powder Fermented black glutinous rice 4%
25% 1,105.36±117.84b 0.08±0.01ns 0.28±0.02ns 30% 1,865.81±161.63a 0.09±0.01ns 0.30±0.11ns 35% 1,971.11±118.49a 0.08±0.01ns 0.32±0.10ns Results were expressed as mean±SD (n=3)
nssuperscript in column was not significantly different (p>0.05)
14
Antioxidant activity of EGCG is about 25-100 times more potent than vitamin C and E and is the single most studied catechins in relation to health contributing potential (Cabrera et al., 2006).
Phenolic content
The phenolic content of fermented black glutinous rice (0.07±0.01 GAE in g/100 g sample) was higher than unfermented black glutinous rice (0.04±0.01 GAE in g/100 g sample) (p<0.05) (Table 4). The increasing of phenolic content of fermented black glutinous rice was similar to another study. Liang et al. (2009) found that Phellinus-fermented rice exhibited higher phenolic content than unfermented rice. Sadabpod et al. (2010) also reported that phenolic contents of fermented black glutinous rice were higher than those of raw rice and cooked rice. The greater phenolic content of the fermented black glutinous rice may be due to the enzymatic activities of starter organisms in ragi tape such as Amylomyces rouxii, Rhizopus oryzae, Mucor indicus, Candida tropicalis and Saccharomycopsis fibuligera (Abe et al., 2004). It was suggested that the increasing of phenolic content might be due to hydrolysis by a glycoside hydrolase during fermentation (Ju et al., 2009). As the result, the more active side was read by Folin-Ciocalteu’s phenol reagent as phenolic compound. Table 5 showed that phenolic content of three formulations were not significantly different each other (p>0.05).
Anthocyanin content
15 Sensory evaluation
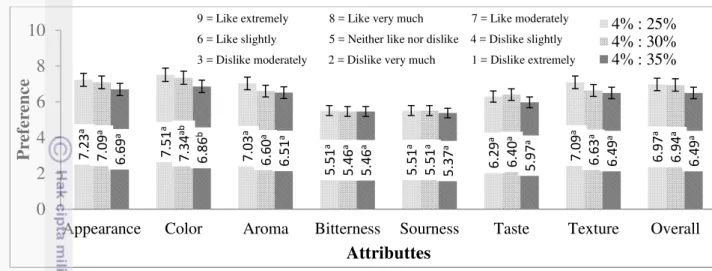
Figure 1 showed the hedonic result of three selected formulations of es puter from 35 panelists. The results showed that all of attributes were not significantly different except color.
Formula with 4% of green tea powder and 30% of fermented black glutinous rice was selected as the best formula. According to hedonic result, it showed that formula 4%:25%, 4%:30% and 4%:35% were not significantly different. The results from chemical, phenolic and anthocyanin analysis were not significantly different (p>0.05) as well between three samples, but formula 4%:30% and 4%:35% had higher antioxidant activity than formula 4%:25%. Formula 4%:30% was more preferable because it had higher hedonic overall score than formula 4%:35%. Figure 2 showed the best formula of es puter.
Data with different lower case letters indicated significant differences (p < 0.05)
Figure 1 Hedonic result of three selected formulations of es puter
7.23 a 7.51 a 7.03 a 5.51 a 5.51 a 6.29 a 7.09 a 6.97 a 7.09 a 7.34 ab 6.60 a 5.46 a 5.51 a 6.40 a 6.63 a 6.9 4 a 6.69 a 6.86 b 6.51 a 5.46 a 5.37 a 5.97 a 6.4 9 a 6.49 a 0 2 4 6 8 10
Appearance Color Aroma Bitterness Sourness Taste Texture Overall
P re fe re n ce Attributtes
4% : 25% 4% : 30% 4% : 35%
Figure 2 The best formula of es puter (4% of green tea powder and 30% of FBGR with the total solid 33.46±0.26%, 7.31±0.10% overrun, 2,794.33±0.58 cP viscosity, and 9.57±0.87 min of melting time)
16
Consumer test
The characteristics of panelists were shown in Table 6. The majority of panelists were females (71%), the age of panelists were approximately normally distributed, with less than 20 years and a median age group of 21–30 years. Most of them were undergraduate students.
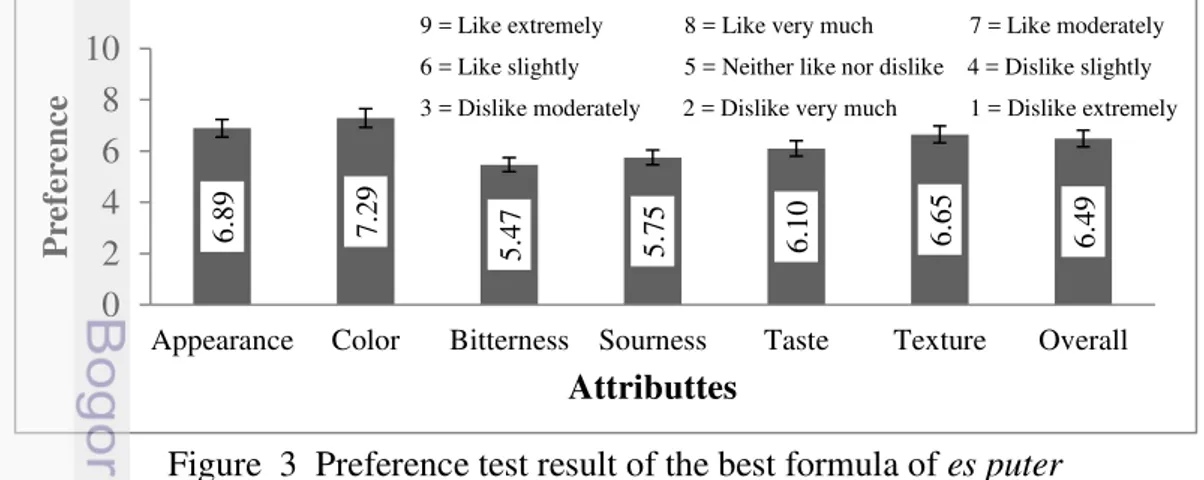
Figure 3 showed the preference test of es puter formula from 100 panelists. The panelists tended to like formulation es puter ranged from 5 (neither like nor dislike) to 7 (like moderately) for each attribute.
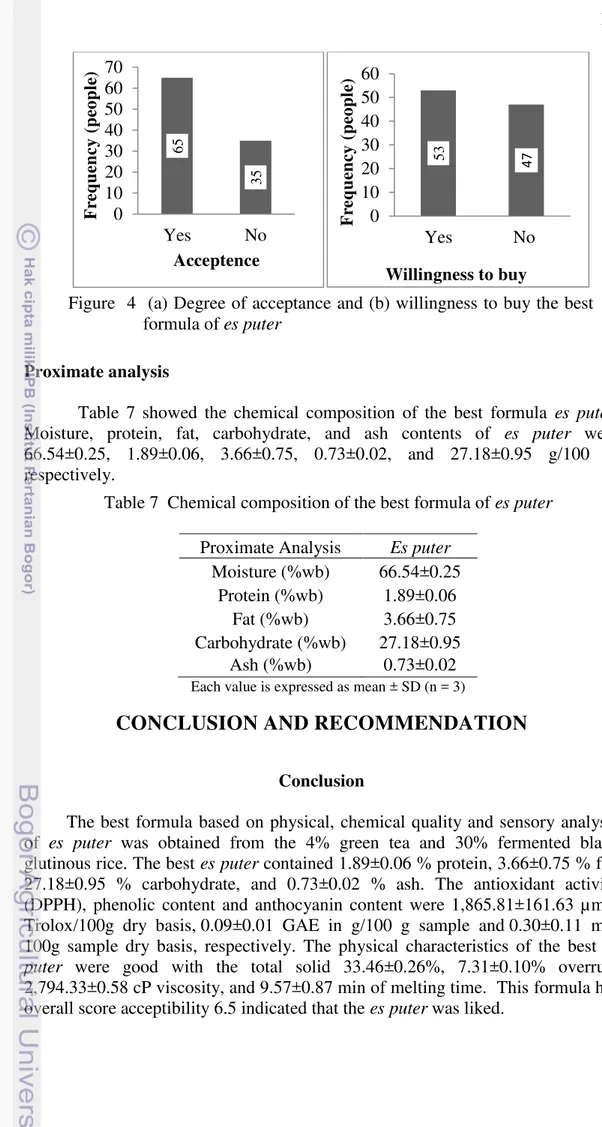
Figure 4 (a) showed the acceptance test of es puter. The data showed that 65 peoples from 100 peoples accepted es puter. The less preference due to the panelists did not like bitterness of green tea. Figure 4 (b) showed the data of willingness to buy es puter. The data showed that 53 people from 100 peoples had willingness to buy es puter.
Table 6 Characteristics of panelists (n=100)
Characteristic Number of Characteristic Number of panelists, n (%) panelists, n (%)
Gender Education
Male 29 (29) School 0 (0)
Female 71 (71) Undergraduate 95 (95)
Master degree 2 (2)
Doctor degree 3 (3)
Age Profession
≤ 20 49 (49) College student 95 (95)
21-30 49 (49) Employee 0 (0)
31-40 1 (1) Lecturer 4 (4)
41-50 1 (1) Businessman 0 (0)
> 50 0 (0) Others 1 (1)
Figure 3 Preference test result of the best formula of es puter
6 .8 9 7 .2 9 5 .4 7 5 .7 5 6 .1 0 6 .6 5 6 .4 9 0 2 4 6 8 10
Appearance Color Bitterness Sourness Taste Texture Overall
P re fe re n ce Attributtes
17
Proximate analysis
Table 7 showed the chemical composition of the best formula es puter. Moisture, protein, fat, carbohydrate, and ash contents of es puter were 66.54±0.25, 1.89±0.06, 3.66±0.75, 0.73±0.02, and 27.18±0.95 g/100 g, respectively.
CONCLUSION AND RECOMMENDATION
Conclusion
The best formula based on physical, chemical quality and sensory analysis of es puter was obtained from the 4% green tea and 30% fermented black glutinous rice. The best es puter contained 1.89±0.06 % protein, 3.66±0.75 % fat, 27.18±0.95 % carbohydrate, and 0.73±0.02 % ash. The antioxidant activity (DPPH), phenolic content and anthocyanin content were 1,865.81±161.63 µmol Trolox/100g dry basis, 0.09±0.01 GAE in g/100 g sample and 0.30±0.11 mg/ 100g sample dry basis, respectively. The physical characteristics of the best es puter were good with the total solid 33.46±0.26%, 7.31±0.10% overrun, 2,794.33±0.58 cP viscosity, and 9.57±0.87 min of melting time. This formula has overall score acceptibility 6.5 indicated that the es puter was liked.
Table 7 Chemical composition of the best formula of es puter Proximate Analysis Es puter
Moisture (%wb) 66.54±0.25 Protein (%wb) 1.89±0.06
Fat (%wb) 3.66±0.75 Carbohydrate (%wb) 27.18±0.95
Ash (%wb) 0.73±0.02 Each value is expressed as mean ± SD (n = 3)
Figure 4 (a) Degree of acceptance and (b) willingness to buy the best formula of es puter
65 35 0 10 20 30 40 50 60 70 Yes No F req u en cy (peo p le) Acceptence 53 47 0 10 20 30 40 50 60 Yes No F re q u en cy (pe op le)
18
Recommendation
Recommendations for further research are improving in physical quality es puter by adding substitution that has high total solid, using crused fermented black glutinous rice and reducing green tea powder for 4% green tea and 30% fermented black glutinous rice formula that used because the less preference due to the panelists did not like bitterness of green tea.
REFERENCES
Arbuckle WS. 1986. Ice Cream. The AVI Publishing Company Inc., Westport, conecticut.
Association of Official Analytical Chemist [AOAC]. 2007. Official Methods of Analysis of AOAC International. 18th ed. 2nd revision. Gaithersburg (US): AOAC Inc.
Abe A, Sujaya IN, Sone T, Asano K, Oda Y. 2004. Microflora and Selected Metabolites of Potato Pulp Fermented with an Indonesian Starter Ragi Tape. Journal of Food Technol. Biotechnol. 42 (3) 169-173.
Bolliger S, Goff HD, Tharp BW. 2000a. Correlation between colloidal properties of ice cream mix and ice cream. Int. Dairy J. 10:303-309.
Bolliger S, Wildmoser H, Goff HD, and Tharp BW. 2000b. Relationships between ice cream mix viscoelasticity and ice crystal growth in ice cream. Int. Dairy J. 10:791-797
Cabrera Carmen, Reyes Artacho, Rafael Gimenez. 2006. Beneficial Effects of Green Tea-A Review. J Am Coll Nutr; 25(2) 79-99.
Chavez-Montes BE, Choplin L, Schaer E. 2004. Processing and formulation effects on structural and rheological properties of ice cream mix, aerated mix and ice cream. Page 256 in Ice Cream II: Proceedings of the Second IDF International Symposium held in Thesaloniki, Greece, 14-16 May 2003. B. Tharp, ed. International Dairy Federation. Brussels, Belgium. Chu Kai On, Chan Kwok Ping, Wang Chi Chiu, Chu Ching Yan, Li Wai Ying,
Choy Kwong Wai, Rogers Michael Scott and Pang Chi Pui. 2010. Green tea catechins and their oxidative protection in the Rat Eye. J. Agric. Food Chem; 58 (3): 1523-34.
Clark S, Costello M, Drake M, Bodyfelt F. 2009. The Sensory Evaluation of Dairy Products. 2nd ed. New York (US): Springer.
Clarke C. 2008. The Science of Ice Cream. Cambridge (UK): RSC Publishing. Cottrell JLL, Pass G, Philips GO. 1980. The effect of stabilizers on the viscosity
of an ice cream mix. J. Food Sci. Agri. 31:1066-1071.
Daker M, Abdullah N, Vikineswary S, Goh PC, Kuppusamy UR. 2008. Antioxidant from maize and maize fermented by Marasmiellus sp. As stabiliser of lipid-rich foods. Food Chem. 107:1092-1098.
19 Saccharomyces cerevisiae Solid Media Fermentation. World J. Fermentation. Technol. Bioeng. 2:11-16.
Food and Agriculture Organization of the United Nations Statistics [FAOSTAT]. 2011. Food and A gricultural Commodities Production. Available from: http://faostat.fao.org/site/339/default.aspx. Accessed on June 9th 2013.
Frandsen JH, Arbuckle WS. 1961. Ice Cream and Related Products. The AVI Publishing Company, Inc. Westport, Conecticut.
Guisti MM, Wrolstad RE. 2001. Characterization and measurement of anthocyanins by UV-Visible spectroscopy. Current Protocols in Food Analytical Chemistry. (F1.21-F1.2.13). New York: John Wiley & Sons. Hestiana. 2009. The Utilization of Red Sweet Potato (Ipomoea batatas L) in The
Making Es Puter and Financial Analysis [Manuscript] Bogor (ID): Department of Food Science and Technology, Faculty of Agricultural Engineering and Technology, Bogor Agricultural University.
Horzie D, Komes D, Belscak A, Ganic KK, Ivekovic D, Karlovic D. 2009. The composition of polyphenols and methylxantine in teas and herbal infusions. Food Chem; 115: 441-448.
International Organization for Standardization. 2005. Determination of substance characteristic of green tea and black tea - Part 1 : Content of total polyphenols in tea – Calorimetric method using Folin – Ciocalteu reagent. ISO 14502-1:2005. Switzerland: International Organization for Standardization.
Ju HK, Cho EJ, Jang ME, Lee YY, Hong SS, Park JH, Kwon SW. 2009. Characterization of increased phenolic compounds from fermented Bokbunja (Rubus coreanus Miq.) and related antioxidant activity. J. Pharm. Biomed. Anal. 49:820-827.
Kilara A, Chandan RC. 2007. Ice cream and Frozen Dessert in Hui, YH. (Ed). Handbook of Food Products Manufacturing. New York (US): John Willey & Sons, Inc.
Lawless TH , H Heymann. 1998. Acceptance and preference testing. In: Sensory Evaluation of Food: Principles and Practices. New York: Kluwer Academic Publishers. pp 430-479.
Lee IH, Hung YH, Chou CC. 2007. Total phenolic and anthocyanin contents, as well as antioxidant activity, of black bean koji fermented by Aspergillus awamori under different culture conditions. Food Chem. 104:936–942. Lee IH, Hung YH, Chou CC. 2008. Solid-state fermentation with fungi to enhance
the antioxidative activity, total phenolic and anthocyanin contents of black bean. Int. J. Food icrobiol. 121:150–156.
Liang CH, Syu JL, Mau JL. 2009. Antioxidant properties of solid-state fermented adlay and rice by Phellinus linteus. Food Chem.116:841-845.
Lin CH, Chou CC. 2006. Suppression on the mutagenicity of 4- nitroquinoline- N-oxide by the methanol extracts of soybean koji prepared with various filamentous fungi. Int. J. Food Microbiol. 110:43-47.
Marshall RT, Goff HD, Hartel RW. 2003. Ice Cream, 6th ed, pp. 143-146. New
York: Kluwer Academic/Plenum Publishers.
20
McKay DL, Blumberg JB. 2002. The role of tea in human health: An update. J Am Coll Nutr 21:1–13
Meilgaard MC, GV Civille, BT Carr. 2007. Sensory Evaluation Techniques. 4th ed. New York: CRC Press. 448p.
Molyneux P. 2004. The use of the stable free radical diphenylpicrylhydrazyl (DPPH) for estimating antioxidant activity songklanakarin Journal of Science and Technology 26(2):211-219.
Moongngarm A, Daomukda N, Khumpika S. 2012. Chemical Compositions, Phytochemicals, and Antioxidant Capacity of Rice Bran, Rice Bran Layer, and Rice Germ. Asia-Pacific Chemical, Biological and Environmental Engineering Society.
Nadeem M, Abdullah M, Ayesha, Ellahi MY. 2009. Effect of Milk Fat Replacement with Palm Olein on Physico Chemical and Sensory Characteristics of Ice Cream. Pakistan Journal of ScienceVol. 61 No. 4. Plaitho Y, Kangsadalampai K, Sukprasansap M. 2012. The protective effect of
thai fermented pigmented rice on urethane induced somatic mutation and recombination in Drosophilia melanogaster. Journal of Medicinal Plants Research Vol. 7(2), pp. 91-98.
Rai Nishant, Anand Jigisha, Kumar Navin, Gautam Pankaj. 2012. Green Tea: A Magical Herb with Miraculous Outcomes. International Research Journal of Pharmac. 3(5).
Rein, M. 2005. Copigmentation reactions and color stability of berry anthocyanins [Doctoral dissertation] University of Helsinki, Helsinki, FI, 87 p.
Sadabpod K, Kangsadalampai K, Tongyonk L. 2010. Antioxidant activity and antimutagenicity of hom nil rice and black glutinous rice. J Health Res. 24(2):49-54.
Setiawan H. 2009. Study on Development Product of Es Puter from Purple Sweet Potato (Ipomoea batatas (L) Lam.) and Financial Analysis [Manuscript] Bogor (ID): Department of Food Science and Technology, Faculty of Agricultural Engineering and Technology, Bogor Agricultural University. Shumow, Bodor. 2011. An industry consensus study on an HPLC fluorescence
method for the determination of (±)-catechin and (±)-epicatechin in cocoa and chocolate products. Chemistry Central Journal, 5:39.
http://journal.chemistrycentral.com/content/5/1/39.
Sutharut J, Sudarat J. 2012. Total anthocyanin content and antioxidant activity of germinated colored rice. International Food Research Journal. 19(1): 215-221.
Tariq M, Naveed A, Barkat Ali K. 2010. The morphology, characteristics, and medicinal properties of Camellia sinensis’ tea. J. Med. Plants Res. 4(19): 2028-2033.
Toledo RT. 2007. Fundamentals of Food Process Engineering. 3rd ed. New York
(US): Springer Science+Business Media, LLC.
USDA: “USDA Database for the Flavonoid Contents of Selected Foods.”
Beltsville: US Department of Agriculture, 2003.
21 Wang LS, Stoner GD. 2008. Anthocyanins and their role in cancer prevention.
Cancer Lett. 269:281-290.
Wang SY, Jiao H. 2000. Scavenging capacity of berry crops on superoxide radicals, hydrogen peroxide, hydroxyl radicals, and singlet oxygen. J. Agric. Food Chem. 48:5677-5684.
22
APPENDICES
Appendix 1 The flow process diagram of es puter preparation
Mixed
Pasteurized at 68.3oC for 30 min
Homogenized using a homogenizer (18,000 rpm)
for 5 min
Rapidly cooled until 4oC in less than 1.5 h
Aged at 4oC for 24 h
Frozen using a home ice cream maker
Coconut milk as basis Fermented
black glutinous rice Green tea
powder
0.2% CMC, 0.2% GMS, 0.4% salt, 14% sugar
Dry mixed
Hardened and stored in a freezer
Es puter
Fermented black glutinous
23
Sugar (Mitr Polt brand)
Coconut milk commercial (Aroy D brand)
Green tea powder
(Wirun Green Tea Powder brand)
Salt (Aro brand) Commercial yeast cake starter
“ragi-tape” (Cap Bawang Brand)
Black glutinous rice Appendix 2 Materials that used to make fermented black glutinous rice
24
Appendix 4 Moisture content of fermented and unfermented black glutinous rice
Sample W can (g)
W sample
(g)
Wdried sample + can
(g)
W dried sample
(g)
M.C Mean SD
Fermented
12.2213 2.5779 13.5279 1.3066 49.32
50.30 0.89 12.8768 2.3579 14.0313 1.1545 51.04
12.3145 2.2150 13.4098 1.0953 50.55 Unfermented
12.2660 2.5208 13.5718 1.2431 49.32
48.79 0.51 12.4394 2.7216 13.8239 1.3860 51.04
11.5354 2.6001 12.8607 1.3884 50.55
%MC (wet basis) = sample weight gsample weight (g)-dried sample weight (g)×
%MC (wet basis) = . �− . �
. � ×
= . % Mean = . + . + . = . %
SD = √∑��= � �− ��
� �−
25 Appendix 5 Total solid of es puter
Formulation Weight can (g) Weight sample (g) Weight dried sample + can (g) Weight dried sample (g) Total Solid (g)
Mean SD Green tea powder Fermented black glutinous rice 2% 25%
17.5823 2.0491 18.2256 0.6433 31.39
31.60 0.18 17.1424 2.0910 17.8054 0.6630 31.71
16.7937 2.0594 17.4467 0.6530 31.71 30%
16.8700 2.0745 17.5373 0.6673 32.17
32.32 0.18 16.1805 2.0825 16.8527 0.6722 32.28
16.9077 2.0359 17.5698 0.6621 32.52 35%
17.1311 2.0525 17.7953 0.6642 32.36
32.47 0.18 17.0834 2.0180 17.7369 0.6535 32.38
17.1009 2.0553 17.7725 0.6716 32.68
3%
25%
16.8703 2.0709 17.5214 0.6511 31.44
31.89 0.46 17.3433 2.0414 18.0039 0.6606 32.36
16.6915 2.0604 17.3481 0.6566 31.87 30%
17.4040 2.0242 18.0519 0.6479 32.01
32.53 0.76 17.1086 2.0595 17.7965 0.6879 33.40
16.8948 2.0945 17.5690 0.6742 32.19 35%
17.5723 2.0681 18.2615 0.6892 33.33
33.40 0.07 16.9986 2.0834 17.6944 0.6958 33.40
17.1390 2.0998 17.8419 0.7029 33.47
4%
25%
11.9031 2.2195 12.6331 0.7300 32.89
32.95 0.08 12.3682 2.6241 13.2318 0.8636 32.91
13.1304 2.2315 13.8676 0.7372 33.04 30%
12.1677 2.2637 12.9233 0.7556 33.38
33.46 0.26 12.2709 2.3100 13.0504 0.7795 33.74
12.1770 2.1289 12.8848 0.7078 33.25 35%
11.8379 2.3973 12.6547 0.8168 34.07
34.22 0.41 12.1627 2.1418 12.8888 0.7261 33.90
12.1055 2.3367 12.9158 0.8103 34.68
%TS = dried sample weight (g)sample weight (g) × SD = √∑��= � �− ��
� �−
%TS = . �
. �× = 0.18
= . % Mean = . + . + .
26
Appendix 6 Percent overrun of es puter Formulation
Weigh of es puter mix (g)
Weight of es puter (g)
Overrun
(%) Mean SD
Green tea powder Fermented black glutinous rice 2% 25%
83.42 67.16 24.21
24.77 0.79
91.34 72.68 25.67
80.47 64.68 24.41
30%
86.44 71.77 20.44
20.07 0.33
86.01 71.79 19.81
86.61 72.19 19.98
35%
85.47 71.46 19.61
18.98 0.66
89.36 75.06 19.05
81.71 72.46 18.29
3%
25%
88.33 75.19 17.48
17.59 0.31
92.20 78.56 17.36
88.15 74.74 17.94
30%
84.16 73.31 14.80
15.45 0.71
91.23 78.51 16.20
84.94 73.64 15.34
35%
84.81 75.74 11.98
12.30 0.37
90.07 79.92 12.70
88.79 79.12 12.22
4%
25%
83.03 75.75 9.61
9.95 0.82
89.96 82.27 9.35
79.55 71.74 10.89
30%
85.35 79.45 7.43
7.31 0.10
92.77 86.50 7.25
81.55 76.03 7.26
35%
87.05 82.85 5.07
5.35 0.41
92.15 87.08 5.82
87.06 82.78 5.17
%Overrun = weight of es puterweight mix g - weight of es puter (g)
of es puter mix (g) × %Overrun = . �− . �
. � ×
= 24.21% SD = √∑��= � �− ��
� �−
Mean = . + . + . = 0.79
27 Appendix 7 Viscosity of es puter
Formulation
Viscosity (cp) Mean SD Green tea powder (%) Fermented black glutinous rice 2% 25% 475.90
476.93 0.90 477.50
477.40 30%
952.80
952.61 0.53 952.00
953.00 35%
1118.70
1119.00 0.89 1120.00
1118.30
3%
25%
1226.30
1226.47 0.47 1227.00
1226.10 30%
1402.00
1400.67 1.53 1401.00
1399.00 35%
1916.90
1916.67 0.49 1916.10
1917.00
4%
25%
2246.60
2247.33 0.75 2248.10
2247.30 30%
2794.00
2794.33 0.58 2795.00
2794.00 35%
3522.00
3523.00 1.00 3523.00
3524.00 Mean = . + . + .
= . cp
SD = √∑��= � �− ��
� �−
28
Appendix 8 Melting time of es puter Formulation
Weight of es puter (g)
Melting time (minute)
Mean SD
Green tea powder (%) Fermented black glutinous rice 2% 25%
5.6546 6.20
6.01 0.29
5.6756 6.15
5.0162 5.67
30%
5.2961 7.25
7.57 0.68
5.2092 7.12
5.8484 8.35
35%
5.0585 8.18
8.56 1.16
5.5840 7.63
5.8608 9.87
3%
25%
5.1167 6.33
6.68 1.03
5.0800 5.87
5.8283 7.83
30%
5.7314 8.73
8.86 0.74
5.4747 8.18
5.7562 9.65
35%
5.4025 9.98
10.32 0.59
5.8744 9.98
5.4586 11.00
4%
25%
5.1405 7.17
7.68 0.55
5.4955 7.60
5.8215 8.27
30%
5.4159 9.50
9.57 0.87
5.1729 8.73
5.7738 10.47 35%
5.5631 13.20
12.93 0.27
5.2023 12.93 5.2350 12.67 Mean = . + . + .
= . minute
SD = √∑ni= x i− xi
n n−
29 Appendix 9 Preparation of standard solution
Preparation standard solution of total phenolic content assay
Gallic acid was weight 0.0100 gram and dissolved with water in 10 mL volumetric flask. It became standard stock solution. After that, standard stock solution was diluted at several concentration 0 – 100 µg/mL.
Preparation standard solution of DPPH assay
Weight 0.0250 gram trolox and dissolved with water in 10 mL volumetric flask. It became standard stock solution. After that, standard stock solution was diluted at several concentration 0 – 1000 µg/mL.
Appendix 10 Total phenolic content standard curve of unfermented, fermented black glutinous rice and three formulations of es puter
Concentration
(µg/mL) Abs 1 Abs 2 Abs 3 Average SD
0 0.009 0.012 0.010 0.010 0.002
8 0.117 0.112 0.109 0.113 0.004
16 0.228 0.217 0.229 0.225 0.007
24 0.348 0.357 0.348 0.351 0.005
32 0.452 0.462 0.441 0.452 0.011
40 0.566 0.557 0.561 0.561 0.005
y = 0.013x + 0.006 R² = 0.999
0.000 0.100 0.200 0.300 0.400 0.500 0.600
0 10 20 30 40 50
A
bs
o
rba
nce
(nm
)
Concentration (µg/mL)
30
Appendix 11 DPPH standard curve of unfermented, fermented black glutinous rice and three formulations of es puter
Concentration
(µg/mL) Abs 1 Abs 2 Abs 3 Average % Inhibition
0 0.663 0.674 0.659 0.665 0.70
200 0.558 0.550 0.555 0.554 17.26
400 0.445 0.446 0.436 0.442 33.98
600 0.346 0.336 0.331 0.338 49.60
800 0.215 0.224 0.221 0.220 67.16
1000 0.058 0.101 0.085 0.081 87.86
y = 0.085x - 0.177 R² = 0.998
-20.00 0.00 20.00 40.00 60.00 80.00 100.00
0 200 400 600 800 1000 1200
%
I
nhibiti
o
n
Concentration (µg/ml)
Appendix 12 Result of total phenolic content Sample Weight of sample (g) Extract volume (mL)
Trial DF %DM
Absorbance Average Linear Eq. Conc. (µg/mL) TPC (%w/w dry basis)
Mean SD
1 2 3 m B
Fermented Black Glutinous
Rice
1.2676 10 1 1 49.7 0.522 0.522 0.546 0.530 0.013 0.006 40.31 0.064
0.07 0.01 1.1024 10 2 1 49.7 0.516 0.516 0.502 0.511 0.013 0.006 38.87 0.071
1.1435 10 3 1 49.7 0.553 0.554 0.566 0.558 0.013 0.006 42.44 0.075 Unfermented
Black Glutinous
Rice
2.2378 10 1 1 51.21 0.524 0.565 0.548 0.546 0.013 0.006 41.51 0.036
0.04 0.00 2.0879 10 2 1 51.21 0.497 0.535 0.528 0.520 0.013 0.006 39.54 0.037
2.2032 10 3 1 51.21 0.497 0.513 0.541 0.517 0.013 0.006 39.31 0.035 Es puter
(4%:25%)
2.2087 10 1 2.5 32.95 0.342 0.320 0.324 0.329 0.013 0.006 24.82 0.085
0.08 0.01 2.6292 10 2 2.5 32.95 0.333 0.330 0.331 0.331 0.013 0.006 25.03 0.072
2.3757 10 3 2.5 32.95 0.338 0.333 0.332 0.334 0.013 0.006 25.26 0.081 Es puter
(4%:30%)
2.1382 10 1 2.5 33.46 0.348 0.354 0.343 0.348 0.013 0.006 26.33 0.092
0.09 0.01 2.3954 10 2 2.5 33.46 0.343 0.342 0.354 0.346 0.013 0.006 26.18 0.082
2.2528 10 3 2.5 33.46 0.343 0.345 0.356 0.348 0.013 0.006 26.31 0.087 Es puter
(4%:35%)
2.4833 10 1 2.5 34.22 0.353 0.368 0.372 0.364 0.013 0.006 27.56 0.081
0.08 0.01 2.5315 10 2 2.5 34.22 0.360 0.378 0.370 0.369 0.013 0.006 27.95 0.081
2.2669 10 3 2.5 34.22 0.364 0.372 0.372 0.369 0.013 0.006 27.95 0.090
32
32
Appendix 13 Result of DPPH assay
Sample Weight of sample (g) Extract volume (mL)
Trial DF % DM Abs. Control Absorbance Ave Linear Eq. % inh Conc. of Trolox (µM) DPPH (µmol Trolox/100g dry basis)
Mean SD
1 2 3 m b
Fermented Black Glutinous
Rice
2.1604 10 1 1 49.7 0.665 0.542 0.499 0.501 0.514 0.086 -0.177 22.74 267.12 249
248.42 9.90 2.2869 10 2 1 49.7 0.665 0.495 0.515 0.487 0.499 0.086 -0.177 25.00 293.39 258
2.1515 10 3 1 49.7 0.665 0.552 0.515 0.496 0.521 0.086 -0.177 21.69 254.85 238
Unfermented Black Glutinous
Rice
2.2378 10 1 1 51.21 0.665 0.656 0.621 0.629 0.635 0.086 -0.177 4.50 54.56 48
65.44 15.45 2.0879 10 2 1 51.21 0.665 0.623 0.616 0.625 0.621 0.086 -0.177 6.61 79.09 74
2.2032 10 3 1 51.21 0.665 0.617 0.620 0.618 0.618 0.086 -0.177 7.06 84.34 75
Es puter
(4%:25%)
2.2087 10 1 5 32.95 0.665 0.563 0.573 0.554 0.563 0.086 -0.177 15.33 180.69 1241
1105.36 117.84 2.6292 10 2 5 32.95 0.665 0.577 0.577 0.538 0.564 0.086 -0.177 15.23 179.52 1036
2.3757 10 3 5 32.95 0.665 0.580 0.575 0.566 0.574 0.086 -0.177 13.77 162.59 1039
Es puter
(4%:30%)
2.1382 10 1 5 33.46 0.665 0.501 0.504 0.499 0.501 0.086 -0.177 24.65 289.31 2022
1865.81 161.63 2.3954 10 2 5 33.46 0.665 0.505 0.512 0.516 0.511 0.086 -0.177 23.19 272.37 1699
2.2528 10 3 5 33.46 0.665 0.507 0.506 0.502 0.505 0.086 -0.177 24.09 282.88 1876
Es puter
(4%:35%)
2.4833 10 1 5 34.22 0.665 0.488 0.482 0.469 0.480 0.086 -0.177 27.90 327.26 1926
1971.11 118.49 2.5315 10 2 5 34.22 0.665 0.481 0.480 0.480 0.480 0.086 -0.177 27.80 326.10 1882
33
Appendix 14 Result of anthocyanin content
Samples
Weight of sample
Absorbance
Wavelength 510nm Wavelength 700nm
pH 1
Ave pH 4.5 Ave pH 1 Ave pH 4.5 Ave
1 2 3 1 2 3 1 2 3 1 2 3
Fermented Black Glutinous
Rice
2.1604 0.257 0.253 0.246 0.252 0.177 0.185 0.175 0.179 0.100 0.107 0.110 0.106 0.081 0.078 0.072 0.077 2.2869 0.244 0.271 0.282 0.266 0.192 0.198 0.179 0.190 0.108 0.112 0.111 0.110 0.091 0.095 0.095 0.094
2.1515 0.232 0.263 0.259 0.251 0.169 0.180 0.192 0.180 0.105 0.112 0.111 0.109 0.087 0.078 0.068 0.078
Unfermented Black Glutinous
Rice
2.2378 0.069 0.075 0.079 0.074 0.033 0.029 0.029 0.030 0.016 0.014 0.018 0.016 0.005 0.005 0.002 0.004 2.0879 0.062 0.072 0.081 0.072 0.033 0.031 0.029 0.031 0.014 0.014 0.017 0.015 0.006 0.006 0.005 0.006
2.2032 0.075 0.078 0.087 0.080 0.036 0.038 0.032 0.035 0.017 0.017 0.018 0.017 0.004 0.005 0.001 0.003
Es puter
(4%:25%)
2.2087 0.102 0.110 0.111 0.108 0.042 0.043 0.043 0.043 0.027 0.038 0.041 0.035 0.009 0.004 0.014 0.009 2.6292 0.123 0.129 0.125 0.126 0.037 0.047 0.044 0.043 0.046 0.050 0.053 0.050 0.016 0.014 0.010 0.013 2.3757 0.117 0.123 0.115 0.118 0.041 0.031 0.035 0.036 0.049 0.049 0.047 0.048 0.004 0.003 0.003 0.003
Es puter
(4%:30%)
2.1382 0.097 0.115 0.115 0.109 0.050 0.043 0.034 0.042 0.047 0.045 0.055 0.049 0.027 0.036 0.016 0.026 2.3954 0.131 0.138 0.136 0.135 0.055 0.045 0.045 0.048 0.055 0.056 0.053 0.055 0.023 0.023 0.022 0.023 2.2528 0.109 0.114 0.109 0.111 0.056 0.044 0.038 0.046 0.043 0.044 0.047 0.045 0.006 0.004 0.002 0.004
Es puter
(4%:35%)
2.4833 0.100 0.110 0.108 0.106 0.044 0.043 0.044 0.044 0.044 0.043 0.043 0.043 0.034 0.036 0.036 0.035 2.5315 0.117 0.136 0.137 0.130 0.061 0.066 0.076 0.068 0.056 0.052 0.055 0.054 0.029 0.020 0.021 0.023 2.2669 0.126 0.144 0.139 0.136 0.062 0.072 0.069 0.068 0.041 0.057 0.056 0.051 0.034 0.035 0.036 0.035
34 34 Samples Weight of sample Extract volume (mL)
Trial DF MW Ɛ
<