ISSN: 1693-6930
accredited by DGHE (DIKTI), Decree No: 51/Dikti/Kep/2010 27
Plastic Ball Grid Array Encapsulation Process
Simulation on Rheology Effect
Dadan Ramdan*1, Mohd ZulkiflyAbdullah2, Khor Chu Yee3 1
Faculty of Engineering, Universitas Medan Area, Medan, Indonesia Jl. Kolam No.1 Medan, 30271, Medan, Indonesia
2,3
School of Mechanical Engineering, Universiti Sains Malaysia, Penang, Malaysia Engineering Campus, 14300 Nibong Tebal, Penang, Malaysia
e-mail: [email protected]*1, phone: 0164324620
Abstrak
Rangkaian elektronik terpadu harus dikemas untuk perlindungan dari pengaruh lingkungan seperti temperatur, tekanan dan benturan. Makalah ini menyajikan analisa visualisasi aliran fluida pada proses pengemasan (encapsulation process) plastic ball grid array (PBGA) dengan mempertimbangkan pengaruh reologi polimer. Dalam proses pencetakan kemasan, perilaku aliran fluida pengemas dimodelkan dengan model viskositas Castro-Macosko dengan mempertimbangkan pengaruh proses perubahan fluida mengering dan teknik volume of fluid (VOF) diterapkan untuk pelacakan aliran fluida. Model viskositas ditulis dalam bahasa C dan dikompilasi dengan menggunakan user-defined-fungsion ke dalam perangkat lunak FLUENT. Tiga jenis epoxy molding compound, yaitu kasus 1, 2, dan 3 digunakan untuk mempelajari perilaku lelehan fluida dalam rongga cetakan. Profil lelehan fluida dan hubungan viskositas dengan tingkat pembekuan untuk semua kasus dianalisis dan disajikan. Hasil simulasi dibandingkan dengan hasil eksperimen sebelumnya dan menemukan kesesuaian yang baik. Dalam penelitian ini, kasus 1 dengan viskositas yang lebih tinggi menunjukkan udara terperangkap lebih besar dan distribusi tekanan lebih tinggi.
Kata kunci: model viskositas Castro-Macosko, PBGA, pengaruh reologi, proses pengepakan
Abstract
The integrated circuit should be encapsulated for protection from their intended environment. This paper presents the flow visualization of the plastic ball grid array (PBGA) chip encapsulation process considering of the rheology effect. In the molding process, encapsulant flow behavior is modeled by Castro-Macosko viscosity model with considering curing effect and volume of fluid technique is applied for melt front tracking. The viscosity model is written into C language and compiled using User-Defined Functions into the FLUENT analysis. Three types of Epoxy Molding Compound namely case 1, 2, and 3 were utilized for the study of fluid flow inside the mold cavity. The melt front profiles and viscosity versus shear rate for all cases are analyzed and presented. The numerical results are compared with the previous experimental results and found in good conformity. In the present study, case 1 with greater viscosity shows the higher air trap and higher pressure distributions.
Keywords: Castro-Macosko viscosity model, encapsulation process, PBGA, rheology effect
1. Introduction
The EMC rheology properties play an important role during the encapsulation process. It is because the final physical properties of EMC and processing rely on it. Rheology is defined as the science of flow and deformation of matter [1]-[4]. The most common models of rheology are the Castro-Macosko model. It is especially used in thermoset polymer rheology [4].
The effect of gaps between die top and mold cap surface and between adjacent dies on EMC rheology during stacked-chip scale packages (S-CSP) encapsulated was studied by Abdullah MK et al. [4]. Rheokinetic simulation of mold filling behavior, mold void and wire sweeping dependences of gate size was analyzed by Lee MW et al. [5].
define functions (UDFs). Three different EMC properties namely case 1, case 2, and case 3are studied for analyzing of fluid flow inside mold cavity. Numerical results of flow patterns and percentage of the void of the three arrangements of EMC properties are compared.
2. Research Method 2.1 Mathematical Model
In the simulation model, the EMC and air are assumed incompressible and the governing equations that described the fluid flow are conservation of mass, conservation of momentum and conservation of energy [7]-[8]. FLUENT normally solves the governing equations using Cartesian spatial coordinates and velocity components as listed below.
The conservation of mass or continuity equation is:
߲ߩ
߲ݐ+߲ݔ߲ሺߩݑሻ
= 0 (1)
Equation (1) is the general form of the mass conservation equation and is valid for incompressible and compressible flows. Conservation of momentum in ith direction in an inertial (non- accelerating) reference frame is described by:
tensor and giand Fi are the gravitational acceleration and external body force in the i direction,
respectively.
The energy equation cast in terms of h (static enthalpy) can be written as,
߲
where k is the thermal conductivity, T is the absolute temperature and ߔ is the energy source term and it containing two contributions of polymer properties:
ߔ=ߤߛሶଶ+ߙሶ∆ܪ (4)
where µ is the viscosity and ߛሶis the shear rate, ߙሶ is the curing rate and ∆H is the reaction heat. The molding compound was assumed to be a generalized Newtonian fluid (GNF).
Several models have been used to predict the relationship between viscosity (µ) and the
degree of polymerization. The Castro–Macosko model has been applied by Nguyen et al. [8] and Alpem et al. [9] is selected to use in this simulation. It is described as follows:
ߤሺܶ,ߛሶሻ= ߤ(ܶ)
B is an exponential-fitted constant and Tb is a temperature fitted-constant. In addition, Kamal curing kinetics is coupled together with Castro–Macosko model. This model predicts the rate of chemical conversion of the compound as follows:
݀ߙ
݀ݐ =ሺ݇ଵ+݇ଶߙభሻ(1 −ߙ)మ (7)
݇ଵ=ܣଵexp (−
ܧଵ
ܶ) ݇ଶ=ܣଶexp (−
ܧଶ
ܶ) (8)
where A1 and A2 are the Arrhenius pre-exponential factors, E1 and E2 are the activation energies, m1 and m2 are the reaction orders, ߙ is the curing degree of EMC, which can be defined as a ratio of the heat released to the total heat released at complete conversion [10]:
ߙ(ݐ) = ∆ܪ(ݐ) ∆ܪ௧௧
(9)
The basic idea of the VOF scheme is to locate and evolve the distribution of, say, the liquid phase by assigning for each cell in the computational grid a scalar, F, which specifies the fraction of the cell's volume occupied by liquid. Thus, F takes the value of 1 (F=1) in cell, which contains only resin, the value 0 (F=0) in cells, which are void of resin, and a value between 0 and 1 (0<F<1) in “interface” cells or referred as the resin melt front. The equation of melt front over time is governed by the following transport equation:
߲ܨ
߲ݐ =߲ܨ߲ݐ + ∇ ∙ሺݑܨሻ= 0 (10)
2.2 Numerical Simulation
2.2.1 Simulation Model and Boundary Conditions
The volume of fluid (VOF) model in FLUENT 6.3.26 is utilized to simulate the process [6]. EMC types are set at different parameters, as shown in Table 1. Air and EMC are defined as the phases in the analysis. Implicit solution and time dependent formulation is applied for the volume fraction in every time step. The volume fraction of the encapsulation material is defined as one and zero value for air phase. Besides, viscosity Castro-Macosko model and VOF techniques are applied to track the melt front.
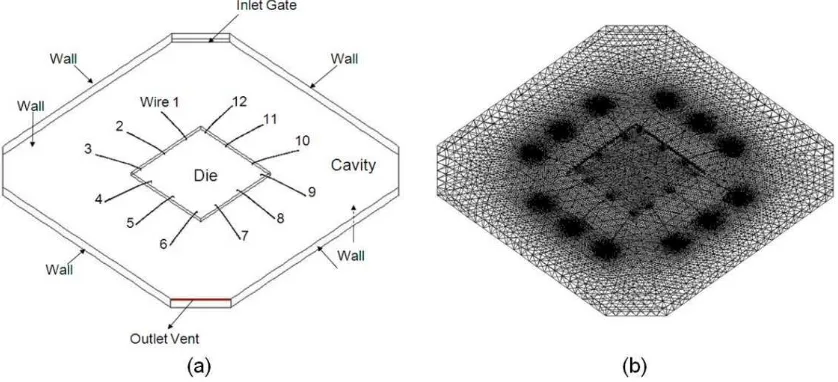
The PBGA chip package model used in the present study and its boundary conditions are
In the present study, geometry of the PBGA is modeled as a 3-D finite volume grid. The dimension of the mold model is 31 × 31 × 1 mm and the mold entrance is oppositely located to the outlet vent of the mold cavity as shown in Figure 1(a) is considered in the present investigation. Only twelve wires bonding are considered in the wire region of the package, and the wire bonding is assumed as a rigid body in the simulation. The model is created by using GAMBIT software and average 480,000 tetrahedral elements are generated for simulation (Figure 1b).
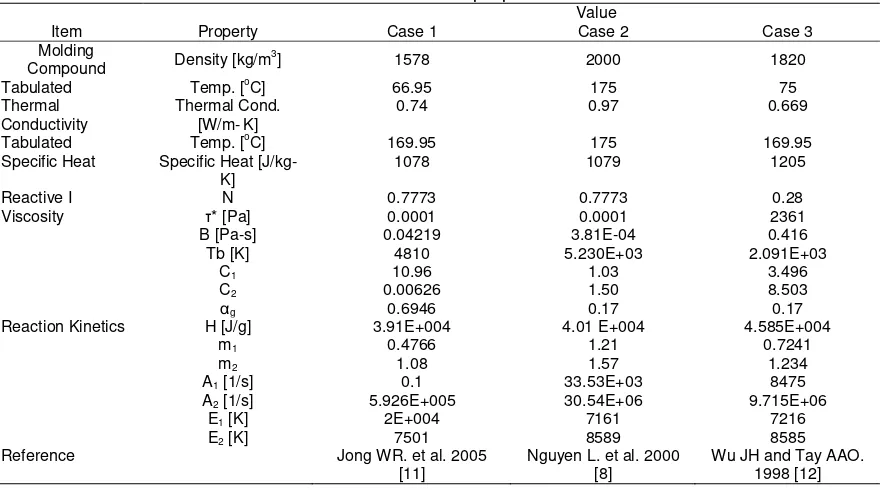
In the encapsulation process, EMC is used as the molding compound. The mould temperature is set as 175 °C and 0.3 m/s of inlet v elocity is applied during the process. Table 1 summarized the material properties of the EMCs that are considered in the current simulation [8], [10-11]. The simulation is performed on an Intel Core 2 Duo processor E7500, 2.93 GHz with 2 GB of RAM; it took around 12 hours for each case to complete 14,000 iterations in time steps of 0.001s [8].
Reaction Kinetics H [J/g] 3.91E+004 4.01 E+004 4.585E+004
m1 0.4766 1.21 0.7241
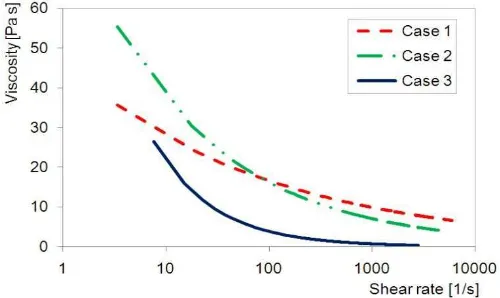
non-uniform flow profiles and viscosity variation during filling process. The behavior of molding compound is also influenced by the filler content. The filler content in the EMC gives the important effect to the warpage trend, and it is dominant in the compound properties [13]. Besides, the type and percentage of filler content also affect the thermal conductivity, thermal expansion coefficient and dielectric constants [14]. The AlN (Aluminum Nitride) filler improved the thermal conductivity until 7-8 times compared with crystalline silica at 70% of EMC volume. Figure 2 illustrates the viscosity variation versus shear rate for three different EMC material properties that were used in the present study. The curves show an exponential relation of viscosity variation where the viscosity reduces with the shear rate. EMC material is used in case 2 shows the higher than viscosity variation, followed by case 1 and case 3.
Pressure distribution during the mold filling process is also important in electronic packaging, especially for the wire bonding and lead frame. Dissimilarity of the pressures may give the undesirable effect to the wire such as serious deformation, failure or fracture; hence, reduce the package reliability. Thus, the pressure distributions during the PBGA encapsulation process are observed in the present study. Pressure distributions contour for case 1, 2 and 3 are shown in Figure 3. The contour colors represent the pressure drop around package during the filling process; higher pressures are observed near the inlet gates and lower pressures around the outlet vent.
The pressure at all locations shows the similar pressure distribution contour for all cases of filling process. From the results, the relationship between pressure and types of EMC are obvious, case 1 with maximum viscosity (as illustrates in Figure 2) the higher pressure distributions. Besides, the pressure around die is found lower compare to pressure nearer to inlet gates. From the simulation analysis, case 1 (Figure 3a) filling process shows the highest pressure with comparing to case 2 (Figure 3b), and case 3 (Figure 3c). This phenomenon is caused by the flow interaction from the different parameter of EMC properties.
Figure 2. Viscosity versus shear rate
Possibility of air trap or incomplete filling in the package is observed in the present study. Three cases of different properties of EMC are used in the analysis. Figure 4 shows the possibility of the air trap or incomplete filling at 14 s of the package for all cases. The circles show in Figure 4 is the location of the high possibility of void formation that causes by air trap or incomplete filling during the process. Case 2 (Figure 4b) is found to be lowest air trap volume during filling process. This is clearly presented in Figure 5, which show fewer and smaller air trap regions for case 2. Decreasing of viscosity may be needed for case 1, case 2 and case 3 to reduce the possibility of the air trap in package. The viscosity of EMC gives the effect of filling process. The results are obtained from simulation analysis show the cases 2 and 3 have higher and faster filled of EMC volume compare with case 1. These filling phenomena are obviously shown in Figure 2 where the EMC with lowest viscosity (case 3) and the changes of the viscosity in case 2 have significantly affected the EMC filling during the encapsulation process.
Figure 4. Comparison of void at 14 s.
Figure 5. Volume of air trap (void) for all cases.
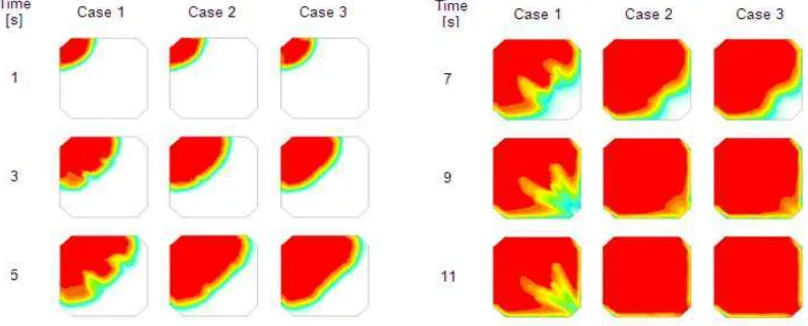
The EMC in this region was retarded. At 7s of filling time, the flow front on the top of the die was concave, while the flow front around was convex. From 9 to 11 s, the EMC completely flowed over the area of the die and the gold wires, and filled the whole cavity. cases 2 and 3 show the faster flow compared with case 1 that is observed at 11s of filling time during the simulation. Comparison of EMC filling volume for three cases with difference parameter is presented in Figure 7.
Figure 6. Simulation comparison between different EMC parameter.
Figure 7. EMC volume of each cases.
3.1 Conversion of the compound
Mold filling of thermoset polymers consists of two competing events, which usually occur simultaneously during the process. These events are: a) reduction of viscosity with shear rate due to non-Newtonian behavior of the polymer fluid and b) increase in viscosity as the results of chemical reaction that occur during thermoset curing [1]. The success of the mold filling process for thermoset polymer relies greatly on the compromise of both events and their dependence on process temperature. The filling must be as fast as possible to take full advantage of the first event; but when it comes to intricate and restricted molding process such as IC package encapsulations, the filling process would not be as smooth as anticipated, due to the second event. This is quite true close to the package region where it is estimated that the melt front velocity is slower enough to cause initiation of the second event. In addition, the slower the fluid flows in these regions; more contact time is available for the compound to absorb heat from the mold surfaces which enhances the degree of conversion as observed in the simulation results.
3.2 Model Validation
This simulation result is substantiated by the experimental results of Chen YR. [15] by using the similar PBGA size, operating condition and material properties as in the present numerical study. The comparison of simulation and experimental results for the melt front profiles is shown in Figure 9. The predictions of flow front profiles and percentage of mold filling are well matching with the experimental results at all stage of filling. The percentage of filled volume at various stages is compared in Figure 9.
Figure 8. Predicted conversion of the mold compound at top of the package for different parameter of material properties at 14 s.
UDFs allow a user to customize FLUENT and can significantly enhance its capabilities. Based on the observation (Figure 9), the experiment and simulation of melt front come to close match with each other except on a number of voids observed in the experiment. The shape of the melt fronts began to diverge as they contact the leading edge of the dies. One melt front is located directly above the dies and the other located on either side of the dies. The effect of dies is clearly shown in the melt fronts. The flow is retarded in this region due to flow resistant, causing the flows in other regions to advance. The results indicate that the simulation's results are in good agreement with the experimental results.
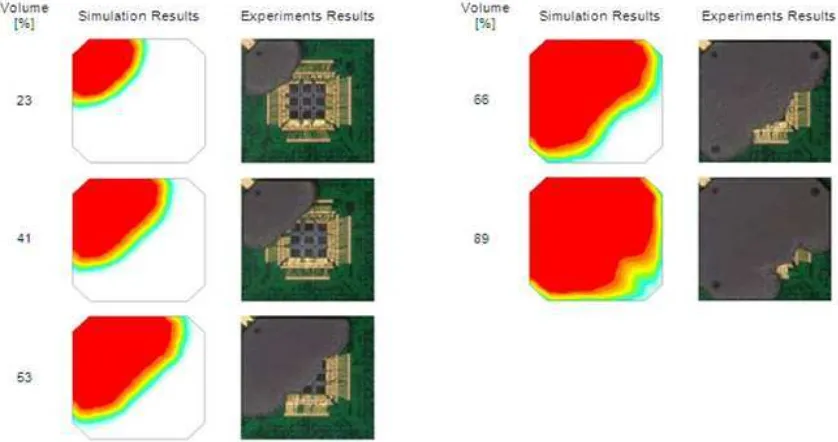
The experimental results of short shot at the different percentage of filled volume are compared with the simulation results. Figure 9 demonstrates to melt front advancement of PBGA for both experimental and simulation results from 23% to 89%. The experimental results were performed by the previous researcher [15]. At initial stage, 23% of EMC filled volume; top view of the current simulation result shows the almost similar flow front profile to the experiment. This is obviously shown in 41% of EMC filled volumes; the simulation result is well matched with the experimental result. For 53 to 66% of EMC filled volume, the flow front on top of the die was concave, while the flow front around was convex. The simulation results show that the flow front on top of the die dropped behind more than the experimental results except that in the middle of the die. The differences with the experimental result might be attributed to the geometric model. The results show the faster flow front at the free region which has no silicon die present. At 89% of EMC filled volume; the material has already covered the half more of the silicon die. In this state, the experimental flow front shows a little difference on the silicon die compared to current result. The flow profile shows a non-uniform curve shape compared to the uniform shape around the silicon die. However, at 66% of filling stage, the good agreement of flow profile is found for both results. The slower flow front is observed in 89% for the experimental result, due to the higher density of wire bonding in the actual package. In overall, the FLUENT prediction gives the better agreement to experimental results.
Figure 10 shows the percentage volume of melt fronts during filling process. The approximate volume of melt fronts is calculated from the experimental work [15] by taking an area melt front. The results also show the comparison between experimental measurement, and numerical simulation has a good agreement.
Figure 10. Comparison between experimental [15] and simulation results of percentage EMC Volume of case 3.
4. Conclusion
The plastic package's encapsulation process is investigated numerically using GAMBIT and FLUENT and validated with the experimental results using FVM based simulation study. The three dimensional PBGA is simulated to study the flow visualization in different parameter of EMC properties of the process. The viscosity of the EMC gives the significant effect to the void formation and flow front profile in the encapsulation process. The variation of the viscosity in case 2 yields lower void formation and filling time compared to cases 1 and 3. However, case 1 with greater viscosity is found higher in pressure distribution than cases 2 and 3. The increases of pressure distribution during the encapsulation process will cause the undesired wire deformation and also fracture at the wire bonding.
The numerical results of melt front patterns and filled volume are compared with the previous experimental results and found in good agreement. This present work is expected to be a reference and guideline for improvement and design consideration in microelectronics industry. Future work will focus on evaluating the impact of various parameters ultimately inputting these correlations into an analytical numerical model for predicting maximum wire displacement.
References
[1]. Ardebiri H, Pecht M. Encapsulation Technologies for Electronic Applications, Elsevier Inc. and William Andrew, USA, 2009; 1-24, 181-188.
[2]. Brand JM, Ruggero SA, Shah AJ. Wire sweep reduction via direct cavity injection during encapsulation of stacked chip-scale packages, Journal of Electronics Packaging, 2008; 130: 011011-1-011011-6.
[3]. Kung HK, Sun YP, Lee JN, Chen HS. A Method to determine the sweep resistance of wire bonds for microelectronic packaging, Microelectronic Engineering, 2008; 85: 1902-1909.
[4]. Abdullah MK, Abdullah MZ, Mujeebu MA, Kamaruddin S. A Study on the effect of Epoxy Molding Compound (EMC) Rheology During Encapsulation of Stacked-CHIP Scale Packages (S-CSP),
Journal of Reinforced Plastics and Composites, 2009; 28(20): 2527-2538.
[5]. Lee MW, Khim JY, Yoo M, Chung JY, Lee CH. Rheological Characterization and Full 3D Mold Flow Simulation in Multi-Die Stack CSP of Chip Array Packaging, Electronics Components and Technology Conference, IEEE, 2006; 1-4244-0152-6/06:1029-1037.
[6]. Khor CY, Abdullah MK, Abdullah MZ, Mujeebu MA, Ramdan D, Majid MFMA, Ariff ZM. Effect of Vertical Stacking Dies on Flow Behavior of Epoxy Molding Compound During Encapsulation of Stacked Chip Scale Packages, Heat Mass Transfer. 2010; 46: 1315-1325.
[7]. Khor CY, Mujeebu MA, Abdullah MZ, Che Ani F. Finite Volume Based CFD Simulation of Pressurized Flip-chip Under fill Encapsulation Process. Journal of Microelectronics Reliability. 2010; 98–105. [8]. Nguyen L, Quentin C, Lee W. Computational Modeling and Validation of the Encapsulation of Plastic
Packages by Transfer Molding. Transaction of the ASME. 2000; 138-146.
[9] Alpern P, Dudek R, Schmidt R, Wicher V, Tilgner R. On the mode II popcorn effect in thin packages,
IEEE Transactions on Components and Packaging Technologies 2002; 25(1): 56 – 65.
[10]. Wang H, Zhou H, Zhang Y, Li D. Stabilized Filling Simulation of Microchip Encapsulation Process,
Microelectronics Engineering, 2010; 87: 2602-2609.
[11]. Jong WR, Chen YR, Kuo TH. Wire density in CAE analysis of high pin count IC packages: Simulation and verification, International Communications in Heat and Mass Transfer. 2005; 32: 1350 – 1359. [12]. Wu JH, Tay AAO. A Three-Dimensional Modeling of Wire Sweep Incorporating Resin Cure. IEEE
Transactions on Components, Packaging and Manufacturing Technology. 1998; 21(1B): 65-72. [13] Yong TP, Yoo KW, Joon KH, Kwang YB. Warpage Analysis of FBGA (Fine Ball Grid Array) Package
by the Altered EMC (Epoxy Molding Compound) Filler Contens, Key Engineering Material, 2006; 306-308: 625-630.
[14] Kim W, Bae JW, Choi ID, Kim YS. Thermally Conductive EMC (Epoxy Molding Compound) for Microelectronic Encapsulation, Polymer Engineering and Science, April 1999; 39(4): 756 - 766. [15]. Chen YR. Mold Flow Simulation and Wire Sweep in IC Encapsulation, Master Thesis, Mechanical

![Figure 10. Comparison between experimental [15] and simulation results of percentage EMC Volume of case 3](https://thumb-ap.123doks.com/thumbv2/123dok/252518.504546/9.595.166.429.449.613/figure-comparison-experimental-simulation-results-percentage-emc-volume.webp)
