2015
Community-Based Practice
Department of Community and
Preventive Medicine
Study Program of Medicine
L I S T 0 F C O N T E N T
List of Module 2
Curriculum of Community Based Practice 3
Planners Team 7
Facilitators 8
Skill Lab Facilitators 9
Reserve Facilitators 9
Time Table 10
Skill Lab Time Table 22
Assessment Method 22
Introduction 23
Module 1 – 18 24
References 98
Annex 1 Film Summary “And the band played on” 99
Annex 2 Artikel Koran Bali Post 104
Annex 3 Artikel jurnal 109
Skill Lab (1-3) 110
L I S T O F M O D U L E
MODULE ~ 1 (Mausner & Bahn, p. 1-42) p. 26
Determinants of Health/Diseases, Natural; History of Diseases and Diseases Prevention
MODULE ~ 2 (Kirkwood and Sterne, chapter 2) p.32
Population, Sample, Data, and Variables
MODULE ~ 3 (Greenberg p. 15-28) p.35
Measurements of Morbidity and Mortality in a Population; Source of Error in Measurements
MODULE ~ 4 (Greenbergp. 51-53) p.40
Crude, Specific and Adjusted Rate
MODULE ~ 5 (Skill Lab Manual, Kirkwood & Sterne, Chapter 2) p. 43
Skill Lab: Data entry, Data Cleaning, and Data Transformation
MODULE ~ 6 (Greenberg, p. 29-43) p.45
Analysis and Interpretation of Descriptive Data
MODULE ~ 7 (Kirkwood & Sterne, Chap 3 &4) p.49
Data Presentation and Data Description
MODULE ~ 8 (Skill Lab Manual, Kirkwood & Sterne) p.54
Skill Lab Data Presentation and Data Interpretation
MODULE ~ 9 (Kirkwood & Sterne, Chap. 5-8, 10, 14, 15) p.55
Inferential Analysis and Interpretation of Analysis Results (Hypothesis Test)
MODULE ~ 10 (Kirkwood & Sterne, Chap. 7, 9, 11, 16, 18, 19) p.59
Significance Test for Categorical and Interval Data
MODULE ~ 11 (Skill Lab Manual, Kirkwood & Sterne) p. 64
Correlation-Regression, Significance Test For Categorical and Interval Data
MODULE ~ 12 (Greenberg, p. 45 – 73) p. 65
Definition, Requirements, Types, and Applications of Surveillance and Outbreaks
MODULE ~ 13 (Greenberg) p. 72
Epidemiology Study to Determine Risk Factor of Disease
MODULE ~ 14 (Greenberg, p. 113-123) p.79
Epidemiology Study Design: Cohort Study
MODULE ~ 15 (Greenberg, p. 127-136) p.83
Epidemiology Study Design: Case – Control Study
MODULE ~ 16 (Greenberg, p.91-113) p. 87
Epidemiology Study Design: Clinical Trial
MODULE ~ 17 (Greenberg, p. 127-136) p. 92
MODULE ~ 18 (Mausner & Bahn, p. 91-110, Greenberg 141-153) p. 95
Variability and Biases
CURRICULUM
Community Based PracticeCompetency Statement
Instructional Goals
Learning Objectives Topics
Use community based-practices to conduct studies that improve diseases
prevention in the community
Demonstrate ability to apply health prevention principles based on risks and determinant factors of health problem
a) Describe several
determinants (models) of diseases and death occurring in the population
b) Explain the applications of understanding
diseases and death determinants (models). c) Identify the strengths and
weaknesses of diseases models.
d) Draw figures of the natural history of a certain disease.
e) Explain the applications of the natural history of a disease for prevention. f) Explain the severity of
diseases in a population and its implication to prevention.
g) Explain the Ice Berg phenomena and its implication in diseases prevention.
h) Describe the level of disease prevention based on determinants and natural history.
Competency Statement
Instructional Goals Learning Objectives Topics
Demonstrate ability to search, organize and interpret information/data from different sources in order to assist in diagnostic, therapeutic and health
a) Explain
measurements of morbidity and mortality in a population. b) Describe the
definitions of population and sample.
c) Explain the conditions required for a
representative sample.
d) Explain several sampling methods. e) Describe types of data
and variables. f) Be able to prepare
software for data entry.
g) Differentiate
proportion, ratio, rate, prevalence and incidence.
h) Explain four types of incidence based on their denominators. i) Describe the source
of numerators and denominators for prevalence and incidence.
j) Explain types of errors in rate calculation.
k) Explain the differences, application, interpretation, and weaknesses of (slide) crude, specific, and adjusted rate. l) Be able to analyze,
and interpret crude, specific and adjusted rate.
Pattern of Morbidity and Mortality Based on Person, Place, and Time
Competency Statement
Instructional Goals Learning Objectives Topics
m) Be able to analyze, present, and interpret descriptive categorical and interval data. n) Be able to analyze
and present data using computers. Be able to interpret the measurements of morbidity and
mortality on samples descriptively.
o) Explain the method to determine disease prognosis from the population (survival analysis).
p) Be able to manage, analyze and interpret data inferentially. q) Describe the
definition,
requirements, types, and applications of surveillance.
r) Be able to conduct an epidemiologic
investigation of an outbreak.
Surveillance and Disease
Demonstrate ability to apply methods to determine risk factors of a disease and effectiveness of diseases intervention/ treatment/ prevention a. Describe epidemiological design, e.g.: cross-section, case-control, and cohort, to
determine risk factors of diseases.
b. Explain the advantages and disadvantages of cross-sectional, case-control and cohort design.
c. Describe the
application of clinical trials to determine the effectiveness of intervention, prevention, and treatment of diseases.
Methods to determine risk factors, effectiveness of treatment, prevention, and intervention of diseases in the community
Competency Statement
Instructional Goals Learning Objectives Topics
d. Be able to describe the differences between descriptive, cross-sectional, case-control, and clinical study design.
e. Describe the concept of patient variability, variability in medical research, variability of measurement, both in individual and
population level. f. Explain internal validity, external validity, selection bias, information bias, and confounding factors. g. Describe sources of
Analyze and interpret data of diseases screening in the community
a. Be able to apply the concept of sensitivity, specificity, and predictive value b. Describe the concept
of cut off points.
Screening of diseases in the community
~ PLANNERS TEAM ~
No Name Department Phone
1 Prof. dr. D.N. Wirawan, MPH (Coordinator) Community/Preventive 0811394306
2 dr. A.A.Sg. Sawitri (Secretary) Community/Preventive 0817340145 3 dr. I.B. Wirakusuma, MOH Community/Preventive 08124696647
4 dr. Ayu Swandewi, MPH Public Health 088113677930
~ FACILITATORS ~
Regular Class (Class A)
No Name Department Phone Group Room Number
1 Dr.rer.Nat. dr. Ni N. Ayu Dewi, M.Si Biochemistry 081337141506 A-1 A.3.09 2 dr. Ni Luh Putu Eka Diarthini,
S.Ked Parasitology 081353077733 A-2 A.3.10
3 Dr. I Gusti Nyoman Sri Wiryawan,
M.Repro Histology 082341768888 A-3 A.3.11
4 I.B. Putra Dwija, S.Si, M.Biotech Microbiology 08179747502 A-4 A.3.12 5 Drs. I Gede Made Adioka, Apt,
M.Kes Pharmacy 081999418471 A-5 A.3.13
6 dr. I Wayan Eka Sutyawan, Sp.M Opthalmology 081338538499 A-6 A.3.14 7 dr. I B Rangga Wibhuti, M.Biomed,
Sp.JP Cardiovascular 081237287888
A-7 A.3.15
8 dr. I Putu Kurniyanta, Sp.An Anaesthesiology 081805755222 A-8 A.3.16
9 DR. Luh Seri Ani, SKM, M.Kes Community/
Preventive 08123924326
A-9 A.3.17
10 dr. Sri Laksminingsih, Sp.Rad Radiology 08164745561 A-10 A.3.19
No Name Department Phone Grou
p NumberRoom
1 Dr. I Putu Adiartha Griadi, M.Fis Phisiology 081999636899 B-1 A.3.09 2 Dr. Komang Ayu Kartika Sari, MPH Community/ Preventive 082147092348 B-2 A.3.10 3 dr. I Nyoman Sutarsa, MPH Community/ Preventive 087860380028 B-3 A.3.11 4 dr. I Nyoman Arcana, Sp.Biok Biochemistry 0811397960 B-4 A.3.12 5 dr. I Made Susila Utama, Sp.PD-KPTI Internal Med 08123815025 B-5 A.3.13 6 dr. I Made Suka Adnyana, Sp.BP Plastic Surgery 081236288975 B-6 A.3.14 7 dr. I Made Sudipta, Sp. THT-KL ENT 08123937063 B-7 A.3.15 8 dr. I Wayan Aryabiantara, Sp.An Anaesthesiology 08123822009 B-8 A.3.16
9 dr. I G Kamasan N. Arijana, M.Si.Med Histology 085339644145 B-9 A.3.17 10 dr. I Made Oka Negara, S.Ked Andrology 08123979397 B-10 A.3.19
Skill Lab Facilitators
No Name Department Phone
1 dr. G.N. Indraguna Pinatih, MSc. Com/Prev 08123816424
2 dr. Wayan Weta, MSc. Com/Prev 081337005360
3 dr. A.A.Sg. Sawitri, MPH Com/Prev 0817340145
4 dr.Putu Ayu Swandewi, MPH Public Health 081338996006 5 dr. Ni Luh Putu Ariastuti, MPH Com/Prev 0818560008 6 dr.I Wayan Gede Artawan EP, M.Epid Public Health 03617848123 7 dr. Komang Ayu Kartika Sari, MPH Com/Prev 082147092348
8 dr. Nyoman Sutarsa, MPH Com/Prev 087860380028
9 dr. Ni Wayan Septarini, MPH Public Health 081353342409 10 dr. Wulan Citra Sucipta, S.Ked Com/Prev 081805570772
Reserve Facilitators
No Name Department Phone
1 dr. A.A.Sg. Sawitri, MPH Com/Prev 0817340145
2 dr. I.B Wirakusuma, MOH Com/Prev 08124696647
5 dr. Wulan Citra Sucipta, S.Ked Com/Prev 081805570772 6 dr. Ni Luh Putu Ariastuti, MPH Com/Prev 0818560008
~ TIME TABLE ~
English Class (B)
Days/date Time Activity Venue Conveyer
1
Thursday 12th of March
08.00 –
09.00 Introductory
Theatre 4th
Floor
dr. A.A.Sg. Sawitri, MPH 09.00 –
10.30 Movie 10.30 –
12.00 Discussion 12.00 –
13.00 Break/lunch
13.00 – 15.00
Independent
learning/Student Project (SP)
2
Friday
13th of March 08.00 –
09.00
Introductory lecture 1
Determinants of morbidity and mortality in a population
Class Room (CR)
3.01 Prof. dr. D.N. Wirawan, MPH
dr. Ni Wayan Septarini, MPH 09.00 –
10.00
Introductory lecture 2
Natural history of diseases
10.00 – 10.30
10.30 – 11.30
Introductory lecture 3
Diseases prevention
11.30 –
12.30 Break/lunch
12.30 – 15.30
SGD : Determinants of morbidity and
mortality in a
population Discussion
Room (DR) SGD : Natural history
of diseases
SGD : Diseases prevention
3
Monday 16th of March
08.00 – 09.00
Student presentation and feedback :
Determinants of morbidity and mortality in a population
CR 3.01
Prof. dr. D.N. Wirawan, MPH
dr. Ni Wayan Septarini, MPH 09.00 –
10.00
Student presentation and feedback : Natural history of diseases
10.00 –
10.30 Break
10.30 – 11.30
Student presentation and feedback : Diseases prevention
11.30 –
12.30 Break/Lunch 12.30 –
15.00 Independent Learning/SP
4
Tuesday
17th of March 08.00 –
09.00
Introductory Lecture
Population, Sample, Data, and Variables
CR 3.01 dr. Putu Ayu Swandewi, MPH
dr. Gd Artawan, M.Epid
09.00 – 10.00
Introductory Lecture
Measurements of Morbidity and Mortality in A
Population; Source of Error dr. Ayu Kartika Sari, MPH dr. Sawitri, MPH
10.00 – 10.30
10.30 – 11.30
Introductory Lecture
Crude, Specific and Adjusted Rate
11.30 –
12.30 Break/Lunch
DR
12.30 – 15.30
SGD : Population, Sample, Data, and Variables
SGD : Measurements of Morbidity and Mortality in A
Population; Source of Error
SGD : Crude, Specific and Adjusted Rate
5
Wednesday 18th of
March
08.00 – 09.00
Student presentation and feedback :
Population, Sample, Data, and Variables
CR 3.01 dr. P. Swandewi, MPH dr. Gede Artawan Eka Putra, M. Epid
09.00 – 10.00
Student presentation and feedback :
Measurements of Morbidity and Mortality in A
Population; Source of Error dr. Ayu Kartika Sari, MPH dr. Sawitri, MPH
10.00 –
10.30 Break
10.30 – 11.30
Student presentation and feedback : Crude, Specific and Adjusted Rate
11.30 –
12.30 Break/Lunch 12.30 –
15.30 Independent Learning/SP
6
Thursday 19th of
March
Skill lab Schedule
Skill Lab
Data Entry, Data Cleaning, and Data Transformation
7
Monday 23th of
March 09.00 – 10.00 Introductory Lecture Analysis and Interpretation of Descriptive Data
CR 3.01 dr.
Wirakusuma, MOH dr. Ariastuti, MPH 10.00 – 11.00 Introductory Lecture
Data Presentation and Data Description
dr. Putu Ayu Swandewi, MPH dr. Gede Artawan Eka Putra, M. Epid 11.00 –
12.00 Independent Learning/SP 12.00 –
13.00 Break/Lunch
13.00 – 15.00
SGD : Analysis and Interpretation of Descriptive Data
DR
SGD : Data
Presentation and Data Description
8
Tuesday 24th of
March
09.00 – 10.00
Student presentation and feedback Analysis and Interpretation of Descriptive Data CR 3.01 dr. Wirakusuma, MOH dr. Ariastuti, MPH 10.00 – 11.00
Student presentation and feedback : Data
Presentation and Data Description
dr. Putu Ayu Swandewi, MPH dr. Gede Artawan Eka Putra, M. Epid 11.00 –
12.00 Independent Learning/SP 12.00 –
13.00 Break/Lunch 13.00 –
15.00 Independent Learning
9
Wednesda y 25th of
March
Skill lab Schedule
Skill Lab
Data Presentation and Data Interpretation
CR 3.01 Skill lab Schedule
10
Thursday 26th of
March
09.00 – 10.00
Introductory Lecture
Inferential Analysis and Interpretation of Analysis Results (Hypothesis Test)
CR 3.01 dr. Putu Ayu Swandewi, MPH
Putra, M. Epid 10.00 –
11.00
Introductory Lecture
Significance Test for Categorical and Interval Data
11.00 –
12.00 Independent Learning/SP 12.00 –
13.00 Break/Lunch
13.00 – 15.00
SGD : Inferential Analysis and Interpretation of Analysis Results (Hypothesis Test) DR SGD :
Significance Test for Categorical and Interval Data
11
Friday 27th of
March
09.00 – 10.00
Student presentation and feedback : Inferential Analysis and
Interpretation of Analysis Results (Hypothesis Test)
CR 3.01 dr. Putu Ayu Swandewi, MPH dr. Gede Artawan Eka Putra, M. Epid 10.00 – 11.00 Student presentation and feedback :
Significance Test for Categorical and Interval Data
11.00 –
12.00 Independent Learning/SP 12.00 – 13.00 Break/Lunch 13.00 – 15.00 Independent Learning/ SP
Days/date Time Activity Venue Lecturers
12
Monday 30th of March
Skill lab Schedule
Skill Lab
Significance Test for Categorical & Interval Data
CR 3.01 Team Skill Lab
13
Tuesday 31st of
March 09.00 – 10.00 Introductory Lecture Definition, Requirements, Types, and Applications of Surveillance and Outbreaks
10.00 – 11.00
Introductory Lecture
Epidemiologic studies to determine risk factors of diseases
dr. A.A.Sg. Sawitri, MPH Dr. dr. Gede Indraguna, SpGK 11.00 – 12.00 Independent Learning/ SP 12.00 –
13.00 Break/Lunch
13.00 – 15.00
SGD :
Definition, Requirements, Types, and Applications of Surveillance and Outbreaks
DR
SGD:
Epidemiologic studies to determine risk factors of diseases
14
Wednesday 1st of April
09.00 – 10.00
Student presentation and feedback
Definition, Requirements, Types, and Applications of Surveillance and Outbreaks
CR 3.01 dr. Ayu Kartika Sari, MPH dr. Ariastuti, MPH 10.00 – 11.00
Student presentation and feedback Epidemiologic studies to determine risk factors of diseases
CR 3.01 dr. A.A.Sg. Sawitri, MPH Dr. dr. Gd. Indraguna, Sp.GK 11.00 – 12.00 Independent Learning/ SP 12.00 – 13.00 Break/Lunch 13.00 – 15.00 Independent Learning/ SP 15 Thursday 2nd of April
09.00 – 10.00
Introductory Lecture
Epidemiology Study Design: Cohort Study
CR 3.01 dr. Nyoman Sutarsa, MPH dr. Ariastuti, MPH 10.00 – 11.00 Introductory Lecture Epidemiology Study Design: Case Control Study
13.00 – 15.00
SGD :
Epidemiology Study Design: Cohort Study
DR
SGD :
Epidemiology Study Design: Case Control Study
16
Monday 6th of April
09.00 – 10.00
Student presentation and feedback Epidemiology Study Design: Cohort Study
CR 3.01 dr. Nyoman Sutarsa, MPH, dr. Ariastuti, MPH 10.00 – 11.00 Student presentation and feedback :
Epidemiology Study Design: Case Control Study CR 3.01 11.00 – 12.00 Independent Learning/ SP 12.00 – 13.00 Break/Lunch 13.00 – 15.00 Independent Learning/ SP 17 Tuesday 7th of April
09.00 – 10.00
Introductory Lecture
Applications of Clinical Trials to Determine the Effectiveness of Intervention, Prevention, and Treatment of Diseases
CR 3.01 dr. A.A.Sg. Sawitri, MPH Dr. dr. Gd Indraguna, SpGK 10.00 – 11.00 Introductory Lecture Screening and Diagnostic Testing
13.00 – 15.00
SGD:
Applications of Clinical Trials to Determine the Effectiveness of
Intervention, Prevention, and
Treatment of Diseases Epidemiology Study Design: Case Control Study DR SGD Screening and Diagnostic Testing DR 18 Wednesday 8th of April
09.00 – 10.00
Student presentation and feedback: Applications of Clinical Trials to Determine the Effectiveness of Intervention, Prevention, and Treatment of Diseases
CR 3.01 dr. A.A.Sg. Sawitri, MPH Dr. dr. Indraguna, SpGK 10.00 – 11.00
Student presentation and feedback : Screening and Diagnostic Testing
CR 3.01 dr. Gede Artawan Eka Putra, M. Epid dr. A.A.Sg. Sawitri, MPH 11.00 – 12.00 Independent Learning/ SP 12.00 – 13.00 Break/Lunch 13.00 –
15.00 Independent Learning
19
Thursday 9th of April
09.00 – 10.00
Introductory Lecture
Variability and bias
CR 3.01 dr. A.A.Sg. Sawitri, MPH Dr. dr. Indraguna, SpGK 10.00 – 11.00
SGD: Variability and bias DR 11.00 – 12.00 Independent Learning/ SP 12.00 – 13.00 Break/Lunch 14.00 –
15.00 Independent Learning
20
Friday 10th of April
09.00 – 10.00
Student presentation and feedback
Variability and bias
CR 3.01 dr. A.A.Sg. Sawitri, MPH Dr. dr. Indraguna, SpGK 10.00 –
Team 13.00 –
14.00 Break/Lunch 14.00 –
15.00 Independent Learning
21 Saturday 11th of
April
Preparation for Final Test
22 Monday
13th of April
09.00 – 11.00
Assessment Will be
arranged later
Team Resource Person And Facilitators
~ TIME TABLE ~
Regular Class (A)
Days/date Time Activity Venue Conveyer
1
Thursday
08.00 – 09.00
Introductory Theatre Room 4th Floor
12th of
March
09.00 –
10.30 Movie 10.30 –
12.00
Independent learning / Student Project (SP) 12.00 –
13.00 Break/lunch 13.00 –
15.00 Discussion
2
Friday 13th of
March
08.00 –
11.30 Independent learning /SP
Class Room (CR) 3.01
Prof. dr. D.N. Wirawan, MPH
dr. Ni Wayan Septarini, MPH 11.30 –
12.30 Break/lunch
12.30 – 13.30
Introductory lecture 1
Determinants of morbidity and mortality in a population
13.30 – 14.30
Introductory lecture 2
Natural history of diseases
14.30 – 15.30
Introductory lecture 3
Diseases prevention 3
Monday 16th of
March 08.00 – 11.00
SGD : Determinants of morbidity and
mortality in a population
Discussion Room (DR) SGD : Natural history
of diseases
SGD : Diseases prevention
11.00 –
12.00 Break/Lunch 12.00 –
15.00
Student presentation and feedback :
Determinants of morbidity and mortality in a population
CR 3.01
Prof. dr. D.N. Wirawan, MPH
dr. Ni Wayan Septarini, MPH Student presentation
and feedback : Natural history of diseases
4
Tuesday 17th of
March
08.00 – 11.30
Independent learning /SP
11.30 – 12.30
Break/lunch
12.30 – 13.30
Introductory Lecture
Population, Sample, Data, and Variables
CR 3.01
dr. Putu Ayu Swandewi, MPH
dr.
G.Artawan, M.Epid
13.30 – 14.30
Introductory Lecture
Measurements of Morbidity and Mortality in A
Population; Source of Error dr. Ayu Kartika Sari, MPH dr. Sawitri, MPH
14.30 – 15.30
Introductory Lecture
Crude, Specific and Adjusted Rate
5
Wednesda y18th of
March
08.00 – 11.00
SGD : Population, Sample, Data, and Variables
DR
SGD : Measurements of Morbidity and Mortality in A
Population; Source of Error
SGD : Crude, Specific and Adjusted Rate
11.00 –
12.00 Break/lunch
12.00 – 13.00
Student presentation and feedback : Population, Sample, Data, and Variables
CR 3.01 dr. Putu Ayu Swandewi, MPH
dr. Artawan, MEpid
13.00 – 14.00
Student presentation and feedback :
Measurements of Morbidity and Mortality in A
14.00 – 15.00
Student presentation and feedback : Crude, Specific and Adjusted Rate
6
Thursday 19th of
March
Skill lab Schedule
Skill Lab
Data Entry, Data Cleaning, and Data Transformation
CR 3.01 Skill Lab Team
7
Monday 23th of
March 09.00 – 12.00 Independent Learning/SP 12.00 – 13.00 Break/lunch 13.00 – 14.00 Introductory Lecture Analysis and Interpretation of Descriptive Data
CR 3.01 dr.
Wirakusuma, MOH
dr. Ariastuti, MPH
14.00 – 15.00
Introductory Lecture
Data Presentation and Data Description
dr. Putu Ayu Swandewi, MPH
dr. Gede Artawan Eka Putra, M. Epid
8
Tuesday 24th of
March
09.00 – 11.00
SGD : Analysis and Interpretation of Descriptive Data
DR
SGD : Data
Presentation and Data Description
11.00 –
12.00 Independent Learning/SP 12.00 –
13.00 Break/Lunch
13.00 – 14.00
Student presentation & feedback: Analysis and Interpretation of Descriptive Data CR 3.01 dr. Wirakusuma, MOH dr. Ariastuti, MPH
14.00 – 15.00
Student presentation & feedback: Data
Presentation and Data Description
dr. Putu Ayu Swandewi, MPH
9
Wednesd ay 25th of
March
Skill lab Schedule
Skill Lab
Data Presentation and Data Interpretation
CR 3.01 Skill lab Schedule
10
Thursday 26th of
March
09.00 –
12.00 Independent learning /SP
CR 3.01 dr. Putu Ayu Swandewi, MPH
dr. Gede Artawan Eka Putra, M. Epid 12.00 – 13.00 Break/Lunch 13.00 – 14.00 Introductory Lecture Inferential Analysis and Interpretation of Analysis Results (Hypothesis Test)
14.00 – 15.00
Introductory Lecture
Significance Test for Categorical and Interval Data
11
Friday 27th of
March
09.00 – 11.00
SGD : Inferential Analysis and Interpretation of Analysis Results (Hypothesis Test) DR SGD :
Significance Test for Categorical and Interval Data 11.00 – 12.00 Independent Learning/SP 12.00 – 13.00 Break/Lunch 13.00 – 14.00
Student presentation and feedback : : Inferential Analysis and
Interpretation of Analysis Results (Hypothesis Test)
CR 3.01 dr. Putu Ayu Swandewi, MPH
dr. Gede Artawan Eka Putra, M. Epid
14.00 – 15.00
Student presentation and feedback : Significance Test for Categorical and Interval Data 12
Monday 30th of
March
Skill lab
Schedule Skill LabSignificance Test for Categorical & Interval Data
CR 3.01 Team Skill Lab
13
Tuesday
09.00 – 12.00
31st of March 12.00 – 13.00 Break/Lunch 13.00 – 14.00 Introductory Lecture Definition, Requirements, Types, and Applications of Surveillance and Outbreaks
CR 3.01 dr. Ayu Kartika Sari, MPH
dr. Sawitri, MPH
14.00 – 15.00
Introductory Lecture
Epidemiologic studies to determine risk factors of diseases
dr. A.A.Sg. Sawitri, MPH Dr. dr. Indraguna, SpGK 14 Wednesd ay 1st of April
09.00 – 11.00
SGD :
Definition, Requirements, Types, and Applications of Surveillance and Outbreaks
DR
SGD:
Epidemiologic studies to determine risk factors of diseases 11.00 – 12.00 Independent Learning /SP 12.00 – 13.00 Break/Lunch 13.00 – 14.00
Student presentation and feedback : Definition, Requirements, Types, and Applications of Surveillance and Outbreaks
CR 3.01 dr. Ayu Kartika Sari, MPH
dr. A.A.Sg. Sawitri, MPH
14.00 – 15.00
Student presentation and feedback : Epidemiologic studies to determine risk factors of diseases
CR 3.01 dr. A.A.Sg. Sawitri, MPH Dr. dr. Indraguna, SpGK 15 Thursday 2nd of April
09.00 – 12.00 Independent Learning /SP 12.00 – 13.00 Break/Lunch 13.00 – 14.00 Introductory Lecture Epidemiology Study Design: Cohort Study
MPH 14.00 –
15.00
Introductory Lecture
Epidemiology Study Design: Case Control Study
16
Monday 6th of April
09.00 – 11.00
SGD :
Epidemiology Study Design: Cohort Study
DR
SGD :
Epidemiology Study Design: Case Control Study 11.00 – 12.00 Independent Learning /SP 12.00 – 13.00 Break/Lunch 13.00 – 14.00
Student presentation and feedback :
Epidemiology Study Design: Cohort Study
CR 3.01 dr. Nyoman Sutarsa, MPH dr. Ariastuti, MPH
14.00 – 15.00
Student presentation and feedback :
Epidemiology Study Design: Case Control Study
CR 3.01
17
Tuesday 7th of April
09.00 –
12.00 Independent learning /SP 12.00 – 13.00 Break/Lunch 13.00 – 14.00 Introductory Lecture Applications of Clinical Trials to Determine the Effectiveness of Intervention, Prevention, and Treatment of Diseases
CR 3.01 dr. Sawitri, MPH
Dr. dr. Indraguna, SpGK
14.00 – 15.00
Introductory Lecture
Screening and Diagnostic Testing
CR 3.01 dr. Artawan Eka Putra, M. Epid
18
Wednesday 8th of April
09.00 – 11.00
SGD:
Applications of Clinical Trials to Determine the Effectiveness of
Intervention, Prevention, and
Treatment of Diseases
DR SGD Screening and Diagnostic Testing DR 11.00 –
12.00 Independent Learning/SP 12.00 –
13.00 Break/Lunch
13.00 – 14.00
Student presentationand feedback: Applications of Clinical Trials to Determine the Effectiveness of Intervention, Prevention, and Treatment of Diseases
CR 3.01 dr. A.A.Sg. Sawitri, MPH Dr. dr. Indraguna P
14.00 – 15.00
Student presentation and feedback : Screening and Diagnostic Testing
CR 3.01 dr. Artawan Eka Putra, M. Epid dr. A.A.Sg. Sawitri, MPH 19 Thursday 9th of April
09.00 –
12.00 Independent Learning/SP
CR 3.01 dr. A.A.Sg. Sawitri, MPH Dr. dr. Indraguna P 12.00 – 13.00 Break/Lunch 13.00 – 14.00 Introductory Lecture
Variability and bias
14.00 – 15.00
SGD: Variability and bias
DR
20
Friday 10th of April
09.00 –
12.00 Independent learning /SP
CR 3.01 dr. A.A.Sg. Sawitri, MPH Dr. dr. Indraguna P 12.00 – 13.00 Break/Lunch 13.00 – 14.00 Student presentation
(SP) and feedback : Variability and bias
14.00 – 16.00
Presentation of student project and feed back
21 Saturday 11th of
April
22 Monday
13th of April
09.00 – 11.00
Assessment Will be
arranged later
SKILL LAB TIME TABLE (Regular and English Class)
Date: 1. Thursday 19th March 2015
2. Wednesday 25th March 2015
3. Monday 30th March 2015
No Class Group SGD Activity Time/Place
1 English I, II, III, IV, V Skill Lab/ pleno 08.00 – 09.30 / Class room 2 English VI, VII, VIII, IX, X Skill Lab/ pleno 09.30 – 11.00 / Class room
Break/Lunch 11.00 – 12.00 WITA
3 Regular I, II, III, IV, V Skill Lab/ pleno 12.00 – 13.30 / Class room
4 Regular VI, VII, VIII, IX, X Skill Lab/ pleno 13.30 – 15.00 / Class room
Guidance:
1. Each student is required to bring their own lap-top and has installed the SPSS program in to their laptop.
2. Data for practising will be provided before the first skill lab. Each head of the SGD have to contact dr. Putuariastuti or dr. Citra to ask for those files.
3. Skill Lab Guide is provided on the Anexes. Remember to bring your study guide every day.
ASSESSMENT METHOD
Student assessment of this block consists of:
1. a paper test with multiple choice questions at the end of block with proportion 80% of total score
2. a student project with proportion 15% of total score
INTRODUCTION
A movie “And the Band Played On” will be played after introduction session in theatre room 4th floor. Every student should pay attention and carefully watch the movie because proper understanding of the movie is needed to answer learning task question below. The summary of this movie can be seen in the Annex 1 of the Study Guide.
Learning task
Based on the movie “And The Band Played On”, you are required to discuss in your group the following questions:
1. Please explain about steps to discover the cause of AIDS based on this movie. Which one was started first, the lab investigation or epidemiology investigation to find out the cause of AIDS?
2. How were the roles of the following fields shown in the movie a. Statistic
b. Clinical c. Social
d. Epidemiology e. Virology
3. Please explain which part of the movie explained the types of social and political threats that influenced the investigation to find out the cause of that mysterious disease
4. Please explain which part of the movie showed ethics and professional aspects
M O D U L E ~ 1
(Reference Maussner & Bahn, p. 1-42)
Determinants of Health/Diseases, Natural History of
Diseases and Diseases Prevention
Prof. dr. Dewa Nyoman Wirawan, MPH & dr. Ni Wayan Septarini, MPH
AIMS:
To be able to describe determinants, the natural history of diseases and death occurring in the population and diseases prevention
LEARNING OUTCOMES:
1.
Describe several determinants (models) of diseases and death occurring in the population.2.
Explain the applications of understanding diseases and death determinants (models).3.
Identify the strengths and weaknesses of diseases models.4.
Draw figures of the natural history of a certain disease.5.
Explain the applications of the natural history of a disease for prevention.6.
Explain the severity of diseases in a population and its implication to prevention.7.
Explain the Ice Berg phenomena and its implication in diseases prevention.8.
Describe the level of disease prevention based on determinants and natural historyCURRICULUM CONTENTS:
1. Determinants (models) of diseases and death occurring in the population. 2. Natural history of certain disease and applications for prevention.
ABSTRACTS
In this lecture the difference approaches of community medicine and clinical medicine are discussed. In clinical medicine, concern is to individual patients who are visit health providers. In community or population medicine concern is to whole population, either sick or healthy in certain geographical area. Community medicine or public health focuses on prevention of diseasesin the population, whereas clinical medicine focuses on treating sick individual patients who come to health providers.
In order to provide appropriate treatments to individual patients, the diagnosis of her/his disease must be established. Similar approach must be established in community medicine. In order to provide appropriate preventions, determinants of health problems in the community must be understood.
To understand determinants or factors which influence the occurrence of diseases in the population, some epidemiological models or theories are discussed in this lecture. Each model has its strengths and weaknesses. There is no single model which is appropriate to explain determinants of all diseases occurrence. Triangle model which was first introduced, explained that the occurrence of diseases in the population is determine by agent, host and environments. Wheel model focused on intrinsic (host factors) and extrinsic (environments factors). Model which was introduced by Blum explained that the occurrence of diseases in the population determine by genetic, behaviour, health programs and environments. Web model explained that a determinant of diseases occurrence in the population is not simple but interrelated of many factors. There are many other models which explain determinants of diseases but not discussed in this lecture.
Beside determinants of diseases occurrence, appropriate prevention also depends on the natural history of the disease. For example, disease where the cause is well established such as HIV/AIDS, has long incubation period and fatal, the focus of prevention are primary prevention such as behavior change educations, secondary prevention such as voluntary HIV testing (VCT) and tertiary prevention such as care support and treatments of secondary (opportunistic) infections. On the other hand, if the cause of disease is not known such as cancers, focus of preventions is secondary and tertiary preventions. Other disease such as dengue fever, which is acute, no vaccine available and no treatments to kill the virus, the focus of prevention is on primary preventions.
SELF DIRECTING LEARNING:
Basic knowledge and its application that students must know, include: 1. Disease’s model
SCENARIO& LEARNING TASKS
Guidelines:
a) During small group discussion (SGD), each group has to select a spokesperson, who will be presenting the results of discussions at the plenary
b) Prior to the plenary, the spokesperson of each group sits in front of the class c) Read carefully the learning tasks (1)and(2) below.
d) Each group have to discuss at least 4 (four) learning tasks below which are learning task (1) and three learning task(2) from (a) to (e)
e) Each group must present three learning tasks in the plenary.
f) Before the plenary start, every SGD has already put the file of the answer in the class’ computer/CPU
g) Learning task (3) is additional task, however, all of the students MUST watch the movie carefully in order to be able to answer learning task in day 2.
SGD : DETERMINANTS OF
HEALTH
/ DISEASES
Case 1.
Please watch carefully a short video clip on: (you can watch it at your home before the lecture)
http://www.youtube.com/watch?v=5Lul6KNIw_8
Learning Tasks 1:
After you carefully watch the video, please discuss the following questions:
1. What factors that influence health mentioned in this video clip? 2. Which model/s of disease morbidity is/are being use?
3. What interventions are being conducted in the two examples given on the clip? What are the focuses of the interventions for each case?
Case 2
Please watch carefully as well:
http://www.youtube.com/watch?v=mMDUv2R6tHQ
Learning Tasks 2
1. What is the main topic of the conversation?
Learning Tasks 3
Discuss the following in your group:
a) The high morbidity and mortality due to dengue hemorrhagic fever (DHF) is influenced by many factors (determinants). Discuss these factorsusing Wheels Model. Explain also the most dominant factor.
b) 1. The high incidence of morbidity (morbidity rate) due to traffic accidents are influenced by many factors (determinants). Discuss in groups these factors using Web Model. Explain the most dominant factor.
2.The high mortality rate due to traffic accidents are also influenced by many factors (determinants). Discuss in groups these factors using Blum Model. Explain also the most dominant factor.
c) The high morbidity and mortality due to tuberculosis (TB) are influenced by many factors (determinants). Discuss in groups these factors using Triangle Model. Explain also the most dominant factor.
d) The high morbidity and mortality caused by HIV-AIDS are influenced by many factors (determinants). Discuss in groups these factors usingBlum and Triangle Model. Explain also the most dominant factor.
e) The high morbidity and mortality of children under 5 year olds in the community is influenced by many factors (determinants). Discuss these factors by using Mosley Model. Explain also the mechanisms between these factors by considering the direction of the lines in the Mosley Model.
Learning Tasks 4:
1. At the end of the lecture, each SGD group should give the lecturer a USB with capacity minimum 8 gb.
2. A movie “The Contagion” will be transfered to the USB and the USB will be returned during plenary. This movie will be discussed on the surveillance and disease’s outbreak topic
SGD :
NATURAL HISTORY OF DISEASES
Guidelines:
2. Prior to the plenary, the spokesperson of each group sits in front of the class
3. Read carefully the learning tasks (a) to (c) below.
4. Each group has to discuss all of the learning tasks below.
5. Before the plenary start, every SGD has already put the file of the answer in the class’ computer/CPU
LEARNING TASK
a) Discuss the natural history, primary, secondary and tertiary prevention of HIV-AIDS using a diagram.
b) Discuss the natural history, primary, secondary and tertiary prevention of denguehemorrhagic fever (DHF) using a chart.
Please refer to: http://www.medscape.com/viewarticle/725639_2
SGD :
DISEASES PREVENTION
Guidelines:
a) During small group discussion (SGD), each group has to select a spokesperson, who will be presenting the results of discussions at the plenary
b) Prior to the plenary, the spokesperson of each group sits in front of the class c) Read carefully the learning tasks (a) to (c) below.
d) Each group has to discuss all of the learning tasks below.
e) Before the plenary start, every SGD has already put the file of the answer in the class’ computer/CPU
LEARNING TASK
Please take a look this PDF file below before answering the following task:
http://www.euro.who.int/__data/assets/pdf_file/0004/129532/Ottawa_Charter.pdf
All the answers for the following task must also refer/consider to “Ottawa Charter” as explained on the above file.
a) Discuss the natural history, primary, secondary and tertiary prevention of tuberculosis.
Please refer to the following website:
http://www.uphs.upenn.edu/bugdrug/antibiotic_manual/iuatld_tb_manual_for_me dical_students.pdf
Please refer to the following website:
http://www.jped.com.br/conteudo/00-76-s285/ing.pdf
c) Please refer to the following website:
http://depts.washington.edu/epidem/Epi583/MockLancet.pdf
Please discuss the natural history, primary, secondary and tertiary prevention of traffic accident
Self assessment
1. Explain the determinant factor of diseases occurrence by using the Epidemiological Triangle, the Wheels and the Blum models!
2. A part of the Blum model is the health care factor. If you use the Wheel model, into which factor that factor should be included?
3. The other part of the Blum model is behaviour factor. If you use the Wheel model, that factor should be included into which factor? And if you use the Epidemiological Triangle model, how should you place the behaviour factor?
4. What are the differences between the natural history of HIV/AIDS, DHF, and coronary disease or stroke?
5. Why is it very important to understand the determinant and the natural history of certain diseases in a population?
6. The level of prevention consists of primary preventions, including health promotion (behaviour change & policy/regulation) and specific protection, secondary prevention (early detection and prompt treatment), and tertiary prevention (disability limitation and rehabilitation). Explain which prevention will be effective for the following diseases/incidents: DHF, HIV/AIDS, diarrheal, traffic accident, coronary heart disease, stroke, tuberculosis (TBC), and avian influenza.
7. The health promotion is actually “health education plus” which consists of health education (or behaviour intervention) and structural intervention (or policy/regulation). Give examples of behaviour intervention and policy/regulation to reduce death due to traffic accident, to decrease deficiency of energy and protein (under nutrition) and certain diseases caused by smoking behaviour.
M O D U L E ~ 2
(Reference Kirkwood and Sterne, chapter 2)
Population, Sample, Data, and Variables
dr. Putu Ayu Swandewi, MPH & dr. Gede Artawan Eka Putra, M.Epid
AIM:
Demonstrate ability to search, collect, organize and interpret information/data from different sources in order to assist in diagnostic, therapeutic and health.
LEARNING OUTCOMES:
a) Describe the definitions of population and sample.
b) Explain the conditions required for a representative sample. c) Explain several sampling methods.
d) Describe types of data and variables. e) Describe several method of data collection
CURRICULUM CONTENTS:
Population, Sample, Data, and VariablesABSTRACT
Population is a group in whom the result of certain study can be applied;while sample is part of the population that should represent its population. Two requirements for sample to be representative are concerning on samples size and sample selection.
Sample allocation can be used if we need more than one group of sample. The easiest way is block allocation. We can also use allocation of simple random sampling, stratified allocation, and systematic allocation.
SCENARIO:
Case 1.
Study on Maternal and Child Health
The study was conducted in two phase; 1) household survey to determine the under five years health status and 2) Quasi Experimental study to explore the effect of food supplementation program toward the improvement of nutritional status
First Phase
A household survey was conducted to explore under five years child’s health status at Desa Merdeka in 2011. The objective of the study was to determine several factors that associated with anemia and chronic malnutrition among children in the area. The area has two different characteristics which are easy to reach area (easy) and hard to reach area (hard). The condition of both areaswas suggested to be considered since there might be different characteristics of the family; hence, the samples were randomly selected from both areas.
The subjects of the study were all five under five years old children. Children from the family who are no longer residing in the area were excluded from the study and those with incomplete data were excluded during data analysis. List of the children were withdrawn from the register at the village leader office.
Data collection was performed by interview using structured questionnaire with the mothers and measurement of the children. The characteristics that were explored and measured include: mothers’ and children’s demographic characteristic, haemoglobin level and body weight. More specifically, the variables in the study were ID, name, area, mothers’ age, education, occupation; history of exclusive breastfeeding, parity; and children’s weight, age, hemoglobin level, body weight and height. The hemoglobin level measured with HemoCue, and body weight measured with digital scale. Anemia status was determined when Hb level less than 11 mg/dl and undernourished determined when BMI less than 11kg/m2
Second Phase
Learning Task 1:
You are required to discuss the following questions, based on the study:
1. Explain the definition of population (target population and sampled population) and sample!
From each study phase of the case above describe: 1. Target population of the study
2. Sampled population of the study
3. Discuss what are the different between target and sampled population
2. Discuss the reason of taking sample rather than observed all population and the requirement of a good sample?
3. Discuss several conditions for samples to represent the population (to be representative)!
4. Discuss the meanings and objective of inclusion criteria, exclusion criteria, and drop out criteria?
Base on the case study above, for each phase, describe: 1. What are the inclusion criteria for the study
2. What are the exclusion criteria for the study 3. What are the drop out criteria for the study
5. Explain the indication and the technique for sampling methods below
1. Simple random, stratified random, systematic random, multi-stage random, cluster,
2. Quota, convenience, purposive, and “snow-balling technique”
3. Based on the case study above, what is the sampling method of the study? 6. Based on the case above (phase 1), describe about sampling frame for the study.
What is the importance of constructing a sampling frame and when it is not possible to be constructed?
7. Explain several important parts in sample size calculation including variability, design,
power (1-), level of significance (), effect size or precision or margin of error. a. Draw the relationship between variables above
b. Classify the variables based on their function
8. a. Explain the classification of variables based on the level of measurement
b. Among the variables on the study above, classify them based on the level of measurement
9. Describe method of data collection that have been applied on the case study above.
Self Assessments:
2.
What are the conditions required for a representative sample?3.
Explain several sampling methods: simple random, proportional, multistage, stratified, systematic, cluster, quota, consecutive, incidental, purposive, and “ snow-balling technique”!4.
What is the meaning of exclusion criteria? What is the purpose of excluding some population characteristics?M O D U L E ~ 3
(Reference Greenberg p. 15-28 & Gordis, p. 37-83)
Measurements of Morbidity and Mortality in a
Population; Source of Error in Measurements
dr. Ayu Kartika Sari, MPH & dr. A.A.Sg. Sawitri, MPH
AIMS
To demonstrate ability to search, collect, organize and interpret information/data from different sources in order to assist in diagnostic, therapeutic and health.
LEARNING OUTCOMES:
At the end of the module, students should be able to:
1.
Explain measurements of morbidity and mortality in a population.2.
Differentiate proportion, ratio, rate, prevalence and incidence.3.
Explain four types of incidence based on their denominators.4.
Describe the source of numerators and denominators for prevalence and incidence.5.
Explain types of errors in rate calculation.6.
Explain the differences, application, interpretation, and weaknesses of (slide) crude, specific, and adjusted rate.7.
Analyze, and interpret crude, specific and adjusted rate.CURRICULUM CONTENTS:
1. Measurements of Morbidity and Mortality in a Population 2. Crude, Specific and Adjusted Rate
1. Read previous lectures regarding the natural history of diseases.
2. Read Handout 1, p. 62–68, Greenberg, p. 47-53, Gordis, p. 37-83, and power point slides.
ABSTRACTS
As a medical doctor, either in a clinic or in a public health setting, we will face many problems in a field work which relate to rate, ratio, and proportion. A clinician will certainly consider rate in diagnosing and predicting the fatality or prognosis of a certain disease, a clinician will certainly use rate. Meanwhile, a public health doctor will apply rate, ratio, and proportion to either diagnose a community problem or to evaluate a health program.
Rate, ratio, and proportion, are measurements used to describe the situation, condition, or even a problem among population. Each measurement has specific characteristics and applications. Ratio which is a comparison between 2 independent numbers is usually used for management purpose. Proportion is a comparison between numerator and denominator in which the numerator is included in the denominator. Lastly, rate is a proportion which has population at risk as the denominator. The understanding on measurement characteristics is needed due to giving specific interpretation based on the situation and purpose of measurement.
SCENARIO & LEARNING TASK
Case 1.The Jakarta Post, Jakarta | National | Tuesday, December 31 2013, 7:33 PM
http://www.thejakartapost.com/news/2013/12/31/36000-people-with-hivaids-receive-arv-therapy-throughout-2013.html
36,000 people with HIV/AIDS receive ARV therapy throughout 2013
As many as 36,483 people living with HIV/AIDS (ODHA) have received antiretroviral (ARV) treatment in 2013, up from 2,381 in 2005, a senior health official has said.
However, he said, the ministry also found that the number of early detected HIV cases had continuously increased. In 2013, 20,397 people were recorded as having been infected with HIV, up from 895 in 2005.
Meanwhile, the number of AIDS patients reached 2,763 as of September, down from 4,987 in 2005.
“The Case Fatality Rate (CFR) has also dropped to 0.85 percent as of September from
13.65 percent in 2004,” said T.
The Health Ministry has been intensively carrying out HIV/AIDS control and prevention programs by, among other measures, putting together a national guideline and training modules for health workers such as Training of Trainers (ToT) on Voluntary Counseling and Testing (VCT), which is followed up with VCT as well as Care and Support and Treatment (CST) training sessions.
Learning Task 1
You are required to discuss the following questions, based on the study above.
1.
What is the type of measurement underlined in the above case?2.
What is the weakness of that measurement when it is applied to diagnose community health problem?3.
Do you think that measurement is still important to be used in the above case? Please give a reason!4.
Please interpret the data of case fatality rate mentioned in the above case! What is the importance of this rate to clinician?5.
What are the differences between Case Fatality Rate and Cause Specific Death Rate?Case
2
.
Mapping Injecting Drug Users Activity in Bali
Learning Task 2
You are required to discuss the following questions, based on the study above 1. What is the type of measurement presented in the case above??
2. What is the weakness of that measurement when it is applied to diagnose community health problem? Explain your answer!
3. If you want to present the data in the form of relative number, which type will be most appropriate: proportion, prevalence, or incidence?
4. What is the interpretation of 77.6% at above?
5. When there was a total of 550 reported active IDUs, how many of them were possibly using tranquilizer?
6. What are the possibilities of biases of your estimation at number (5)? Provide your reasons!
Case
3
.
Survey of Tuberculosis in Bali, 2010
[image:43.612.88.528.443.619.2]Bellow is the result of TB survey in Bali in the end of 2009 (Table 1) that was conducted by the team of Udayana University. The survey was conducted to total available public health centers (120 PHCs) in Bali and 3 main hospitals (RS Sanglah, RS Wangaya, and RS Buleleng). To complete the analysis of the study, researcher took data of population from the Bali Provincial Statistic Office (Table 2).
Table 1. Number of TB cases in Bali
No Sub-province Frequency Proportion Rate
1. Buleleng 165
2. Jembrana 73
3. Tabanan 57
4. Badung 119
5. Denpasar 312
6. Gianyar 73
7. Bangli 28
8. Klungkung 57
9. Karangasem 116
Total 1000
Source: HIV prevalence among TB patients in Bali, 2009
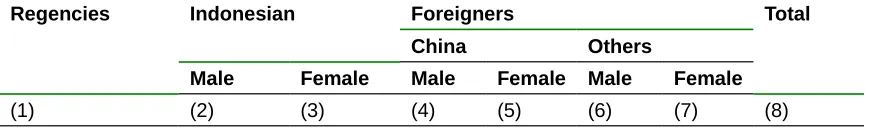
Table 2 Number of population in Bali, Based on District and Nationality at 2010
Regencies Indonesian Foreigners Total China Others
Male Female Male Female Male Female
[image:43.612.90.537.655.720.2]1. Jembrana 136.063 136.757 4 1 2 1 272.828
2. Tabanan 214.260 216.884 0 0 19 9 431.172
3. Badung 197.167 195.619 0 1 161 72 393.020
4. Gianyar 199.973 199. 607 15 11 22 32 399.660
5. Klungkung 91.067 94.201 0 0 4 0 185.272
6. Bangli 107594 108.135 0 0 0 0 215.729
7. Karangasem 219.591 218.883 0 1 0 0 438.475
8. Buleleng 331.931 330.907 16 17 28 21 662.920
9. Denpasar 262.362 260.476 0 0 277 184 523.299
2010 1.760.008 1.761.469 35 31 513 319 3.522.375 Source: Bali Provincial Statistic Office, 2010
Learning Task
3
You are required to discuss the following questions, based on the study above
1. Fill in the proportion and the rate based on the above data. What is the interpretation?
2. What is the difference between the proportion and rate at the above? Which one is the appropriate to determine community health problem?
3. What is the rate you calculate: prevalence or incidence? Explain your answers! 4. What are the differences between incidence and prevalence?
5. If you want to calculate incidence of TB, draw the figure of incidence measurement based on the above data (take one sub-district as an example) 6. With regard to the source of data, what could be biases regarding the above
result?
Case 4 & Learning Task 4
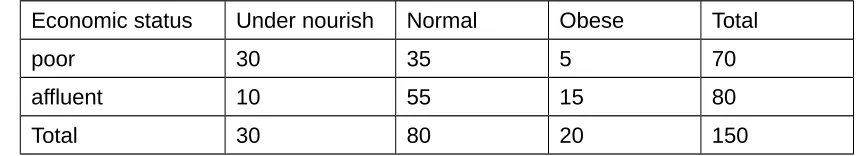
Morbidity Cases on Newspaper
1. Read carefully the newspaper clipping provided at the annex with the title “Dipertanyakan, Pasien Kurang Mampu Masuk RSUP Denpasar”dan “Masalah Pasien Kurang Mampu, DPRD Pertanyakan Keluhan RSUP”. (Questioned: “Poor patients in Provincial Central Hospital” and “Problem with poor patients, Parliament asks the hospital complaints”).
2. Read thoroughly the clipping with title “Korban Kanker Terbanyak Penduduk Pedesaan, Tingkat Sosek Rendah”. (“Mostly cancer patients are from rural areas with low socio-economic status”)
Discuss in your group and give opinion or comments on that news. Write your comments on a paper and submit it to your lecturer by the next day.
M O D U L E ~ 4
(Greenbergp. 51-53)
Crude, Specific and Adjusted Rate
dr. Ayu Kartika Sari, MPH & dr. A.A.Sg.Sawitri, MPH
___________________________________________________________________
ABSTRACTS
The other principal topic of morbidity and mortality measurements is the terms of crude, specific, and adjustment. These measurements are often being applied to those rate, ratio, and proportion. Crude, specific and adjustment are relative measurements. Crude means, generally, if the numerator and the denominator use total incident in a population (ex. CDR, CBR). While specific measurement is when the numerator and the denominator are comes from certain sub-populations. For instances the specific mortality on delivered women and the specific morbidity on tuberculosis. The adjustment is adjusting a certain incident among a group of population to a standard population for comparison purpose.
Case 1
Sero prevalence of HIV among TB patients in Bali
female), while the distribution based on sub-provinces is presented in the following table. (Report of Sero-Survey of HIV Co Infection among TB patients in Bali, 2009)
Distribution of TB and HIV Patients Based on Sex and Sub-province
Number Disctric Freq. of TB patients (m; f) Freq of HIV patients (m; f)
1. Buleleng 165 (101; 64) 19 (16; 3)
2. Jembrana 73 (45; 28) 1 (1; 0)
3. Tabanan 57 (31;26) 1 (1; 0)
4. Badung 119 (68; 51) 0
5. Denpasar 312 (171; 141) 16 (11; 5)
6. Gianyar 73 (43; 30) 0
7. Bangli 28 (18; 10) 0
8. Klungkung 57 (31; 26) 0
9. Karangasem 116 (75; 41) 2 (1; 1)
Total 1000 (580; 420) 39 (30; 9)
Learning Task 1
1. What is the crude HIV infection among TB patients in Bali? What is the interpretation of that number?
2. What is the specific HIV infection among TB patients in Bali, based on sex? What is the interpretation of that number? Is the number confounded by area or sub-province?
3. What is the specific HIV infection among TB patients in Bali, based on sub-province? What is the interpretation of that number? Is the number confounded by sex?
4. What is the specific HIV infection among TB patients in Bali, based on sex and sub-province? What is the interpretation of that number? Is the number confounded by sex and sub-province?
5. Regarding the above results, explain the weaknesses of crude and specific rate. 6. If you are the Head of Bali Province, what will you do with regard to the above
result (number 1, 2, and 3)?
7. If you are the Head of Puskesmas in Buleleng area, what will you do if you diagnose patient as a TB in Puskesmas?
Case 2
Graphic Comparison of CBR and CDR at Canada and Alberta
Learning Task 2
1. First summary: the health status at Canada is better than Alberta. Is that correct? Explain your answer!
2. In order to make fair comparison between those states, what should you do? What data do you need?
3. Second summary: Number of deaths at Canada is greater than Alberta. Is that correct? Explain your answer!
4. Third summary: If adjusted death rate for Canada is 7 per 1000 persons, when the total population of Canada is 33,476,688. The total number of death was 234,339. Is that correct? Explain your answer!
Self Assessment
1. How do you differentiate absolute, ratio, proportion and rate?
2. Incidence and prevalence are not similar in many ways. Explain that!
3. In how many ways can you calculate incidence rate?
4. What are denominators that can be applied for calculating incidence? What is the most ideal enumerator?
M O D U L E ~ 5 (SKILL LAB I)
(Reference Skill Lab Manual, Kirkwood & Sterne, Chapter 2)
DATA ENTRY, DATA CLEANING AND DATA
TRANSFORMATION
dr. Putu Ayu Swandewi, MPH & dr. Gede Artawan Eka Putra, M.Epid
AIMS:
To demonstrate ability to search,organize and interpret information/data from different sources in order to assist in diagnostic, therapeutic and health.
LEARNING OUTCOMES:
1. To make structure of data with SPSS application 2. To do data entry
3. To clean data before analysis and explain the use 4. To do data transformation and explain the use
CURRICULUM CONTENTS:
2. Data entry 3. Data cleaning 4. Data transformation
SCENARIO & LEARNING TASKS
Case.
A population study was done in two sub villages in Desa Merdeka. This study’s purpose was to determine several factors that associated with anaemia and chronic malnutrition among children in the area. The area has two different characteristics which are easy to reach area (easy) and hard to reach area (hard). The condition of both areas was suggested to be considered since there might be different characteristics of the family; hence, the samples were randomly selected from both areas.
First Phase
Data collection was performed by interview using structured questionnaire with the mothers and measurement of the children (see questionnaire in the skill lab guide). The characteristics that were explored and measured include: mothers’ and children’s demographic characteristic, haemoglobin level and body weight. More specifically, the variables in the study were ID, name, area, mothers’ age, education, occupation; parity; and children’s age, haemoglobin level, body weight and height. The haemoglobin level measured with HemoCue, and body weight measured with digital scale. Anaemia status was determined when Hb level less than 11 mg/dl and undernourished determined when BMI less than 11kg/m2
Second Phase
After the above data collection was completed, the second phase of the study was started. This phase aims to evaluate the impact of food supplementation program to improve nutritional status among undernourished children. All undernourished children were involved in the study, expect those with severe illness. The children were allocated into two groups; first group received food supplementation and second groups continue with the prior daily consumption. The supplementation was provided up to 2 months and at the end of two month the nutritional status (the body weight)were measured again.
Learning Tasks:
See the sheet of data collection and raw data. The data were analysed by computer with software of SPSS. Discuss and analyse the tasks bellow:
1. Explain the types of variables in relation to construction of data entry: variable name (name), type, width, decimal, labels, value labels, missing values!
2. Number (No) consists of 3 numbers (hundreds), name of its field is: number (5 characters, not more than 8 characters for SPSS V.12 or bellow). Fill in the following field structure: type of field: . . . ; Width: . . . ; Decimal: . . . , Labels: . . . , Value labels: . . . ; Missing values: . . .
5. Explain the methods of classifying interval and categorical data!
6. Explain how to calculate composite index of Mass Body Index based on body height and body weight.
Self Evaluation
1. A haemoglobin value consists of 2 numbers and 1 decimal (example: 13.6 gr%). What is its field width?
2. Explain the limits of values that can be used as indicators of error in data entry. 3. Explain the types of variables based on their functions. Give an example of each
variable.
4. Explain the types of variables based on measurements scale. Give an example of each.
5. Explain with an example, what is the meaning of ratio variable? 6. Explain some methods to control a variable!
7. Explain the differences between formal education and IQ variables!
M O D U L E ~ 6
(Reference Greenberg, p. 29-43)
Analysis and Interpretation of Descriptive Data
dr. Ida Bagus Wirakusuma, MOH & dr. Putu Ariastuti, MPH
AIMS:
To demonstrate ability to search, collect, organize and interpret information/data from different sources in order to assist in diagnostic, therapeutic and health.
LEARNING OUTCOMES:
1. To analyse, present, and interpret descriptive data.
2. To interpret the measurements of morbidity and mortality on samples descriptively
CURRICULUM CONTENTS:
2. Rate comparison 3. Data interpretation
ABSTRACT
Descriptive in epidemiology begins with the assumption that disease do not occur in random. Typically three standard questions are posed to characterize the non random distribution of disease: Who get the disease? Where does the disease occur? and When does the disease occur? These questions concern the element of person, place and time, respectively.
At the minimum, the personal attributes examined in relation to disease occurrence are the distribution by age, race and sex. The place of occurrence of the disease may be studied at international, regional and local level. Temporal pattern can be examined across year, month, or days, depending on the time course of the disease in question.
SELF DIRECTING LEARNING:
Basic knowledge and its application that students must know include: 1. Variables of person, place and time
2. Rate comparison and interpretation
SCENARIO & LEARNING TASKS
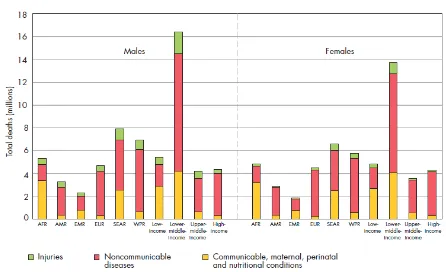
Case 1.
Look at the following figure carefully:
(Source: Global status report on non communicable diseases 2010)
Learning Tasks 1:
Carefully look at the figure above, and discuss the following questions:
1.
What are the interpretations of the figure? How many conclusions could you drawn from the figure?2.
When you are living at Indonesia on 2008, what is your risk of death by injuries?Case 2.
[image:52.612.92.538.85.357.2]