SUPPORT VECTOR MACHINE (SVM) BASED
RAIN AREA DETECTION FROM KALPANA-1 SATELLITE DATA
Shruti Upadhyaya1 and RAAJ Ramsankaran1*
1Department of Civil Engineering, Indian Institute of Technology Bombay, Powai, Mumbai 400 076, India
KEY WORDS: Rain area detection, SVM, Remote sensing, Satellite rainfall estimation, Kalpana-1, TRMM-2A25
ABSTRACT:
Rain is one of the major components of water cycle; extreme rain events can cause destruction and misery due to flash flood a nd droughts. Therefore, assessing rainfall at high temporal and spatial resolution is of fundamental importance which can be achieved only by satellite remote sensing. Though there are many algorithms developed for estimation of rainfall using satellite data, they suffer from various drawbacks. One such challenge in satellite rainfall estimation is to detect rain and no-rain areas properly. To address this problem, in the present study we have used the Support Vector Machines (SVM). It is significant to note that this is the first study to report the utility of SVM in detecting rain and no-rain areas. The developed SVM based index performance has been evaluated by comparing with two most popular rain detection methods used for Indian regions i.e. Simple TIR threshold used in Global Precipitation Index (GPI) technique and Roca method used in Insat Multi Spectral Rainfall Algorithm (IMSRA). Performance of the above considered indices has been analyzed by considering various categorical statistics like Probabil ity of Detection (POD), Probability of no-rain detection (POND), Accuracy, Bias, False Alarm Ratio (FAR) and Heidke Skill Score (HSS). The obtained results clearly show that the new SVM based index performs much better than the earlier indices.
1. INTRODUCTION
1Rainfall is considered to be the most important forcing variable for hydrologic modelling, stream flow modelling, near real time flood forecasting, climate studies etc. Hence, accurate measurement/ estimation of rainfall becomes a key task. This can be achieved either through dense network of rain gauges over the study area or with the well distributed Doppler Weather Radars (DWR). It is very difficult to achieve the both in developing countries like India, as it becomes too expensive to establish and maintain huge network of gauges/DWR. Instead as an alternative, satellite data which is freely available with good spatial and temporal resolutions can be used.
Satellite rainfall estimation (SRE) techniques can be broadly categorized into three categories: First are the techniques that use Visible (VIS) and Infrared (IR) Sensor data. These sensors are mounted over geostationary satellites and provide data at very high temporal resolution e.g. Kalpana-1 satellite provides images at every 30min. Second category of the techniques are those which use microwave (MW) sensors data mounted over low earth orbiting (LEO) satellites and has very coarse temporal resolution (E.g. NOAA AMSU sensor’s repetitive coverage is only once in 12hrs). The third and the recent category of techniques are the one which combines both the previous techniques. VIS/IR images provide only cloud top information as they do not penetrate the clouds and hence, are indirect means of rainfall estimation. Whereas, microwave radiations penetrate the cloud and can estimate rainfall more accurately but has poor temporal resolution. Hence, new techniques are evolved in recent decades (Ba and Gruber, 2001; Haile et al. 2010; Mishra et al. 2009, 2010, etc.), which combines the advantages of both the methods i.e. high temporal resolution of VIS/IR techniques and better accuracy of microwave techniques. A detailed review of various methods of rainfall
1* Dr. RAAJ Ramsankaran. Remote Sensing Division, Department of Civil Engineering, Indian Institute of Technology Bombay, Mumbai 400 076, India, Phone: 022 2576 7348, Email: [email protected]
estimation using satellite data is available in Upadhyaya and developed to separate the rain and no-rain area, popular of them are developed by Arkin and Meisner (1987), Ba and Gruber (2001), Haile et al. (2010), Roca et al. (2002), etc. Most of these indices are developed for a particular region and cannot be applied directly to the Indian region without proper modifications. Therefore, it is necessary to develop regional based indices for better detection of rain and no-rain areas.
Here, in the present study Support Vector Machine (SVM) based index has been developed for Indian region and validation has been carried out using various categorical statistics by considering the rain area detected by TRMM 2A25 (microwave based rainfall estimates) as reference data. In addition, a comparative performance study of the new index against the most widely used Global Precipitation Index (GPI) technique developed by Arkin and Meisner (1987) and the cloud classification technique developed by Roca et al. (2002) which is widely used in rainfall estimation algorithms over Indian regions (Mishra et al. 2009 and 2010 and Prakash et al. 2010) has been reported in this article. Study area boundary considered in the present work is from Latitude: 37°.1 N – 8°.076 N and Longitude: 68°.1167E- 97°.4167E. The remainder of this paper is structured as follows: Section 2 explains the presents the conclusions arrived from the study.
2. RAIN DETECTION INDICES
The following are the two widely used rain detection indices in satellite based rainfall estimations over Indian region.
2.1 Global Precipitation Index (GPI)
This index is also popularly known as simple threshold method. Arkin and Meisner (1987) used TIR channel (10.5μm-12.5μm) (TIRt) and defined a threshold of 235K for TIR Brightness Temperature (TIR BT). If the pixel is having TIR BT less than the threshold then it is considered as raining else it is neglected as non-raining pixel. This is the oldest and most popularly used index. The assumption behind the use of TIR threshold is that the raining pixels are associated with colder TIR BT.
2.2 Roca Cloud Classification
An empirical method developed by Roca et al. (2002) for Indian Ocean region has also been evaluated in this study. This empirical technique has been widely used in India which is evident from the studies of Mishra et al. (2009) and (2010) and Prakash et al. (2010) wherein they have developed a rain rate estimation algorithm suitable for Indian land region called Insat Multi-Spectral Rainfall Algorithm (IMSRA) using the above mentioned Roca cloud classification method. The rain area detection scheme adopted in IMSRA is given in Table 1. Here, the pixels which satisfy the mid to upper level clouds and low level clouds criteria are considered as raining and remaining pixels are classified as no-rain pixels.
Table 1. Roca Cloud Classification Scheme used in IMSRA algorithm
2.3 Support Vector Machine (SVM) based Index
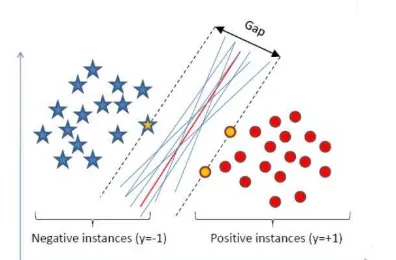
A SVM is basically a supervised non-parametric binary classifier which linearly separates samples in a Euclidean space into positive and negative groups. The main advantage of SVM based index over simple threshold index is that the ability of SVM to classify non-linear classes also, which is the case in satellite based rain area detection. The GPI method defines only one threshold value. If the pixels temperature is less than the threshold then it is classified as raining. Generally, all raining pixels are cold but vice versa may not be true. The clouds like cirrus are cold but do not produce rain. Hence, defining a simple threshold value may not give accurate results. This can be achieved by using “Kernel Trick” in SVM, which maps the data in higher dimensional space so that the problem still remains a linear classification and can be solved using n dimensional work successfully on many applications of nonlinear classification and function estimation. SVMs can be used for both classification and regression problems. Some applications of SVMs for classification are isolated handwritten digit recognition (Burgesand Schölkopf, 1997) object detection (Blanz et al., 1996), and face detection in images (Osuna et al., 1997). Considering the advantages, for the first time in problem is solved. Within the models and the formulation, one makes use of the kernel trick and slack variable to model non-linearly separable datasets. The datasets which are non-linearly separable (Fig. 1) are solved using “Hard-Margin SVM”. If the data is non-linearly separable with very few points in different class space as shown in Fig.2 (due to uncertainty in the datasets) then a “Slack Variable” (�) is introduced which incorporates this non-linearity. This approach of solving the SVM is called as “Soft-Margin SVM” If the dataset is non-linearly separable then SVM maps the data into higher dimension using the “Kernel function” (K) (Fig.3) so that the data can be classified again as a linear model by finding the optimal hyperplane.
In SVM we try to find an optimal hyperplane that separates two classes (Fig 1-3). In order to find an optimal hyperplane, we need to minimize the norm of the vector w, which defines the separating hyperplane. This is equivalent to maximizing the margin between two classes. Given a set of instance-label pairs,
(x1, y1), . . . (xl, yl), Є RN
Let the decision function be
= �� . � + � (1)
To maximize the margin (distance between hyperplane and the nearest point) the SVM (Vapnik, 1995) (Boser et al., 1992) requires the solution of the following optimization problem:
Minimize ɸ � =‖�‖2+ � ∑� (2a)
Subjected to [ � · ] + � − � ,
And � � = , … , (2b)
where C is a parameter chosen a priori and defining the cost of constraint violation. If very high C is chosen, then Soft-Margin SVM is equivalent to hard-margin SVM. When C is very small, we admit misclassifications in the training data at the expense of having w-vector with small norm. The parameter C is generally selected based on “Cross-Validation”.
S.T. � . (4)
∑� �
= = (5)
Where K(x, y) = kernel function performing the nonlinear mapping into the feature space. Few popular kernels are listed below in Table 2. Considering the non-linearity of the problem, in the present study we have used Soft-Margin SVM with Kernel function.
Figure 1. Optimal Separating Hyperplane (“Hard Margin” linear SVM)
Figure 2.Optimal Separating Hyperplane(“Soft Margin” linear SVM)
Figure 3. Kernel Trick for non-linearly separable data
Table 2. Few popularly used Kernels
Kernel Function � ⃗⃗ , ⃗⃗
Linear ·
Radial Bias Function exp − ‖ − ‖
Polynomial � + · �
Sigmoidal ta�h · −
Where the parameters like q, γ, δ in the above Table 2 are user defined, which can be found out by a technique called “Cross -Validation”.
4. DATASETS
4.1 Kalpana-1 Data
Kalpana-1 satellite is a dedicated Indian meteorological geostationary satellite launched by GSLV and operating since 24th Sept 2002. This geostationary satellite carries onboard a Very High Resolution Radiometer (VHRR) along with other instruments. This sensor operates in three wavelengths band namely VIS (0.55μm-0.75μm), TIR (10.5μm-12.5μm), and WV (5.7μm-7.1μm). In WV and TIR, spatial resolution is 8 Km where as in VIS band spatial resolution is 2 Km. Temporal resolution of the satellite is 30 min. The images are provided in HDF5 format and can be downloaded free of cost from MOSDAC (http://www.mosdac.gov.in).
4.2 TRMM PR- 2A25 Data
TRMM PR -2A25 is the orbital data product of TRMM satellite which gives the instantaneous surface rainfall rates for the swath of PR. The 2A25 products represent snapshot of rainfall rates with a horizontal resolution of 5 km and a temporal frequency of one or two observations per day depending on the latitude. The 2A25 products and other TRMM products can be downloaded free-of-charge following the links at (http://daac.gsfc.nasa.gov/precipitation/). The data is provided in the HDF4 format. This data is considered as reference dataset in various studies (Haile et al. 2010,Mishra et al. 2009 and 2010, Prakash et al. 2010) and hence, in the present analysis also it is considered as reference dataset.
Considering the importance of South–West (S–W) monsoon rainfall for India, in this study, the S-W monsoon data of the years 2010-2013 has been used for development (2010) and validation (2011-13) of rain area detection indices.
5. METHODLOGY
The methodology involves 3 major steps as shown in Fig 4. First step is to collocate the Kalpana-1(K-1) and TRMM 2A25 data. This is an important step because K-1 data is a geostationary data available over complete India at every 30 min interval whereas TRMM 2A25 is an orbital data which crosses certain part of India once or twice a day, so the validation accuracy is entirely dependent on what accuracy the both datasets are matched. If TRMM 2A25 pixel rain rate is greater than zero then it is considered as raining pixel else it is identified as no-rain pixel. Once the collocated dataset is prepared then second step is to apply rain area detection indices over the collocated dataset. Last step is to form a contingency matrix and estimate various categorical statistics to find the best performing index over India.
5.1 Collocation
Collocation between K-1 and TRMM 2A25 images has been done to obtain K-1 pixels which are captured at approximately same place and same time as that of TRMM 2A25 pixels. This has been achieved by finding the closest K-1 image (captured less than 10 min) whenever TRMM passes over India and then co-locating the same location pixels in the selected K-1 and the TRMM images. In house computer programs have been developed to extract the collocated pixels in K-1 images. The extracted TRMM 2A25 rainfall rates are considered as the reference dataset for rain and no-rain area detection for each K-1 pixels.
Figure 4. Flowchart of the methodology
Initially, based on the preliminary analysis Radial Bias Function (RBF) kernel has been selected. The training process mainly involved selection of proper kernel parameters, as mentioned in section 3.3 it can be obtained from “cross validation”. In the present work 5-fold cross validation (For more details, refer Blum et al., 1999) has been carried out. Once the proper parameters are defined using cross validation, the model has been trained to find the optimal hyperplane using quadratic optimization technique. All the analysis has been performed using the open source library called LibSVM.
5.3 Validation using Categorical Statistics
To evaluate the effectiveness of these indices, various categorical statistics have been used. For a quick reference, they are briefly described in this section along with their importance.
The categorical statistics can be defined by using a standard 2 X 2 contingency table. The Table 3 shows a sample contingency
selected Rain Detection Index (RDI) and the
TRMM-2A25 has detected as rainfall and therefore indicates
is not detected by the selected RDI while it is detected by the TRMM-2A25 and it indicates the number of pixels incorrectly classified as non-rainy by the selected RDI.
Correct Negatives (z) is the number of pixels for
which rainfall is not detected by both the selected RDI and the TRMM-2A25, which indicates the number of pixels correctly classified as non-rainy by the selected RDI.
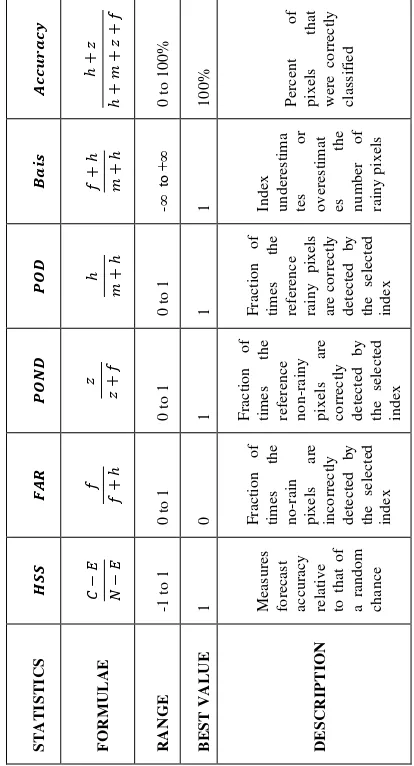
Based on the above contingency matrix, the various categorical statistics are defined as follows (Table 4):
��
As all the statistics gives different information each, only one cannot be used for choosing the optimal index. Hence, an optimal RDI is one, which gives better categorical statistics i.e. large value of HSS, POD, POND, Accuracy, small values of FAR and BIAS approximately equal to 1. Following the methodology given in Fig.4, all the categorical statistics has been found for the entire S/W monsoon season of 2011-13 for all the three rain area detection methods and the obtained results are given in the next section.
6. RESULTS AND DISCUSSION
As a first step, the collocation between TRMM 2A25 and K-1 data has been carried out for June, July, August and September months of the years 2010-13 and the collocated pixels are extracted. Year 2010 data has been used for SVM model development. Optimal values of the RBF kernel parameter ( ) and C value of Soft-Margin classifier has been derived using 5 fold cross validation. Thus obtained optimal values are: =1 and C=1. Once the SVM model is developed then the validation dataset has been prepared by considering equal proportion of rain and no-rain pixels so that the statistical results would not be biased towards the proportion in the dataset.
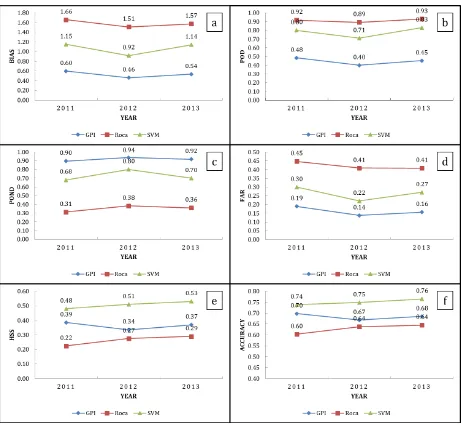
The entire S-W monsoon month’s collocated dataset size for each year is more than 80,000 pixels, which is sufficiently large to carry out the statistical analysis. Based on these collocated pixels, categorical statistics for each year has been estimated separately and are shown in Fig.6a-f.
BIAS is the ratio of the number of rainy pixels detected by a RDI to the total number of rainy pixels present in TRMM-2A25. BIAS greater than 1 implies that the RDI overestimates the number of rainy pixels while a BIAS of less than 1 implies the RDI underestimates. The results of BIAS for all the three considered RDI’s is shown in Fig. 6a. It can be observed from Fig. 6a that the Roca method always over estimates the number of rainy pixels, whereas GPI method always estimates less number of rainy pixels. The new SVM based index gives the best result for all the three years.
The POD (Probability of Detection) is the ratio of the number of correct rain pixels detected by a RDI to the total number of rain pixels available in TRMM-2A25. A POD = 1 indicates that the selected RDI correctly detects all the rain pixels. Similar to the POD, there is another statistics called POND (Probability of no-rain detection) which represents the ratio of the number of Figure 6. Categorical statistics for S/W monsoon months of the years 2011-2013 and for different rain detection
indices. a) BIAS b) POD c) POND d) FAR e) HSS f) Accuracy
correct no-rain pixels detected by a RDI to the total number of no-rain pixels present in TRMM-2A25. The POD of three RDI’s shown in Fig. 6b indicates that the SVM based index performs considerably well but GPI method performs very poor, it could not detect more than 50% of the raining pixels. But POD alone cannot be used for evaluation, it has to be used along with POND because the RDI should detect both rain and no-rain pixels with better accuracy. If it fails in anyone then the index is not performing well for the study region.
From Figure. 6c it can be observed that the GPI method is able to detect maximum number of no-rain pixels correctly but it fails in detecting raining pixels. In a similar way, though Roca method is able to detect most of the raining pixels, it fails miserably in detecting no-rain pixels. Performance of the SVM based index is consistent in detecting both rain and no-rain pixels in all the three different year’s validation dataset.
The FAR (False Alarm Ratio) is the ratio of the number of incorrect rainy pixels detected by a RDI to the total number of rainy pixels detected by that RDI and it indicates the fraction of times the selected index falsely detects rainy pixels compared to TRMM-2A25. From Figure 6d it can be observed that the FAR of Roca method is very high indicating that large number of raining pixels are falsely detected. FAR of GPI is least but its POD is very low to consider this index as best. Similarly, from Fig. 6d, it can be said that the FAR of the SVM based index is months are shown in Fig. 6e. In terms of HSS, the SVM index performs exceptionally well compared to the other two indices. It is to be noted that the Roca method performs poorly.
Accuracy is the ratio of the correctly detected pixels to the total number of pixels. It gives an overall accuracy of what percent of pixels were correctly classified; it may be rain or no-rain pixels. In simple terms, it gives combined information of both POD and POND. From Fig. 6f it can be observed that the accuracy for SVM index is highest for all three years whereas least accuracy is obtained for Roca method.
From the above analysis, it can be certainly said that the SVM based index performs comparatively better than the other two popularly used indices over India with highest HSS and Accuracy and fairly good FAR and with almost equal probability for detecting both rain and no-rain pixels.
7. SUMMARY AND CONCLUSIONS
The article mainly deals with the utility of Support Vector Machines (SVM) for detecting rain and no-rain areas accurately, which is the major initial step towards satellite based rainfall estimation. A SVM based index has been developed for Kalpana-1 dataset using 2010 year S-W monsoon dataset and by considering TRMM 2A25 as reference dataset. The developed index has been evaluated with other two popularly used indices in India i.e. GPI and Roca method for the years 2011-2013.
The analysis has been carried out using various categorical performance of the index in different homogeneous spatial locations of India. Also, similar analysis has to be carried out using different satellite data with higher spatial resolution and at different spatial scales to check whether the performance of the indices remains consistent or not.
ACKNOWLEDGEMENTS
Authors would like to thank the TRMM science team and Meteorological and Oceanographic Satellite Data Archival Centre (MOSDAC) team for providing us the satellite data products free of cost through their data repositories.
REFERENCES
Arkin, P. A., and Meisner, B., 1987: The relationship between large-scale convective rainfall and cold cloud over the Western Hemisphere during 1982-1984. Monthly Weather Review 115: 51-74.
Ba, M., and Gruber, A., 2001: GOES Multispectral Rainfall Algorithm (GMSRA). Journal of Applied Meteorology 40: 1500–1514.
Blanz, V., Schölkopf, B., Bulthoff, H., Burges, C., Vapnik, V., Vetter, T., 1996: Comparison of view–based object recognition algorithms using realistic 3d models. proc. ICANN’96, , Springer lecture notes in computer science, Berlin 112:251-256.
Blum, A., Kalai, A. and Langford, J. 1999: Beating the hold-out: Bounds of k-fold and progressive cross-validation. In Proceedings of International Conference on Computational Theory, 201-208.
Boser, B., Guyon, I., and Vapnik, V., 1992: A training algorithm for optimal margin classifiers. Proc. the fifth annual workshop on computational learning theory, Pittsburgh 5:144-152.
Burges, C. J. C., Schölkopf, B., 1997: Improving the accuracy and speed of support vector learning machine. Advances in neural information processing systems, Cambridge, MA: MIT Press, 375-381.
Haile, A.T., Rientjes, T.H., Gieske, A., Gebremichael, M., 2010: Rainfall estimation at the source of the Blue Nile: A multispectral remote sensing approach. International Journal of Applied Earth Observation and Geoinformation. 12S:76-83
Iguchi, T., Kozu, T., Meneghini, R., Awaka, J., Okamoto, K., 2000: Rain-profiling algorithm for the TRMM precipitation radar. Journal of Applied Meteorology 39:2038–2052.
Kidder, S. Q., and Vonder Haar, T. H., 1995: Satellite Meteorology: An Introduction. Academic Press, San Diego 307-355.
Meneghini, R., Iguchi, T., Kozu, T., Liao, L., Okamoto, K., Jones, J., and Kwiatowski, J., 2000: Use of the surface reference technique for path attenuation estimates from the TRMM Precipitation Radar. Journal of Applied Meteorology 39: 2053– 2070.
Minoux, M., 1986. Mathematical programming: theory and algorithms, Wiley, New York.
Mishra, A., Gairola, R. M., Varma, A. K., and Agarwal, V. K., 2010: Remote sensing of Precipitation over Indian land and oceanic regions by synergistic use of multi-satellite sensors. Journal of Geophysical Research 115: D08106
Mishra, A.K., Gairola, R.M., Varma, A.K., Agarwal, V.K., 2009: Study of intense rainfall events over India using Kalpana-IR and TRMM precipitation radar observations. Current Science 97: 689-695.
Osuna, E., Freund, R., Girosi, F., 1997: Training support vector machines: an application to face detection. Proc. Computer vision and pattern recognition 130-136.
Prakash, S., Mahesh, C., Gairola, R.M., Pal, P.K., 2010: Estimation of Indian summer monsoon rainfall using Kalpana-1 VHRR data and its validation using rain gauge and GPCP data. Meteorology and Atmospheric Physics 110: 45–57.
Roca, R., M. Viollier, L. Picon, and M. Desbois, 2002: A multisatellite analysis of deep convection and its moist environment over the Indian Ocean during the winter monsoon. Journal of Geophysical Research 107: 8012.
Upadhyaya, S. and Ramsankaran, RAAJ., 2013: Review of Satellite Remote Sensing Data Based Rainfall Estimation Methods. Proceedings of HYDRO 2013 International held at IIT MADRAS, Chennai, INDIA. 897:905.
Vapnik, V., 1995. The nature of statistical learning theory, Springer, New York.
Vapnik, V., 1998. Statistical learning theory, Wiley, New York.