3D RECONSTRUCTION OF ANCIENT EGYPTIAN ROCK-CUT TOMBS:
THE CASE OF M.I.D.A.N.05.
M. Nabil a, *, M. Betrò b, M. N. Metwally a
a
CULTNAT - Bibliotheca Alexandrina, Egypt - (mohammad.nabil, monabil32)@gmail.com b Dipartimento di Civiltà e Forme del Sapere - Egyptology, University of Pisa, Italy - [email protected]
KEY WORDS: Rock-cut tombs, Laser Scanning, 3D reconstruction
ABSTRACT:
In this paper we present an on-going work to reconstruct a 3D model of M.I.D.A.N.05., an ancient Egyptian tomb located in Luxor. The reconstruction aims at producing a high quality 3D model of the tomb to help in archaeological investigation and other scientific uses. We present details about the different stages of the used reconstruction pipeline, the results so far, and the evaluation of the results in view of the project objectives.
* Corresponding author.
1. INTRODUCTION
The University of Pisa and CULTNAT (Center for Documentation of Cultural and Natural Heritage, affiliated to Bibliotheca Alexandrina) started in 2011 a joint research project, under the scientific direction of Marilina Betrò (Pisa). The project aims at the 3D reconstruction of one of the tombs investigated by the University of Pisa in its archaeological concession in the necropolis of ancient Thebes (Luxor): M.I.D.A.N.05.
M.I.D.A.N.05 is a rock-cut tomb, brought to light by the Pisa archaeological mission in 2004. It was originally built around 1550 B.C., but reused many times until the Greek-Roman age, undergoing changes and destructions through time, which modified its original plan. In its present state, the tomb is composed by a courtyard, three rooms cut into the rock (a broader hall, a long corridor, and another smaller room with a funerary shaft), and four burial chambers underground. Another shaft, probably belonging to the same tomb, was discovered in the courtyard in 2011, and is not yet excavated. Only few scenes from the colourful paintings once covering its walls and ceilings are still preserved. Its original plan attests a very early phase in the typical T-shaped tomb of the Egyptian New Kingdom, not yet known and studied.
The main purpose of the 3D reconstruction is to provide a very accurate digital recording of the monument in its present state, as a first step to its virtual reconstruction, for preserving heritage at risk of damage, for communication, and for scientific future applications.
2. THE RECONSTRUCTION PIPELINE
The 3D reconstruction of a site typically consists of a set of stages. Starting from the data acquisition, going through all the processes of scans preparation and alignment, and ending up with scans merging and colouring. All decisions taken during these steps were greatly influenced by two factors. The first factor was the main purpose of the 3D reconstruction of the
tomb: to have an accurate 3D model of the tomb to help in archaeological investigation and further scientific uses. The second factor was the site nature, which could be considered as a challenge and an opportunity in the same time. In the following sections, we will discuss in details each of the tomb 3D reconstruction stages.
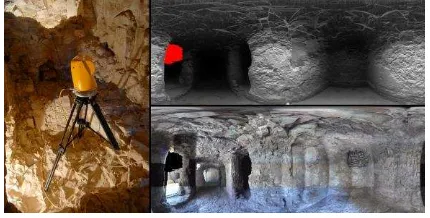
2.1 Data Acquisition
The first stage in any 3D reconstruction project is typically the data acquisition. A process in which we digitally record, as precise as possible, the shape and colour of the object we need to reconstruct.
Figure 1. Left: the scanner at work. Top right: a panoramic view of one of the scans points cloud. Bottom right: a panoramic
image of the same scan.
The tomb shape acquisition was done using the CALLIDUS laser scanner. This scanner uses the Time of Flight (ToF) method for measurements. ToF method works by sending out laser pulses from the scanner towards the surface of the object we want to scan, the time it takes the pulse to return to the scanner head is measured, and distances are calculated based on the travelling time of the laser pulses and the light speed. This method is usually used to scan sites.
The typical range of effective measurements of this scanner is 32 meters with typical accuracy of 5 mm. The scanning speed is 1750 points per second. The scanner can scan 360 degrees in the horizontal direction (steps from .0625 to 1 degree) and 120
degrees in the vertical direction (steps from .25 to 1 degree). The scanner is equipped with a digital camera that can capture a panoramic image from its point of view.
To get the highest possible uniform points density, the scanner sampling rate was set to measure distances each .25 degree in both the horizontal and the vertical directions. The outcome of each individual scan using this sampling rate is more than 800,000 points.
In each individual scan, the scanner was positioned inside the tomb’s rooms and corridors at equal distances from the walls and the ceiling (about 1.5 meters); in an attempt to have a uniform points cloud (see Figure 1).
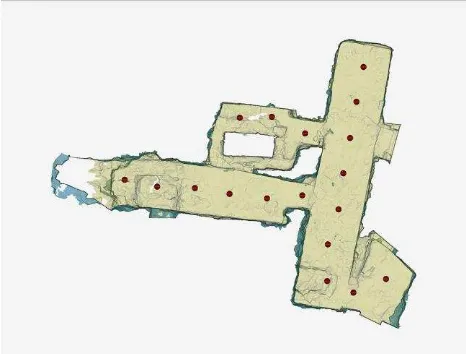
While it was possible to scan the tomb from only few locations, it was decided to conduct a scan each 1.5 meters along the tomb's interior rooms and corridors. This ensured a dense points cloud along the tomb interior that will produce an accurate 3D reconstruction; this also ensured that the interior surfaces of the tomb, having aggressive topology nature, is going to be well-sampled from different angles, subsequently leading to better alignment. Please refer to Figure 2 for scans locations inside the tomb.
Figure 2. Locations of the 18 scans inside the tomb.
A Nikon D200 digital SLR camera was used to shoot panoramic images of the tomb’s interior and exterior in an attempt to substitute the scanner colours by the camera's in post processing. The panorama shooting was done from 10 locations out of the 24 scans locations, to facilitate the process of image mapping to scans as will be described later. From each shooting location, 32 images were taken, later stitched together to produce a spherical panorama.
The acquisition mission took six working days. During this mission, the tomb interior was scanned from 18 different locations and the tomb exterior was scanned from 6 additional locations. Total number of measured points was 14.5 million. It is worth mentioning here that one of the main challenges that faced the scanning progress was the high temperature in the site. Scanners are generally not optimized to work in such high temperatures. The scanner heat alarm used to trigger after short time from the start of the scanning even when working inside the tomb in the shade. The only solution was to give the scanner a break between each two scans. For scanning outside the tomb, it was done only before 10 AM.
In the following sections, we will discuss the process of aligning, reconstructing and colouring only the 18 scans inside the tomb. Scans taken from outside the tomb are outside the scope of this paper.
2.2 Scans Alignment
Data acquired in the previous stage are in the form of individual scans, each scan contains around 800000 points measured from a single location which is the scan coordinate system origin. Before we can reconstruct the tomb we need first to align all these scans together.
Individual scans are saved in the scanner native format. Before alignment, we had to export all scans to standard format, VRML in our case, making it possible to process them in any 3D scan processing software. These VRML files were imported into the Geomagic software for the second stage of alignment. This converting step is important because the software provided with the scanner does not provide all the required functions for scans processing.
Scans alignment can be accomplished by using several methods. Using a total station, a surveyor can track the scanner locations while moving from a scan location to another. The software is able to use these measured positions to align all scans together in a single coordinate system. This technique is very common in outdoor scanning, but it was hard to implement in our case because of the narrow nature of the tomb’s interior and its architecture that would prevent the total station from seeing all scanner positions from its point of view. Another method is to use markers, but this was not recommended in a historical site.
Figure 3. The 18 scans of the tomb interior after being aligned.
The global registration was the optimum alignment method for our case. Since it requires no use of markers or total stations from one side, and it makes advantage of the tomb interior surface from the other side. The amount of 3D data found in overlapping scans, if precisely captured, is enough for the global registration algorithm to effectively align scans together. For global registration to align two scans, they must first be roughly aligned. This is done by selecting at least three matching points in the two scans. It is a good practice to distribute the selection of the matching points on the walls and ceiling. After the two scans have been roughly aligned, the software can automatically refine their positions using mutual surface topology found in the overlapped area between scans. The more the overlap contains rich 3D information, the more
accurate the registration process is, and this is why high sampling rate was chosen in the acquisition stage (see Figure 3).
2.3 3D Reconstruction
The 18 aligned scans contain redundant data; same areas are represented by many scans at different resolutions. In this stage we apply reconstruction filters on the aligned scans to merge them all into one single large 3D mesh. In this project we used two reconstruction filters found in the MeshLab software; the VCG and the Poisson reconstruction filters. But before we can start a reconstruction filter, some preparatory steps were performed on the scans.
Data coming out from the CALLIDUS scanner are in points cloud formats. They need to be triangulated first before specific processing can be applied. This is because some functions require a polygon object to work on. We tried to preserve all the acquired data by forcing the triangulation function to connect all points without doing any noise reduction processes. In some cases, oversampled areas, directly above the scanner head, needed to be deleted before the software could connect all points. In other cases, the triangulated scans needed their face normals to be flipped. The triangulation step was performed in Geomagic software.
After triangulation, we import all individual scans into the MeshLab software. We remove faces that have an edge length that is longer than 3 cm. And finally, we clean individual scans from typical problems like: duplicate faces, unreferenced vertices, and faces from non-manifold edges. These problems could sometime prevent the proper execution of the filter. To speed up this process, we save these cleaning filters in a script and apply the script on the 18 individual scans.
The first attempt to reconstruct the tomb was done using the VCG reconstruction filter. This filter works on a group of individual scans and converts them into one single mesh. The filter is able to control the reconstruction accuracy by its "Voxel Side" parameter. To get a high resolution reconstruction, we used .007 as the "Voxel Side". This resolution could not be achieved without the use of a very important option in the VCG filter called the "SubVol Splitting" parameter. This parameter opens the door for very high resolution reconstructions by allows the user to split the reconstruction into multiple chunks. These chunks are then merged into single mesh. Using this filter we were able to reconstruct the entire tomb interior from the 18 scans in less than half an hour. The resulting mesh composed of nearly 18 Million faces. The reconstruction was done using a mobile workstation (i7 CPU - 2.40GHz, 8 GB RAM) running Windows 7 operating system.
While the VCG filter was very good at reconstructing a sharp and high resolution meshes, the result suffers from some problems like holes and floating pieces. To overcome these problems, we tried the Poisson reconstruction filter (Kazhdan 2006) found also in the MeshLab software. Unlike the VCG filter, the Poisson reconstruction filter requires all scans to be merged first into a single layer before it can be run. This filter has the advantage of creating a closed surface reconstruction. The result always needs some cleaning after the reconstruction to delete extra faces that the filter creates to close large holes like doors and windows, but this was a straightforward step.
Unlike the VCG filter, the Poisson filter cannot control the resolution at which the reconstruction happens. Alternatively, it uses an "Octree Depth" parameter that controls the
reconstruction resolution. The higher the depth the more accurate the result will be. We tried to increase the depth as much as we could but only reached depth 11 before the system crashes. At this depth, we were able to reconstruct a 7.5 Million faces mesh in only 10 minutes on the same system previously mentioned.
The Poisson reconstruction filter has an advantage, over the VCG filter, of producing a clean and water-tight mesh. But on the other side, the mesh it produces has a blurry surface compared to the VCG result. To overcome this problem we used an out-of-core implementation of the Poisson filter (Bolitho 2007) in an attempt to reconstruct using a higher depth. The advantage of this implementation, over the MeshLab implementation, is that it allows for executing a Poisson reconstruction at unlimited depth.
Using this implementation we were able to increase the reconstruction depth to 12. At this depth, we were able to reconstruct a 15.4 Million faces mesh in only 18 minutes on the same system previously mentioned.
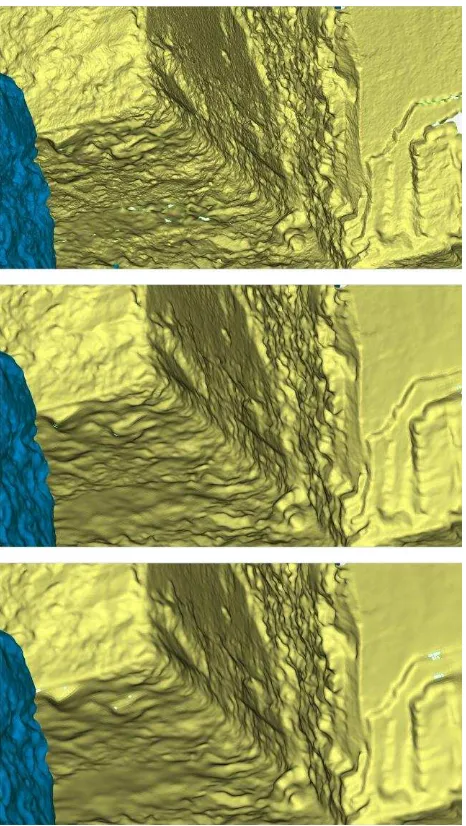
Increasing the depth only increased the number of faces and had didn't enhance the blurry nature of the Poisson reconstruction filter.
Figure 4. Reconstruction results: VCG (top), Poisson (middle), and Out-of-core Poisson (bottom).
Comparing the results, up till now, the VCG seems to be the best reconstruction filter in our case because it produces a sharp reconstruction, reconstruction resolution is controlled by a user input, has no limitations on resolution and finally its disadvantages can be easily manipulated using manual or automatic hole-filling and cleaning techniques. In Figure 4 we present a comparison of the 3 techniques results.
2.4 Colouring
A good documentation of a site requires the acquisition of both its shape and colour. As previously mentioned, colours are acquired during scanning by the laser scanner own camera. However, colours coming from the scanner camera are not good enough for documentation and visualization; it could only be used for guiding the points picking process in manual registration.
Another important reason for not relying on the scanner camera in colour acquisition is the amount of manual control that modern DSLR cameras provide. Using a professional grade camera, we can precisely control the exposure and other parameters affecting the image quality based on light conditions and shooting time. We can even create fused exposures images to solve the typical problem of over and underexposed images. Moreover, we can choose a different time for the shooting session, scan at night and shoot in the morning for example.
Figure 5. Colours acquired by the scanner (top), and colours projected from external camera images (bottom).
As previously explained, the scanning mission was complemented by a shooting session. To substitute colours from scanner with colours from digital images, we align the images to the reconstructed mesh in a step that is very similar to manual scans alignment. In Geomagic, we pick a set of mutual points found in the reconstructed mesh and an image. The software uses these matching points to recover the camera position and orientation at shooting time as well as other internal camera and lens parameters. Once the image is aligned to the mesh, the software can project the colours from the image onto the mesh surface (see Figure 5).
3. CONCLUSION & FUTURE WORK
Theban tombs in the New Kingdom, at least from the first years of kings Hatshepsut and Thutmose III (about 1479-1425 BC), are T-shaped. Although M.I.D.A.N.05 at first sight seems to belong to this architectural type, some unorthodox features of its plan are evident: the corridor (“c”)– please refer to Figure 6 - is not axial with the entrance, which is instead exactly in front of the door to the small room northward of the corridor (“d”); moreover, the length of the two wings of its transverse hall (“a”) is unequal, the southern wing being longer than the northern one. These anomalous features can be explained only if we suppose two different phases in the construction: in a first moment, the tomb was composed by a shorter transverse hall (about 6.60 m instead of the present 10.50 m) and a single chapel (room “d”) with a funerary shaft. This shorter length of the hall approximately corresponds to that of the rock facade (Phase 1). Later on, the hall was extended by cutting the rock southwards, corridor “c” was hollowed out next to the former chapel “d”, and finally the decoration, today still visible in some places on the walls and ceilings, was painted (Phase 2). An even more ancient phase is arguable on the ground of archaeological finds in the tomb: during the excavations in the funerary chambers at the bottom of the shaft of room “d”, many fragments of a rishi coffin dating to the last part of the Second Intermediate Period (1700-1550 BC) were found, which allows to suppose an older date of construction for the original nucleus of the tomb (proto-phase).
Figure 6. M.I.D.A.N.05 plan with different building phases.
The reconstruction of a 3D model of the tomb can be a powerful and very useful tool both for scientific interpretation and to display its transformations through time. Not only it provides a very faithful replica of the monument, but it allows to study in detail its features, in conditions of light and from points of view which can never be experienced in “real” life. This enhances the potential of scientific observation of the tomb: for instance, different treatment of surfaces and lines of fissuring of the rock are emphasized in the 3D model by the absence of “ground noise” such as remains of decoration, colours, actual conditions of light, dust etc.
The very high quality and accuracy of the 3D model so far realized makes it a privileged observatory for every future archaeological and architectural study of the tomb, but, as important as it is, this does not exhaust its potential. The model indeed can be the starting point for further, very interesting, applications. One has already been mentioned above: the
possibility of building up a 4D model, visualizing the transformations of M.I.D.A.N.05 through time. Many other possible scientific uses can be envisaged, such as virtual integration of the wall decoration program, where partly preserved, and repositioning of archaeological finds in the original tomb context. Some of the problems posed by M.I.D.A.N.05 could find a very helpful tool in using the 3D model for simulation tests: since ancient times occasional flash-floods repeatedly invaded the area and the tomb in it, once abandoned: these events arise from the rare but violent and sudden rain storms which sometimes strike the desert West of the Theban necropolis. Flash-floods also dragged objects from outside into the tomb and, moving inside its rooms, displaced those originally placed there from their proper context, making sometimes difficult to distinguish burial graves and objects pertaining to the tomb from those intrusive. A simulation of those flash floods in the 3D model could be an effective tool to test our hypothesis, to what extent their action was a disturbing factor, how they moved in the tomb, and their stratified sequences in the different rooms and ages.
References from Journals:
Betro' M., Del Vesco P, Miniaci G., 2012. La Missione Archeologica dell’Università di Pisa a Dra Abu el-Naga (M.I.D.AN.) Campagne VIII-XI (2008-2011), Egitto e Vicino Oriente 35, p. 21-51.
References from Books:
Betro' M., DEL VESCO P, MINIACI G. 2009. Seven seasons at Dra Abu el-Naga. The tomb of Huy (TT 14): preliminary results, Pisa 2009.
References from Other Literature:
Betro' M., 2012. Virtual Environments and Web Community in Archaeology: Theban Tomb 14 as Case Study. Achievements and Problems of Modern Egyptology. Proceedings of the International Conference Held in Moscow on September 29-October 2, 2009. p. 40-48, Moscow, Russian Academy of Sciences.
Bolitho M., Kazhdan M., Burns R., Hoppe H., 2007. Multilevel Streaming for Out-of-Core Surface Reconstruction. Eurographics Symposium on Geometry Processing.
Kazhdan M., Bolitho M., Hoppe H.: Poisson surface reconstruction. Geometry Processing 2006: Fourth
Eurographics Symposium on Geometry Processing, Cagliari, Sardinia, Italy, June 26-28, 2006 (2006), Eurographics.
Acknowledgement
The authors would like to thank 3D Systems, and their local representative in Egypt, PROMECH, for supporting this research by giving access to their Geomagic Studio software which was extensively used in the reconstruction of the tomb.