EVALUATIONS ON THE POTENTIAL PRODUCTIVITY OF WINTER WHEAT BASED
ON AGRO-ECOLOGICAL ZONE IN THE WORLD
Hongyan Wang a, Qiangzi Li a, *, Xin Du a, Longcai Zhao a, Yewei Lu a, b, Dejiang Li a, c, Jilei Liu a
a.Institute of Remote Sensing and Digital Earth, Chinese Academy of Sciences, Datun Road, Chaoyang District, Beijing 100101,
China [email protected]; [email protected]; [email protected]; [email protected]; [email protected]
b.China University of Mining & Technology, Xueyuan Road, Haidian District, Beijing 100083, China –[email protected]
c.Chendu University of Technology, No.1 East 3 road ErXian brige ChengHua Distrct ChengDu city, SiChuan Province, 610059,
China –[email protected]
KEY WORDS: Evaluation, Potential productivity, Winter Wheat, Agro-ecological zone, world
ABSTRACT:
Wheat is the most widely grown crop globally and an essential source of calories in human diets. Maintaining and increasing global wheat production is therefore strongly linked to food security. In this paper, the evaluation model of winter wheat potential productivity was proposed based on agro-ecological zone and the historical winter wheat yield data in recent 30 years (1983-2011) obtained from FAO. And the potential productions of winter wheat in the world were investigated. The results showed that the realistic potential productivity of winter wheat in Western Europe was highest and it was more than 7500 kg/hm2. The realistic
potential productivity of winter wheat in North China Plain were also higher, which was about 6000 kg/hm2. However, the realistic
potential productivity of winter wheat in the United States which is the main winter wheat producing country were not high, only about 3000 kg/hm2. In addition to these regions which were the main winter wheat producing areas, the realistic potential
productivity in other regions of the world were very low and mainly less than 1500 kg/hm2, like in southwest region of Russia. The
gaps between potential productivity and realistic productivity of winter wheat in Kazakhstan and India were biggest, and the percentages of the gap in realistic productivity of winter wheat in Kazakhstan and India were more than 40%. In Russia, the gap between potential productivity and realistic productivity of winter wheat was lowest and the percentage of the gap in realistic productivity of winter wheat in Russia was only 10%.
* Corresponding author.
1. INTRODUCTION
Over the next few decades, the worldwide demand for agricultural products will grow considerably because of increasing populations, the use of agricultural products as biofuels and changing diets (Sacks et al., 2011; Tilman et al., 2011; Regmi and Meade, 2013). This increasing demand can be satisfied by expanding cultivated areas, however the ecological and social trade-offs of further land expansion are high in most areas (Lambin et al., 2011). Most future increases in agricultural production are therefore likely to be generated by improving the output per unit of land, that is, from higher land productivity (Schierhorn et al., 2014). The range of future increases in land productivity is substantial in many transition and developing countries where the differences between the potential yield under optimum management and the yields that are actually achieved by farmers, that is also to say the yield gaps are large (Hall et al., 2013; Affholder et al., 2013; van Ittersum and Cassman, 2013; Lu and Fan, 2013). Decreases in the yield gaps will typically require higher and more efficient input use (fertilizers, pesticides, and water) and improvements in crop management (Evans and Fischer, 1999). Moreover, to decrease yield gaps necessitate investments in infrastructure, supportive agricultural policies and agronomic research (Tilman et al., 2011; Neumann et al., 2010; George, 2014). In addition, the increased demand for food supply worldwide calls for improved accuracy of crop productivity estimation (Brown et al., 2012).
Wheat is the most widely grown crop worldwide and is an essential component of the global food security mosaic. Wheat
provides one-fifth of the total caloric intake of the world population (Reynolds et al. 2011) and is produced on an area of over 200 million hectares worldwide (Ortiz et al. 2008). The area of winter wheat accounts for more than 80% of the total wheat-growing area. Winter wheat is typically grown in winter and spring, seasons where climate warming is anticipated or already occurring. In this paper, based on the historical winter wheat yield data in recent 30 years (1983-2011) and the climate data (temperature, precipitation and ), the evaluation model of winter wheat realistic potential productivity was proposed. And the potential productions of winter wheat in the world were investigated.
2. MATERIALS AND METHODS
2.1 Data
weather stations were interpolated into a 10 × 10 km grid with a projection that was the same as the remote sensing data (LAI).
In this paper, the statistical data on winter wheat yield were obtained from the Food and Agriculture Orgnization (FAO, 2014) for the period 1982–2011. The climate zone data were built by considering historical climatic conditions, and in the process AEZ (Agro-Ecological Zones) method developed by the
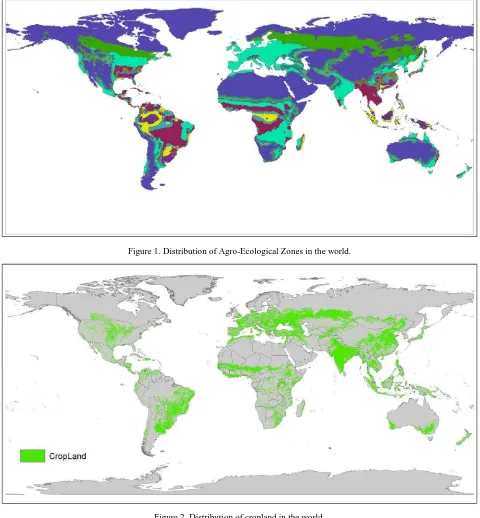
Food and Agriculture Organization (FAO) and International Institute for Applied Systems Analysis (IIASA) for rational land use planning and management (IIASA and FAO, 2002) had been also referred. The cropland data that was used to identify arable fields was derived from Global Land Cover SHARE (GLC-SHARE) database, which is released by FAO in 2014 (FAO, 2014).
Figure 1. Distribution of Agro-Ecological Zones in the world.
Figure 2. Distribution of cropland in the world.
2.2 Methods
2.2.1 Crop yield distribution based on remote sensing data
The vegetation indices derived from the visible and near infrared wavelength of canopy reflectance, such as normalize difference vegetation index (NDVI), enhanced vegetation index (EVI) and wide dynamic range vegetation index (WDRVI)
growth in the world. With the historical winter wheat yield data AVE(WPd) represented the average value of WPd.
2.2.2 Evaluation of winter wheat potential productivity
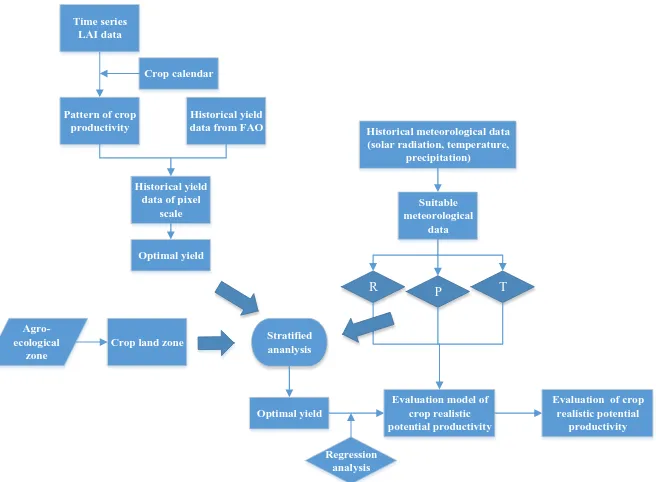
In our study, the evaluation model of winter wheat realistic potential productivity based on ago-ecological zone was proposed. And the potential productions of winter wheat in the world were investigated as the steps illustrated in Fig. 3.
Historical yield
Figure 3. Schematic of the steps to evaluate crop realistic potential productivity.
Step1: the distributions of historical winter wheat productivity were calculated and the optimal yield was selected which was defined as average of the yields of the best three years during
1983-2011 for each pixel. Meanwhile, the suitable
meteorological data, mainly include temperature (T), solar radiation (R) and precipitation (P) was defined as average meteorological data of the yields of the best three years during 1983-2011 for each pixel.
Step2: many classes of climate were identified using regular percentiles of the climate frequency distribution over each agro-ecological zone and then extracting the 95th percentiles of winter wheat yield for each of these classes and which was the optimal yield (Y) of the climate zone.
Step3: a function to each of the series was fitted empirically between the optimal yield (Y) and climate class median pairs (T, R and P).
Step4: the resulting functions can then be spatially modelled using the climate layer (T, R and P), and estimating a layer showing the potential production of winter wheat in each pixel.
3. RESULTS AND ANALYSIS
Based on the evaluation model of winter wheat realistic potential productivity which was proposed in the methods apartment, the potential productions of winter wheat in the world were investigated. The distribution of the winter wheat realistic potential productivity was presented in Figure 4. It can be seen from figure 4 that the realistic potential productivity of
winter wheat in Western Europe mainly include United Kingdom, Germany and France was highest and it was more than 7500 kg/hm2. The realistic potential productivity of winter
wheat in North China Plain were also higher, which was about 6000 kg/hm2. In the north-eastern Brazil, the realistic potential
productivity of winter wheat was about 4500 kg/hm2. However,
the realistic potential productivity of winter wheat in the United States which is the main winter wheat producing country were not high, only about 3000 kg/hm2. In addition to these regions
which were the main winter wheat producing areas, the realistic potential productivity in other regions of the world were very low and mainly less than 1500 kg/hm2, like in southwest region
of Russia.
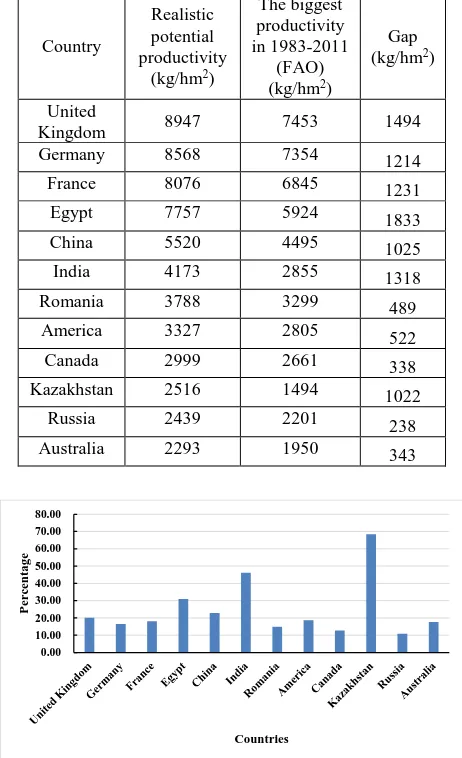
In the main producing countries of winter wheat, we conducted statistical analysis on the realistic potential productivity of winter wheat and the results showed in table 1 and figure 5. It can be seen from table 1 and figure 5 that the gaps between potential productivity and realistic productivity of winter wheat
in Kazakhstan and India were biggest, which were 1022kg/hm2
and 1318kg/hm2. And the percentages of the gap in realistic
Figure 4. Distribution of the winter wheat realistic potential productivity in the world.
Table 1 The statistic of the realistic potential productivity of winter wheat in the main winter wheat producing countries
Country
Realistic potential productivity
(kg/hm2)
The biggest productivity in 1983-2011
(FAO) (kg/hm2)
Gap (kg/hm2)
United
Kingdom 8947 7453 1494
Germany 8568 7354 1214
France 8076 6845 1231
Egypt 7757 5924 1833
China 5520 4495 1025
India 4173 2855 1318
Romania 3788 3299 489
America 3327 2805 522
Canada 2999 2661 338
Kazakhstan 2516 1494 1022
Russia 2439 2201 238
Australia 2293 1950 343
0.00 10.00 20.00 30.00 40.00 50.00 60.00 70.00 80.00
P
er
ce
nta
g
e
Countries
Figure 5. The percentage of the gap in realistic productivity of winter wheat in different countries.
4. CONCLUSION
In this study, the evaluation model of winter wheat realistic potential productivity was proposed based on agro-ecological zone, the historical winter wheat yield data in recent 30 years (1983-2011) obtained from FAO and the climate data. And the potential productions of winter wheat in the world were investigated. The results showed that the realistic potential productivity of winter wheat in Western Europe was highest and it was more than 7500 kg/hm2. The realistic potential
productivity of winter wheat in North China Plain were also higher, which was about 6000 kg/hm2. However, the realistic
potential productivity of winter wheat in the United States which is the main winter wheat producing country were not high, only about 3000 kg/hm2. In addition to these regions
which were the main winter wheat producing areas, the realistic potential productivity in other regions of the world were very low and mainly less than 1500 kg/hm2, like in southwest region
of Russia.
The gaps between potential productivity and realistic productivity of winter wheat in Kazakhstan and India were biggest, and the percentages of the gap in realistic productivity of winter wheat in Kazakhstan and India were more than 40%. Meanwhile, the gaps between potential productivity and realistic productivity of winter wheat in United Kingdom, Egypt and China were higher. In Russia, the gap between potential productivity and realistic productivity of winter wheat was lowest and the percentage of the gap in realistic productivity of winter wheat in Russia was only 10%.
ACKNOWLEDGEMENTS
REFERENCES
Affholder F, Poeydebat C, Corbeels M, et al. 2013. The yield gap of major food crops in family agriculture in the tropics: assessment and analysis through field surveys and modelling. Field Crops Research, 143: 106-118.
Brown M E, De Beurs K M, Marshall M. 2012. Global phenological response to climate change in crop areas using satellite remote sensing of vegetation, humidity and temperature over 26years. Remote Sensing of Environment, 126, pp.174-183.
Evans L T, Fischer R A. 1999. Yield potential: its definition, measurement, and significance. Crop Science, 39(6), pp.1544-1551.
FAO, 2014. FAOSTAT. FAO Statistics Division,
http://faostat3.fao.org/download/Q/QC/E/ (accessed 23.6.2014).
FAO. 2014. Global Land Cover SHARE (GLC-SHARE) database Beta-Release Version 1.0.
IIASA and FAO, 2002. Global Agro-ecological Assessment for Agriculture in the 21st Century: Methodology and Results.
George T. 2014. Why crop yields in developing countries have not kept pace with advances in agronomy. Global Food Security, 3(1), pp.49-58.
Hall A J, Richards R A. 2013. Prognosis for genetic improvement of yield potential and water-limited yield of major grain crops. Field Crops Research, 143, pp.18-33.
Jones I H, Harris I. 2013. CRU TS3. 20: Climatic Research Unit (CRU) Time-Series (TS) Version 3.20 of High Resolution Gridded Data of Month-by-Month Variation in Climate (January 1901–December 2011). Climate Research unit data , doi, 10: D0E1585D-3417.
Lambin E F, Gibbs H K, Ferreira L, et al. 2013. Estimating the world's potentially available cropland using a bottom-up approach. Global Environmental Change, 23(5), pp. 892-901.
Lu C, Fan L. 2013. Winter wheat yield potentials and yield gaps in the North China Plain. Field Crops Research, 143, pp.98-105.
Neumann K, Verburg P H, Stehfest E, et al. 2010. The yield gap of global grain production: A spatial analysis. Agricultural systems, 103(5), pp.316-326.
Ortiz R, Sayre K D, Govaerts B, et al. 2008. Climate change: Can wheat beat the heat?. Agriculture, Ecosystems & Environment, 126(1), pp.46-58.
Regmi A, Meade B. 2013. Demand side drivers of global food security. Global Food Security, 2(3), pp.166-171.
Reynolds M, Bonnett D, Chapman S C, et al. 2011. Raising yield potential of wheat. I. Overview of a consortium approach and breeding strategies. Journal of Experimental Botany, 62(2), pp.439-452.
Sacks W J, Kucharik C J. 2011. Crop management and phenology trends in the US Corn Belt: impacts on yields, evapotranspiration and energy balance. Agricultural and Forest Meteorology, 151(7), pp.882-894.
Sakamoto T, Wardlow B D, Gitelson A A. 2011. Detecting spatiotemporal changes of corn developmental stages in the US corn belt using MODIS WDRVI data. Geoscience and Remote Sensing, IEEE Transactions on, 49(6), pp.1926-1936.
Sakamoto T, Gitelson A A, Arkebauer T J. 2013. MODIS-based corn grain yield estimation model incorporating crop phenology information. Remote Sensing of Environment, 131, pp.215-231.
Schierhorn F, Müller D, Prishchepov A V, et al. 2014. The potential of Russia to increase its wheat production through cropland expansion and intensification. Global Food Security, 3(3), pp.133-141.
Tilman D, Balzer C, Hill J, et al. 2011. Global food demand and the sustainable intensification of agriculture. Proceedings of the National Academy of Sciences, 108(50), pp.20260-20264.
van Ittersum M K, Cassman K G. 2013. Yield gap analysis—
Rationale, methods and applications—Introduction to the
Special Issue. Field Crops Research, 143, pp.1-3.