115
Capacity Calculation Filter For Saving and Reability
to Industrial Electricity
#
Zulkarnaini Zulkarnaini,
#Dasman Dasman,
#Zuriman Anthony,
*
Azkia Azkia
#Department Electrical Engineering of Industrial Technology Faculty (ITP) Padang Indonesia #E-mail: [email protected]
*Student of Department Electrical Engineering ITP
Abstract— Harmonics is a phenomenon that occurs in the industry due to the non-linear electrical load. Harmonic distortion in term of voltage and current ones, generally is due to non linier impedance. This research is a simulation of a simple control scheme for a three-phase shunt passive filter to remove harmonics and save energy compensation of the non-linear loads. Therefore, with the work of the security Molded Case Circuit Breakers (MCCB) and the relay is not in accordance with the rating works. Non linear loads is of Computers, Printers, Air Conditioning (AC), Rectifier, energy saving lamps, motor control, etc. in industrial that cause harmonics. If the voltage and current har-monics injected into wire electrical installation of the industry, there will be a the Harmonic Distortion in power system. Voltage and current harmonics appearing will be a serious problem if the amount exceeds the limits of the standards set by the standards (IEEE 519-1992) Interna-tional Electrotechnical Commission (IEC). This study is forward to analyze the harmonics distortion by using ETAP software, Result of this study show that THDi obtained before using the filter of 33% and after use filters THDi 13%. There are saving electrical current of 11 Am-peres before using the filter 476 Ampere and after using the filter to 465 Ampere. Means a saving of 2.3%.
Keywords— THDi, Filter, Save Energy.
I. INTRODUCTION
Harmonic is the problem of non - linear loads con-tinue to grow at a industry. This is become a new challenge to build both economical and reliable electric power supply, because there is a change of power supply at electrical equipment installed in a industry [1]. The increasing of use of electronic equipment can cause large harmonic distortion in the future [2]. The most common problem is harmonic caused by non-linear loads such as electrical equipment in building, air conditioning (AC), lighting, computer, induction motor, motor speed control unit, etc. In general, harmonics does not create problem. Odd multiple harmonics can cause changes of value, which is highly unexpected [1,2,3]. Especialy for three-phase induction motor, the harmonic distortion can be decreased by installing a capacitor bank to the winding on the motor [4,5].
Referring to the characteristic non-linear load which used in the industry causes harmonics. If the voltage and current harmonics will be injected into the wire electrical installation of the industry, there will be a voltage and cur-rent harmonic distortion [6]. Voltage and curcur-rent harmonics are visible in the form of sinusoidal wave that is not pure anymore [7].
It is very disturbing for protection devices (MCCB) and measuring devices to operate on a sinusoidal wave [8]. Cur-rent harmonic distortion is one of the problems of electric power quality suffecient to have a major influence on system performance of electricity power. These problems can
dam-age and shorten the life of electrical equipment as well as energy waste [9]. In addition, harmonic distortion may also affect the calculation of KWH Meter measuring devices that cause loss to the electrical consumers. So here many users to add to its power . Referring to the previous studies on the effects of harmonics MCCB, the greater the harmonic load the faster the MCCB trip (drop out) [10]. Based on the nega-tive effects of harmonics are generated, it would require an effort to suppress harmonics has been occured. One of them using a passive filter which is more widely used because of being, reliability, more economical, and easier to maintain.
II.LITERARY REVIEW
Basically, the voltage and current waveform are dis-tributed from sources to load in sinusoidal wave form. How-ever, the distribution and installation process are interference a variety of disorders that are not sinusoidal waveform pure . One of the phenomena sinusoidal waveform aberrations are not linear [11].
116 Figure 2: The fundamental wave and harmonic level 3 the phase difference of 180 and the fundamental wave shape is distorted by
the third harmonic [12]
Figure 3: The Fundamental wave and the harmonic level 3 the phase difference of 0 and the fundamental wave shape is distorted
by the third harmonic [12]
Voltage and current forms distorted can be obtained by summing algebraically the basic wave (generated by the plant) with harmonic waves which are having a frequency, amplitude, and phase angle varies. Furier analysis has been used to analyze amplitude and frequency of the wave which have been distorted [13].
2.1 Electrical quantity on condition not Sinusoidal
When the harmonic in steady state, the voltage and current can be represented by Fourier series as follow:
With dc section usually ignored for simplicity, Vh and Ih rms
value of the harmonic order to h on each voltage and current, the instantaneous power is,
p(t) = v(t) . i(t) (3)
If equations (1) and (2) substituted with (3) by using orthogonal relationship,
Equation (6) shows that each harmonic contributes to the average power, average power that is generated harmon-ics are usually small when compared to the average power base.
2.2 Harmonic Index
In a harmonic analysis, some of the following im-portant indices used to describe the effects of harmonics on the power system components and communication systems.
1. Total harmonic distorsion (THD)
%
2. Totaldemand distorsion (TDD)
L minutes in the fundamental frequency at the point of connec-tion.
(sin(ar first ar final
Sx standard IEEE - 519-1992 :
Table 1: Limit Current Distortion (0,12kV- 69kV) Maximum Harmonic Current Distorsion in (%) of IL
117 III.METHODOLOGI
The method used is descriptive method the writers take four stages by performing harmonic calculations make use of software ETAP as follows [12]:
1. Provision stage research facilities. 2. Data collection phase.
3. The data analysis phase. 4. Inference research.
In accordance with data to be studied, the stages will be car-ried out by using certain methods and techniques that are tailored to their behavior.
Data Collection
Data collection was performed by means of meas-urements on each load and also on the total load of the industry of water intake Gunung Pengilun Regional Water Supply Company (PDAM) Padang City.
Fig 4: Single line diagram of Water Intake Gunung Pengilum [15] Once built single line diagram based on the available data, the obtained single line diagram as shown in Figure 4.1. In the single line diagram is shown one motor connected to the source of harmonic nature as a current source that will inject harmonic currents in accordance with a typical load mounted on Water Intake PDAM Padang City.
Harmonic on the main panel can be seen in Table 4 below
Table 2: The main panel harmonic measurement results non filter
With the current waveforms main panel non filter as follows:
Fig 5: Current waveform of main panel non filter h3[15]
Fig 6: Current waveform of main panel non filter h5 [15]
Fig 7: Current waveform of main panel non filter h7[15]
IV.RESULT AND DISCUSSION
Based on the above data analysis is carried out using a filter is needed with ETAP software. From the simulations shown in the table THDi each building is dominated by 3rd
harmonic level,5th and 7th
.
Preferred harmonic filterinstalla-tion on the main panel, because the harmonics will be col-lected at the main panel. To fix THDi and contained in the system.
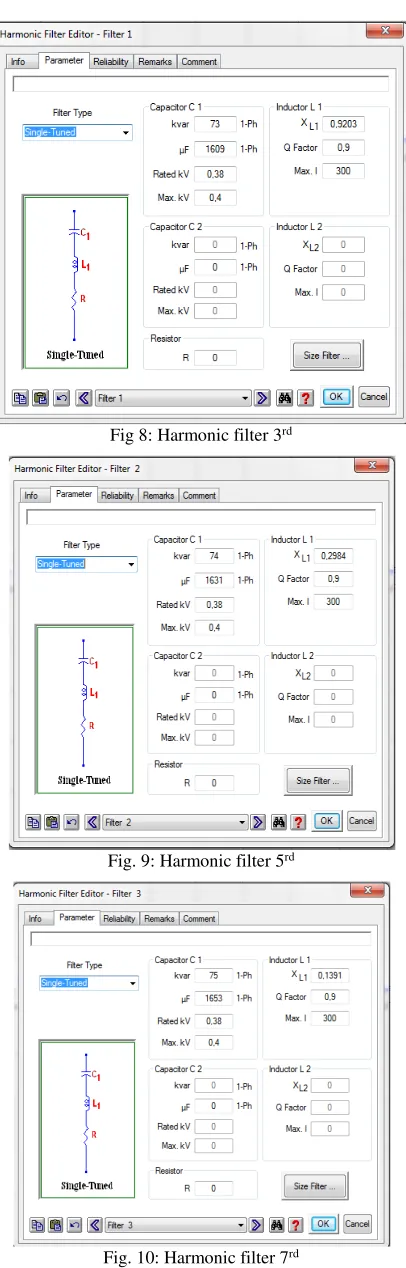
118 Fig 8:Harmonic filter 3rd
Fig. 9:Harmonic filter 5rd
Fig. 10:Harmonic filter 7rd
Having obtained the filter analysis, 3 order, 5 order and 7 order then we can see the changes THDi on the system by modeling ETAP-Program.
Fig. 11: Theharmonic filter
Table 3: Harmonic measurement results be used filter No Harmonic B. L (mH) C. C(µF)
D. 1 3 E. 29 F. 160.9
G. 2 5 H. 29 I. 163.1 J. 3 7 K. 29 L. 165.3
Table 4: Harmonic measurement results be used filter
With the current waveforms main panel used filter as fol-lows:
119 Fig. 13: Current waveform of main panel used filter harmonic 5rd
[15]
Fig. 14: Current waveform of main panel used filter harmonic 7rd [15]
From the above, the simulation results obtained following the harmonic filter.
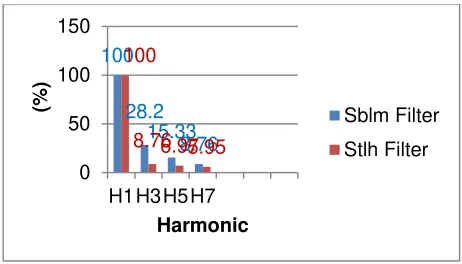
Based on the research, it can be graphed the results of before and after using a single tunned filter as following:
Fig. 16: The harmonic value before and after the be used filter
Fig. 17: The current value comparison chart before and after the be used filters
Based on the results of the research, the electricity load of industry contain many harmonics.
V. CONCLUSIONS
After the process of planning, manufacture and test-ing tools as well as by compartest-ing the theories supporttest-ing, and from the data obtained it can be concluded:
1. By using a simulation program ETAP then obtained harmonic level 3 28.20% after using a filter to 8.76%, the harmonic level 5 15.3% after using a fil-ter to 7.84%, and, harmonic levels 7 8.76% affil-ter Watt , usage/day 3.971 x12h = 47.652 Watt haurs/ day = 47,3 kWh/day.
4. In designing single tunned filter on the burden of very expensive Industry of the maximum power load of the industry equipment to anticipate the amount of reactive power required
ACKNOWLEDGMENT
I extend a thank you to the team at electrical engi-neering laboratory of Institut Teknologi Padang, who have been helped this research run smoothly. I would also like to thanks for the “Directorate General of Human Resources for Science“ Technology and Higher Education of Indonesia “Investigation of Harmonik Current Source Effect on Distribution and Transmission Lines Capacity and Losses, Case Study. International Journal “Technical and Physical Problems of Engineering” Published by International Organization on TPE (IOTPE) (2011) In Industrial Plant Distribution systems. IEEE Transc. On Industrial Aplications Vol 1A.23.no. 3, (1987)
120 [6] Ho, J.M. dan Tsou, T.L., The Effect Analisis and Simulation Test of
Harmonics onDifferential Protection of Scott Transformer, Depart-ment of Electrical EngineeringCchung-Yuan University, Chungli- Li Taiwan. (2001)
[7] J.Arrilaga, . Power System Quality Assesment. John Wiley & Sons Ltd. New York.(2000)
[8] Sutanto, J. dan Buhron, H., Harmonic Implikation in Electrical Power Sistem and Alternatif Solution, email:[email protected]. Semarang. (2001).
[9] Anthony Z, “A simple methode for operating the three phase induction motor on single phase suplay ( for wye conection standard ) International juonal of Engeneering Trends and Technology (IJETT) vol 5 no 1 Nov.( 2013)
[10] Hegazy, Y.G., dan Salama, M.M.A., Calculation of diversified har-monic currents in electric distribution systems, IEE Proceding Gen-eral Transmission and Distribution Vol. 150, No. 6, 651-658. 2003 [11] Zulkarnaini, Tumiran, Haryono T, “Effect of harmonic loads on over
current relay toDistribution system protection” Proceedings of the International Conference on Electrical Engineering and Informatics (ICEEI) ITB Bandung vol. I 138-141 (2007)
[12] Zulkarnaini, ” Influence of harmonic load on Miniature Circuit Break-ers ( MCB ) as protection Electric Appliances "Proceedings of the national seminar on Engineering Science and Technology, Univ. Bung Hatta Padang ISSN : 2087-2526 14 Nov. 2012
[13] Zulkarnaini, ” The design of harmonic filters for electric Household " Proceedings of the national seminar on Vocational Education ISSN : 1907-3739 9 Nov. (2013) Fak. Teknik Univ. Negeri Padang. [14] T. Ghose, S.K. Goswami, “Effects of Unbalances and Harmonics on
Optimal Capacitor Placement in Distribution System”, Elsevier
Electric Power Systems Research,( 2004).
![Figure 1: The basic concepts of harmonic waves [12]](https://thumb-ap.123doks.com/thumbv2/123dok/4056075.1999495/1.595.331.533.666.748/figure-basic-concepts-harmonic-waves.webp)
![Figure 2: The fundamental wave and harmonic level 3 the phase difference of 180 and the fundamental wave shape is distorted by the third harmonic [12]](https://thumb-ap.123doks.com/thumbv2/123dok/4056075.1999495/2.595.309.529.194.369/figure-fundamental-harmonic-level-difference-fundamental-distorted-harmonic.webp)
![Fig 7: Current waveform of main panel non filter h7[15]](https://thumb-ap.123doks.com/thumbv2/123dok/4056075.1999495/3.595.312.549.84.505/fig-current-waveform-main-panel-non-filter-h.webp)