Performance Analysis of Cell Zooming Based Centralized
Algorithm for Energy Efficient in Surabaya
Hani’ah Mahmudah, Okkie Puspitorini, Ari Wijayanti, Nur Adi Siswandari, Rosabella Ika Yuanita
Telecommunication Engineering Politeknik Elektronika Negeri Surabaya Jalan Raya ITS, Sukolilo 60111, Indonesia
E-mail: {haniah,okkie,ariw,nuradi}@pens.ac.id, [email protected]
Abstract
The cellular subscribers’s growth over the years increases the traffic volume at Base Stations (BSs) significantly. Typically, in central business district (CBD) area, the traffic load in cellular network in the daytime is relatively heavy, and light in the daynight. But, Base Station still consumes energy normally. It can cause the energy consumption is wasted. On the other hand, energy consumption being an important issue in the world. Because, higher energy consumption contributes on increasing of emission. Thus, it requires for efficiency energy methods by switching BS dynamically. The methods are Lower-to-Higher (LH) and Higher-to-Lower (HL) scheme on centralized algorithm. In this paper propose cell zooming technique which can adjusts the cell size dynamic based on traffic condition. The simulation result by using Lower-to-Higher (LH) scheme can save the network energy consumption up to 70.7917% when the number of mobile user is 37 users and 0% when the number of mobile user is more than or equal to 291 users. While, Higher-to-Lower (HL) scheme can save the network energy consumption up to 32.3303% when the number of mobile user is 37 users and 0% when the number of mobile user is more than or equal to 292 users. From both of these schemes, we can analyze that by using Lower-to-Higher (LH) scheme reduces energy consumption greater than using Higher-to-Lower (HL) scheme. Nevertheless, both of them can be implemented for energy-efficient method in CBD area. Eventually, the cell zooming technique by using two schemes on centralized algorithm which leads to green cellular network in Surabaya is investigated.
Wireless communication in cellular system grows rapidly because the rising of subscribers can impact on the increasing of traffic volume. Particularly, in UMTS system promises the higher bandwidth and data rate for new services, as though video call. To fulfill the subscribers’s requirement economically, operators have to do their best. The area where mobile users get data signals and control signals are transmitted by the Base Station (BS) is defined as the cell size. In the cellular network planning, capacity and cell size are considered based on the forecasting of peak traffic load [1].
The traffic load of cellular network in the central business district (CBD) area during the daytime, mostly in heavy load in the offices and light load in residential areas relatively. It has an opposite condition. Basically, in cellular network planning, the network capacity of each cells are determined relating to the peak of traffic volume. It causes the load distribution will not be appropriate, hence the imbalance of traffic load is happen. As a result, there are cells in light load and some are in heavy load. The cell deployment can not be a solution for this traffic fluctuation. The case of traffic fluctuations causes some Mobile Users (MU) are incapable for obtaining none of services from Base Stations (BSs), while the neighboring cells are not currently provide services to users as many as have to be served by serving cells. As
Figure 1. Normalized traffic diversity of different cells in three weeks [2]
distribution at a time. Meanwhile, cell 3 consumes energy as much as cell 1 and cell 2 consumed. It led to a use of wasted energy and cost.
The advancement of telecommunication technology aims to provide higher bit rate of data access, as example spectrum reuse, distributed antenna system, smaller cells deployment and coordinated multi-point (CoMP)[3-7]. However, the provision of higher bit rate has an impact on the users, in term of cost have to be paid by the subscribers. Otherwise, both from an environment and economic viewpoints, the achieving the higher bit rate has the consequence for the raising of basic sustainability question of cellular network. Energy consumption in cellular network is not only leading to higher operating cost of cellular network, but also the worsening global warming phenomenon. Cellular operators must provide performance growth and sustainability economic capacity by proposing both lower cost for superior users and improved coverage. Due to the increasing of the overall energy accumulate in the range from 1% to 10% of the total utilization [10], [12], and [13]. Thus, by diminishes the energy consumption can raises the energy efficiency in cellular network. Base Stations with non-load-proportionality energy consumption characteristic, at no-load condition draw a significant amount of energy.
On the other hand, the traffic demand of cellular network varies both in space and time which related to the population density of the environmental and pattern of users mobility [10], [14], and [15]. Conventionally, BSs run in “always-on” mode for 168 hours in a week and are estimated according to the peak-traffic periods. Based on data of traffic load from various operators has been identified clearly that the traffic intensity in residential areas at daytime are much lower than peak-traffic hours, nevertheless BSs are remain in big portion of energy even are under-utilized.
zooming technique. Cell zooming is a concept which the size of cell can be adjusted according to the traffic condition.
In summary, due to the lack of the previous studies, in this paper investigates some schemes for energy efficient way by dynamic switching mechanism using centralized algorithm at central business district (CBD) area in UMTS system.
This paper consists of some sections : explanation of related work in section II, section III investigates the concept of cell zooming using centralized algorithm for energy saving way, section IV shows the simulation algorithm to implement energy efficient method in UMTS system at CBD area, and performance analysis of the proposed scheme through simulation in section V. The end section of this paper, section VI presents the conclusion of simulation results.
2. RELATED WORKS
Recently, many researchers have been discussed about dynamic BS switching mechanisms for energy efficiency in cellular network.
Md. Farhad Hossain [22] discussed about traffic-driven energy efficient operational mechanisms in cellular access networks. In this paper, presented some energy efficient ways such as distributed dynamic switching of BS for both single and multi network scenario, a centralized algorithm for both dynamic sectorization and BS switching, also a two-dimensional dynamic network reconfiguring mechanism by applying dynamic sectorization and BS switching jointly for energy savings in OFDMA-based cellular access networks. In addition, centralized dynamic switching BS proposed 4 schemes for User Equipment (UE) association policy, there are Lower-to-Higher (LH),
Higher-to-Lower (HL), Sequential-Sequential (SS) and Sequential-to-Better-Signal (SBS) scheme.
Z. Niu, et al [23] discussed about technique of cell zooming for cost-efficient green cellular networks. In this paper, presented both centralized and distributed algorithm for energy savings in UMTS-based cellular access networks which led to green cellular networks. Cell zooming is a concept of adaptively adjusts the cell size according to the traffic condition. This concept also can be used for balancing traffic. Both energy saving and traffic balancing are implemented without compromising the required (Quality of Service) QoS.
3. ORIGINALITY
Global warming has become one of global issues in the world, including in Indonesia. To mitigate the effect of global warming phenomenon, we propose technique of cell zooming using centralized algorithm as one of the contribution. Due to the lack of the previous research (as presented on section II), in this paper proposes new approaches for energy efficient method as follows : (1) Implemented in Surabaya city-based locations. Surabaya city is one of the metropolitan city in Indonesia which has both office and residential areas, (2) Central business district (CBD) area for deployment scenario, (3) UMTS-based cellular access networks, (4) Using Macrocell base stations deployment, and (5) Using two combinations of scheme on centralized algorithm for user association policy. Those are
Lower-to-Higher (LH) and Higher-to-Lower (HL) scheme for energy savings. Those schemes are used for demonstrating of attempt order of neighboring cells for associating User Equipments (UEs) of a cell. The ordering number are determined by different energy proportionality values of each cells. BS switching policy is used for determining the cells which are remain in active mode and other cells are allowed to be switched into sleep mode for a certain period of cell zooming. Centralized algorithm is one of the method for reduce the energy consumption in cellular network. As a result of this research, percentage of sleep mode BSs and net energy saving of each periods of time are calculated and to be analyzed.
4. SYSTEM DESIGN
Figure 2. Diagram system of proposed approach for energy efficient
4.1 Modelling System of UMTS-Macrocell Network
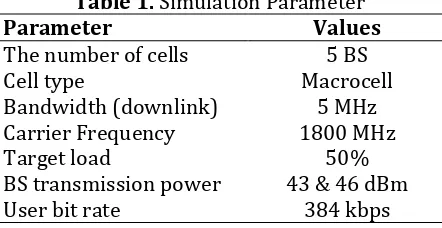
The first part of section IV is about modeling system using central business district UMTS-Macrocell network. In this paper will be modeling of system using homogeneous network. NodeB network layout are designed to have hexagonal cells pattern which have three sectors of each cell. This research using a modeling system based on existing environmental condition, there is central business district (CBD) deployment scenario. There are some scenarios of the number of User Equipment (UE) have been used in this paper. The UEs are distributed at the central point of each cell randomly. Table 1 shows parameters used in this simulation,
Table 1. Simulation Parameter
Parameter Values
The number of cells Cell type
5 BS Macrocell Bandwidth (downlink) 5 MHz Carrier Frequency 1800 MHz
Target load 50%
BS transmission power User bit rate
43 & 46 dBm 384 kbps
A.Network Layout
In this paper, using central business district (CBD) scenario of BS’s environment in Surabaya city. CBD is the focal point of a city which comprises office, commercial space, culture center, public park, and the
Lower-to-Higher (LH) scheme Higher-to-Lower (LH) scheme UE association policy
Modelling system UMTS-Macrocell Network
Central business district deployment scenario
Implementation of centralized algorithm Initialize parameter of simulation
Data output representation
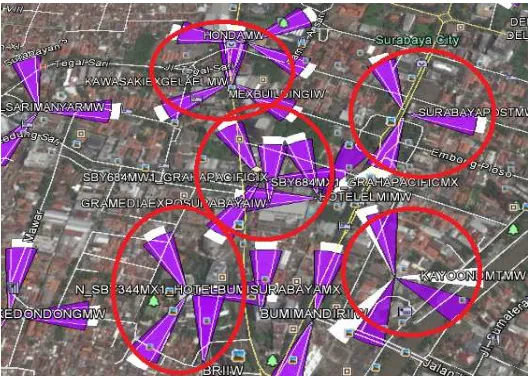
center point for transportation networks. The network layout of this simulation is shown in Fig. 3.
Figure 3. Network layout of CBD area of Surabaya city
B.UMTS Architecture
In principle, the transmission of UMTS radio interface is different from the GSM phase of 2.5 G (WCDMA as a substitute for TDMA / FDMA). Therefore, the UTRAN introduced as the new RAN in UMTS. Architecture 2G and 3G cellular system is shown in Fig. 4.
Figure 4. Architecture of UMTS cellular system
C. Uplink Load Factor
The uplink load factor of a WCDMA cell is generally used to make a semi-analytical forecast of the average capacity, it can be calculated by using this equation [24] :
ηUL =
R W
N Eb o
/ /
. N . v . (1 + i) (1)
The detail parameters used to calculate the uplink load factor from above equation can be known in Table 2 as follows,
Table 2. Parameters used in uplink load factor calculation
Parameters Definitions Recommended Values [24]
N Number of users per cell
vj Activity factor of user j at physical layer 1 for data
Eb/No Signal energy per bit divided by noise spectral density that is required to meet a predefined Block Error Rate, BLER. Noise includes both thermal noise and interference
1 dB for data service
W WCDMA chip rate 3.84 Mcps
Rj Bit rate of user j 384 kbps for data service (outdoor user)
i Other cell to own cell interference ratio seen by the base station receiver
D.Power Consumption of Macrocell Base Station
Typically, a macrocell base station consists of power consuming components. Those components are divided into two groups, there are the equipment that has been used each sector (i.e. digital signal processing, power amplifier, transceiver and rectifier) and common for all sectors (i.e. microwave link and air conditioning). And also, the components of macrocell base station can be devided into two categories, in the following: not load dependent and load dependent power consumption. The power consumption of the power amplifier Pel/amp depends on the transmission power PTx is
Even, the power consumption of each component is known, the power consumption of macrocell base station Pel/macro can be calculated by this macrocell base station can be known in Table 3,
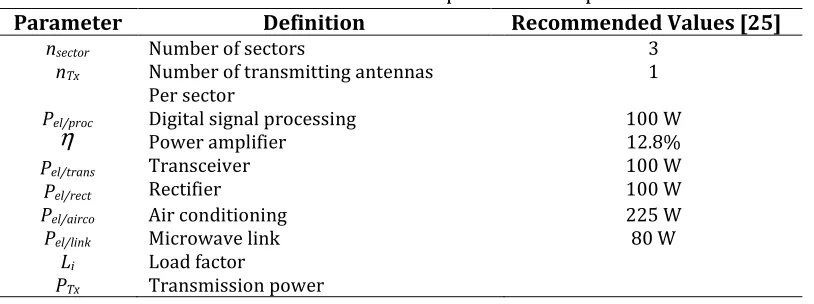
Table 3. Simulation Parameter used for power consumption calculation
Parameter Definition Recommended Values [25]
nsector Number of sectors 3
nTx Number of transmitting antennas Per sector
1
Pel/proc Digital signal processing 100 W
η
Pel/airco Air conditioning 225 W
Pel/link Microwave link 80 W
Li Load factor
The case investigated in this paper consists of five cells. The center of the cells are location of Base Stations (BSs), which illustrated by squares. Whereas, Mobile Users (MUs) of each cells are denoted by dots. Each BS consists of 3 sectors and are used to cover a region. MUs distributed in each cells randomly. The BS transmission power is required to determine the cell size and to compare with the minimum received power of mobile stations to meet the required signal to noise ratio (SNR) value. In Fig. 5, there are one central cell (in the center of the network) and 4 neighbor cells in the network
Figure 5. Cells with original size [1]
with original size. Those cells are in active mode. The size of each cells are same. Since the traffic load of central cell is light, then the central cell is switched into sleep mode, and all mobile users of switched-off BS is covered by the potential neighbor. The potential neighbors means that they are still have the capacity to receive all mobile users of central cell and extend their coverage by increasing the transmit power value to cover. Before deciding whether the central cell is allowed to switched into sleep mode, all neighbor cells are defined into the candidate BSs. There are two potential cells that still have capacity and capability for cover the sleep cell as in Fig. 6. For this condition, only the transmit power of neighbor cell is being increased, while the central cell is zoom in to zero completely for energy efficient. This because of the number of base stations are planned according to the peak of traffic load value of a time, but some base stations are not so. it In addition, the distance between neighbor cell and sleep cell must to be the nearest.
Figure 6. Central cells sleep and neighboring cells zoom out [1]
4.2 Area Determination
Fig. 7 below is block diagram to determine the area of implementation
Figure 7. Block diagram of area determination
Based on Fig. 7, formerly, we have determined the UMTS-Macro network for the implementation’s scenario. Next, we choose the area of implementation, because there are many regions in Surabaya, such as west Surabaya, central Surabaya, north Surabaya, and east Surabaya. And we decide to determine the central Surabaya as an area implementation because there are many offices building. In the morning, people move to this building and do some activities, such as working. While, in the evening, people move to their home and there is no one in the office building. But, BS always in active mode and consume energy in normal amount. Hence, this can be waste energy. And finally, we have to choose a cluster, also determine the serving cell based on the nearest distance, lower load factor and higher energy load.
4.3 Load Classification
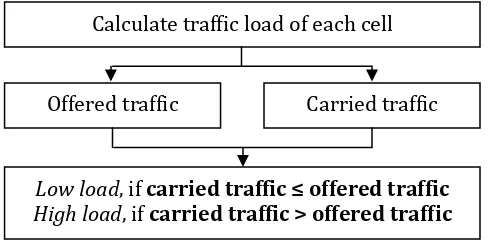
To determine a cell can be classified into low or high load we have to do as the following block diagram in Fig. 8,
Determined: UMTS-Macrocell Network in Surabaya
Choose the area
Figure 8. Block diagram of load classification
First, we have to calculate the traffic load of each cell within a determined cluster formerly. The traffic load consists of offered and carried traffic. Offered traffic is defined as total traffic which will get into and have to be served by the system. While, carried traffic is defined as average traffic intensity which can be served by the system. Then, we can classify it into low or high load by this requirements:
1) Low load, if carried traffic ≤ offered traffic 2) High load, if carried traffic > offered traffic
4.4 Implementation of Centralized Algorithm
In the proposed centralized algorithm [22], if Lnet (t) < Lth, the central
coordinator itself triggers the network provisioning procedure followed by another triggering operation by each BS in its turn.
For deciding on a BS whether to switch into sleep mode, proposed algorithm starts with the initialization BON = B. It then takes one BS at a time
(say, Bi) and shecks its actual LF Li(t). If Li(t) ≤ Lth, Bi’s UE distribution process
is triggered. All UEs of Bi is distributed by associating them with the
neighboring BSs. Following utility function is then evaluated
Ui,BS(t)=
∑
=l
1
i
Pl* (t) / { Pi(t) +
∑
=l
1
i
Pl(t) } (6)
Let ℒ be the number of BSs to which UEs of Bi are to be associated, Pl(t) and Pl* (t) are the total operating power of lthneighbors before and after this
association respectively. If utility Ui,BS(t)< ηBS, (ηBS ϵ [0,1] is a constant), then
we set new BON = BON \ {Bi}. For Ui,BS(t)< 1, energy saving can be achieved by
switching Bi into sleep mode. The algorithm with all BSs, final BON provides
the list of BSs, which are kept active mode and the other BSs in B \ BON are
switched into sleep mode. Pseudo code of the proposed centralized algorithm [22] is presented in Table 4,
Calculate traffic load of each cell
Offered traffic Carried traffic
Low load, if carried traffic ≤ offered traffic
Table 4. Centralized AlgorithmCentralized Algorithm
BSs of Bi according to which the neighbors are approached for associating a
UE located in Bi. Here Ni,b is the number of active neighbors of Bi. By including
only the active neighbors in Bi,n, sleep mode BSs are allowed to sleep for
longer times and the number of switching is reduced. On the other hand, for selecting the sequence of BSs, Bseq = {B1*, B2*, …. , B|B|*} in which the algorithm
proceeds from one BSto another for distributing their UEs, various alternative are considered. The network having BSs with different energy proportionality (i.e., different values for ELPC δi, i = 1,2, …, |B|, following two
combinations of UE association policy [22] are investigated.
A. Lower-to-Higher (LH) Scheme
In this case [22], lower energy efficient BSs have the higher priority to distribute first. While, higher efficienct neighbors are given the higher priority for accepting UEs from other BSs. That means, Bseq = {B1*, B2*, …. , B|B|*}, δl* ≥ δm*, l < m, and Bi,n = {Bni,1 , Bni,2 , … , Bni,Ni,b}, δi,pn ≤ δi,qn, p < q. Here, δl*
and δi,pn are the ELPC of Bl* and Bn i,p respectively. The attempt order of
neighbor BSs by using LH scheme is explained in Table 5,
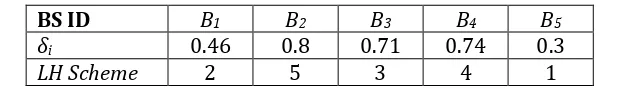
Table 5. Attempt order of neighbors using lower-to-higher (LH) scheme [22]
BS ID B1 B2 B3 B4 B5
δi 0.46 0.8 0.71 0.74 0.3
LH Scheme 2 5 3 4 1
B. Higher-to-Lower (HL) Scheme
In this scheme [22] is just the opposite of the LH scheme. Therefore, Bseq
= {B1*, B2*, …. , B|B|*}, δl* ≤ δm*, l < m, and Bi,n = {Bni,1 , Bni,2 , … , Bni,Ni,b}, δi,pn ≥ δi,qn, p < q. Theattempt order of neighbor BSs by using HL scheme is explained in Table 6,
BS ID B1 B2 B3 B4 B5
δi 0.46 0.8 0.71 0.74 0.3
HL Scheme 4 1 3 2 5
4.5 Percentage of Sleep Mode BSs and Net Energy Savings Study A.Percentage of Sleep Mode BSs
Those equation can be represented as the probability of switching-off BS.
B.Net Energy Savings
To measure the percentage of energy saving, it is important to ascertain the network energy consumed when all BSs are in active or in “always-on”
mode (EAO). For a time period (say, D = 24 hours), the network energy
consumption in “always-on” mode is can be modelled by equation [22] :
EAO
with respect to the “always-on” mode is given by [26]:
EES 1 100%
In this section, will discuss the simulation result of the implementation of cell zooming for energy efficient in UMTS system. The comparison and analysis the percentage of network energy savings and sleep mode BS using
lower-to-higher and higher-to-lower scheme on centralized algorithm are explained here.
5.1 Analysis of The Percentage of Sleep Mode BSs
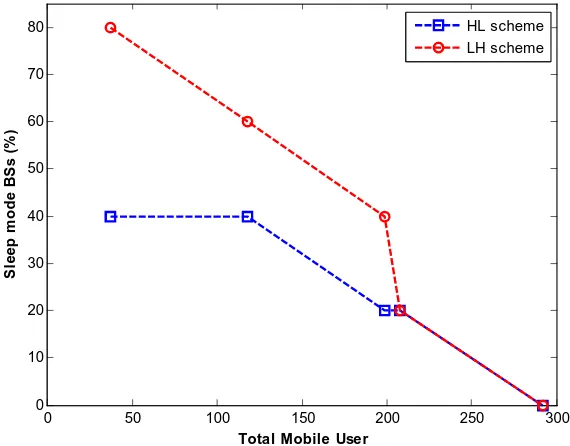
We have 5 scenarios of the number of mobile users to be analyzed, there are: 37, 118, 199, 208 and 292 mobile users in a cluster. The trade-off between the percentage of sleep mode BSs and total mobile user using both
lower-to-higher (LH) and higher-to-lower (HL) scheme in centralized algorithm was presented in Fig. 9.
mode in a period of time. Since the LH scheme associates all users to BS according to the higher ELPC. While, in the higher-to-lower scheme (HL), the value of the percentage of sleep mode BSs is 40% than using LH scheme. Comparing the result of the percentage of sleep mode BSs on both of schemes, in LH scheme achieves higher value and higher number of BSs in the sleep mode than using HL scheme. Those because in LH scheme gives higher priority for BSs in the lower energy efficient to be switched into sleep mode by distribute all UEs to the higher energy efficient and the network keeps the lower energy efficient BSs active to lead to higher savings. While, in HL scheme is the opposite of LH scheme, gives higher priority for BSs in higher energy efficient to switch to sleep mode by distribute its traffic to the
0 50 100 150 200 250 300
Figure 9. Sleep mode BSs – total mobile user trade-off under centralized algorithm
lower energy efficient. But, when the number of mobile users are 208 and 292 users, the percentage are 0%, it means that there are no one of BSs in a cluster can be switched into sleep mode. It caused by there is no capacity of neighbors is capable for accepting all UEs.
The percentage of network energy savings is calculated by using equation (8) and (9) results up to 70% for a whole day under the listed two schemes of UE association policies is shown in Fig. 10. Once again, for both of schemes in this simulation, the values of ELPC δare different for each BS. The BSs in “always-on” mode are active at all the time heedless the traffic load condition will consumes the most energy load (100%), called as constant energy consumption (CEC) of the BS’s power consumption model [22]. The energy savings under both LH and HL scheme are investigated in Fig. 10. As
0 50 100 150 200 250 300 350 400 450 500
Figure 10. Energy saving performance under centralized algorithm
seen in Fig. 10, when there is 37 mobile users in a cluster, the energy savings in LH scheme achieves 70%, but in HL scheme achieves 32%. Thus, the equal number of BSs in sleep mode using LH and HL scheme, in LH scheme achieves higher energy savings than in the HL scheme. This because in LH scheme prioritize the lower energy efficient to be switched into sleep mode. But, when there are more than 300 mobile users in a cluster using both LH and HL scheme, the percentage are 0%, it means that energy saving can not be achieved. The increase of the number of mobile users, the percentage of network energy savings decreases.
5.3. Analysis of BS Power Consumption Before and After Implementation of Cell Zooming
The total power consumption of BSs in the network according to the BS switching strategy for two different schemes for a day is shown in Fig. 11. Based on the data in Fig. 11, the total energy consumption before cell zooming implementation under the centralized algorithm is 7319.2 Watt for 5 BSs in the network. But, the total energy consumption after the implementation of cell zooming is 4275.6 Watt. This value is reduced of the value before the implementation. This is due to some BSs are to be switched into sleep mode, and other BSs are remain in active mode. The extension of
Figure 11. Total energy consumption of BSs before and after cell zooming
coverage is required for BSs who stay in active mode. To know the detail energy consumption of each BS in the network is illustrated in Fig. 12.
Figure 12. Power consumption of BSs before and after cell zooming
6. CONCLUSION
This section has proposed centralized algorithm for energy savings in UMTS-based cellular access networks are investigated. In addition, energy efficient method using UE association policies are also explored. The results of this simulation have demonstrated the potential to reduce the total energy consumption in the network up to 70% by using lower-to-higher (LH) scheme and up to 32% by using higher-to-lower (HL) scheme. The higher number of sleep mode BSs, the higher energy saving can be achieved. But, in LH scheme has better performance both the energy savings and the sleep mode BSs than HL scheme. The increase of transmit power is required for neighboring BSs to maintain coverage. Some parameters such as user bit rate, UE association, UE distribution and network configurations have large effect for achieving energy savings. The lower energy consumption, the higher cost-efficient can be achieved. Thus, for the next chapter, we will focus on developing BS switching mechanisms in LTE system in Surabaya.
REFERENCES
[1] V. Prithiviraj, S. B. Venkatraman, R. Vijayasarathi, Cell Zooming for Energy Efficient Wireless Cellular Network, Journal of Green Engineering, Vol. 3, pp. 421-434, 2013.
[2] D. Willkomm, S. Machiraju, J. Bolot, A. Wolisz, Primary User Behavior in Cellular Networks and Implications for Dynamic Spectrum Access, IEEE Communications Magazine, Vol. 47, no. 3, pp. 88-95, 2009. [3] Novlan, Ganti, Ghosh, Andrews, Analytical evaluation of fractional
frequency reuse for OFDMA cellular networks, IEEE Transactions on Wireless Communications, Vol. 10, no. 12, pp. 4294–4305, 2011.
[4] Choi, W. and Andrews, J. G. (2007) “Downlink performance and capacity
of distributed antenna systems in a multicell environment,” IEEE
[5] Hosseini, Hoydis, ten Brink, Debbah, Massive MIMO and small cells: How to densify heterogeneous networks, IEEE International Conference
on Communications (ICC), pp. 5442–5447, 2013.
[6] Richter, Fehske, Fettweis, Energy efficiency aspects of base station deployment strategies for cellular networks, IEEE 70th Vehicular Technology Conference (Fall), pp. 1–5, 2009.
[7] Lee et al., Coordinated multipoint transmission and reception in LTE advanced systems, IEEE Communications Magazine, Vol. 50, no. 11, pp. 44–50, 2012.
[8] R. Bolla, R. Bruschi, F. Davoli, and F. Cucchietti, Energy Efficiency in the FutureInternet: A Survey of Existing Approaches and Trends in Energy-Aware Fixed Network Infrastructures, IEEE Communications Surveys & Tutorials, Vol. 13, no. 2,pp. 223–244, 2011.
[9] K. Son, H. Kim, Y. Yi, and B. Krishnamachari, Base Station Operation and User Association Mechanisms for Energy-Delay Tradeoffs in Green Cellular Networks, IEEE Journal on Selected Areas in Communications, Vol. 29, no. 8, pp. 1525–1536,2011.
[10] C. Peng, S. B. Lee, S. Lu, H. Luo, and H. Li, Traffic-Driven Power Saving in Operational 3G Cellular Networks, ACM International Conference on Mobile Computing and Networking (MobiCom), pp. 121–132, 2011. [11] C. Han et al., Green Radio: Radio Techniques to Enable
Energy-Efficient Wireless Networks, IEEE Communications Magazine, Vol. 49, no. 6, pp. 46–54, 2011.
[12] X. Ge, C. Cao, M. Jo, M. Chen, J. Hu, and I. Humar, Energy Efficiency Modelling and Analyzing Based on Multi-cell and Multi-antenna Cellular Networks, KSII Transactions on Internet and Information Systems, Vol. 4, no. 4, pp. 560–574, 2010.
[13] C. Desset et al.,, Flexible Power Modeling of LTE Base Stations, IEEE Wireless Communications and Networking Conference (WCNC), pp. 2858–2862, 2012.
[14] U. Paul, A. Subramanian, M. Buddhikot, and S. Das, Understanding Traffic Dynamics in Cellular Data Networks, IEEE International Conference on Computer Communications (INFOCOM), pp. 882–890, 2011.
[15] M. Z. Shafiq, L. Ji, A. X. Liu, and J. Wang, Characterizing and Modeling Internet Traffic Dynamics of Cellular Devices, ACM SIGMETRICS, pp. 305–316, 2011.
[16] Marsan, M. A., Chiaraviglio, L., Ciullo, D. and Meo, M., Optimal energy savings in cellular access networks, IEEE International Conference on Communications (ICC)Workshops, pp. 1–5, 2009.
aware UMTS access networks, 11th International Symposium on Wireless PersonalMultimedia Communications (WPMC), pp. 1–5, 2008. [19] Peng, C., Lee, S.-B., Lu, S., Luo, H. and Li, H., Traffic-driven power
saving in operational 3G cellular networks, ACM 17th Annual International Conference on Mobile Computing and Networking (MobiCom), pp. 121–132, 2011.
[20] Gong, J., Zhou, S. and Niu, Z., A dynamic programming approach for base station sleeping in cellular networks, IEICE Transaction on Communications, Vol. E95-B, no. 2, pp. 551–562, 2012.
[21] Deruyck, M., Joseph, W. and Martens, L., Power consumption model for macrocell and microcell base stations, Transactions on Emerging Telecommunication Technologies, Vol. 25, no. 3, pp. 320–333, 2014. [22] M. F. Hossain, Traffic-Driven Energy Efficient Operational
Mechanisms in Cellular Access Networks, PhD Disertation, University of Sidney (Sidney), 2014.
[23] Z. Niu, Y. Wu, J. Gong, and Z. Yang, Cell Zooming for Cost-Efficient Green Cellular Networks, IEEE Communications Magazine, Vol. 48, no. 11, pp. 74–79, 2010.
[24] Harri Holma, Antti Toskala, WCDMA for UMTS Radio Access for Third Generation Mobile Communications, Wiley (England), Ed. 3, pp. 191-193, 2004.
[25] M. Deruyck, W. Joseph, L. Martens, Power Consumption Model for Macrocell and Microcell Base Stations, European Transactions on Telecommunications, Belgium, 2011.
[26] ATM Shaiful A., Scalable Base Station Switching Framework for Green Cellular Networks, PhD Disertation, The Open (Milton Keynes), 2014.
![Figure 1. Normalized traffic diversity of different cells in three weeks [2]](https://thumb-ap.123doks.com/thumbv2/123dok/4040629.1984049/2.595.138.461.395.649/figure-normalized-traffic-diversity-different-cells-weeks.webp)
![Table 2. Parameters used in uplink load factor calculation Definitions Recommended Values [24]](https://thumb-ap.123doks.com/thumbv2/123dok/4040629.1984049/8.595.120.477.98.379/table-parameters-uplink-factor-calculation-definitions-recommended-values.webp)
![Figure 5. Cells with original size [1]](https://thumb-ap.123doks.com/thumbv2/123dok/4040629.1984049/10.595.200.393.242.430/figure-cells-original-size.webp)
![Figure 6. Central cells sleep and neighboring cells zoom out [1]](https://thumb-ap.123doks.com/thumbv2/123dok/4040629.1984049/11.595.180.401.96.279/figure-central-cells-sleep-neighboring-cells-zoom.webp)