Author(s) retain the copyright of this article http://www.modernrespub.org/jsrs/index.htm
Full Length Research Paper
Population structure of the brown planthopper, Nilaparvata
lugens (Homoptera: Delphacidae) based on PCR analysis in
West Sumatra, Indonesia
Enie Tauruslina A
1*, Trizelia
2, Yaherwandi
2and Hasmiandy Hamid
21
Department of Agriculture, Food and Horticulture Plant Protection Office, West Sumatera, Indonesia.
2
Department of Plant Protection, Faculty of Agriculture, University of Andalas, Padang, West Sumatra, Indonesia.
*Corresponding author. E-mail: [email protected]
Accepted 14 March, 2018
This research was conducted to determine the population structure of brown planthopper (Nilaparvata lugens) in the Province of West Sumatra, Indonesia. N. lugens sample location was selected from fourteen districts for determining the sample collection of the population structure. The localities were Tanjung Mutiara, IV Nagari, Lubuk Basung, Kinali, Lengayang, Koto VII, X Koto Singkarak, Rambatan, Sitiung, Koto Baru, Nanggalo, Kuranji, Talawi and Sungai Geringging. Population genetic variability was performed using Polymerase Chain Reaction (PCR) and DNA analysis using SSRNLS24, SSRBM1262 and SSRBPH06 primers. The results of genetic characterization based on PCR revealed a clear population structure. Population structure of N. lugens is diversed based on PCR SSR analysis. Amplification of N. lugens gene shows that sample 1 to 14 of DNA bands was a consistent pattern of DNA bands. The dendrogram population of N. lugens was eight samples, with genetic similarity at > 0.50.
Key words: Rice, marka SSR, phylogenetic, Nilaparvata lugens.
INTRODUCTION
Brown planthopper (Nilaparvata lugens Stal.) was an old village. It was a problem in rice cultivation in Indonesia. The pest was included in the order Homoptera, sub order Auchenorrhyncha, infra order Fulgoromorpha, family Delphacidae, genus Nilaparvata and species Nilaparvata lugens (Baehaki, 2012). The pest was widespread in the Palaeartik region (China, Jepang and Korea), Oriental (Bangladesh, Kamboja, India, Indonesia, Malaysia, Serawak, Taiwan, Muangthai,Vietnam and Filipina) and Australian (Australia, Fiji Islands, Kaledonia, Solomon Islands and New Gunea). Based on the data shown, brown planthopper has become the global pest (Catindig et al., 2009). The pest can fly far from one country to another. The migratory of N. lugens was higher in subtropical areas and temperate regions than tropica regions. The macroptera of N. lugens have a preoviposition period longer and hunger in the temperate and subtropical regions than in the tropical regions. The
duration of preoviposition hunger was thought to be useful for long distance migration before reproduction. These findings support the hypothetical migration system of brown planthopper in East Asia, which have maintained long distance migration capabilities throughout the year (Wada et al., 2007, 2009). In West Sumatra, N. Lugens attacked for 5 years (2013-2017), which was 2,513.10 ha (BPTPH, 2017). Based on the data, population structure research is required. The research of N. lugens population structure in West Sumatra was never done. The research purpose was to know the N. lugens population structure. The research used SSR moleculer markers. SSR moleculer markers include PCR-based marker (Bardakoi, 2001). SSR PCR has to ability to detect high polymorphisms, detect potential geographically separated population variations and individual variations in population (Luque et al., 2002; Vijayan et al., 2006).
M
M
M
Table 1. Study areas.
Study areas (Regency / Districts)
Altitude
(meter upper of the sea) Geographic position
Agam
00°01’34”– 00°28’43” South Latitude 99°46’39” – 100°32’50” East Longitude
00°36’25” – 00°49’13” South Latitude 100°27’05” – 100°38’46” East Longitude Tanah Datar
Rambatan 400 – 1000
00°17” – 00°39” South Latitude 100°19” – 100°51” East Longitude Dharmasraya
Sitiung 115
00°47’07” – 00°41’56” South Latitude 101°09’21” – 101°54’27” East Longitude Dharmasraya
Koto Baru 100 – 1500
00°47’07” – 00°41’56” South Latitude 101°09’21” – 101°54’27” East Longitude Padang City
Nanggalo 0 – > 1000
00°44”00” – 01°08’35” South Latitude 100°05’05” – 100°34’09” East Longitude Padang City
Kuranji 0 – > 1000
00°44”00” – 01°08’35” South Latitude 100°05’05” – 100°34’09” East Longitude
The research was conducted in fourteen districts of West Sumatra. The localities were attacked by N. lugens. It was Tanjung Mutiara, IV Nagari, Lubuk Basung (Agam Regency), Kinali (Pasaman Regency), Lengayang (Pesisir Selatan Regency), Koto VII (SijunjungRegency), X Koto Singkarak (Solok Regency), Rambatan (Tanah Datar Regency), Sitiung, Koto Baru (Dharmasraya Regency), Nanggalo, Kuranji (Padang City), Talawi (Sawahlunto City) and Sungai Geringging (Padang Pariaman Regency). The study areas are shown in Table 1.
Sample collection
The sample collection was imago N. lugens; it was obtained from an attacked location.
Table 2. The type of primers used for detection polymorphism of N. lugens sample.
Primers Temperature Annealing Primer Sekuens 5’ – 3’
SSRNLES24 55°C, 30 seconds
primer forward SSR
(F5 – AGCTCCAATGACAGGTG-3’)
reverse SSR
(R5-CCTTTCTTTCAAACAAGGTT AACAA-3’)
SSRBM1262 55°C, 30 seconds
primer forward SSR
(F5 – AGAATCATTGATGAGTCAAGC-3’)
reverseSSR
(R5-TCACACACA CTCTCTCACAAA-3’)
SSRBPH06 55°C, 30 seconds
primer forward SSR
(F5 – AAAACATTCCACATTAGCCT-3’)
ReverseSSR
(R5-CCTTTTGATTGTATA GGAGC-3’)
Table 3. The reaction composition of PCR
Component Volume
Tag 1 U
dNTPs 0.2 mM
MgCl2 2.5 mM
Primer F+R 0.3 – 0.5 µM
DNA template 10 – 20 ng
PCR buffers 1 x
Total 10 µl
Table 4. The profil of PCR SSR.
Stage Temperature (°C) Duration Cycle
Pre-denaturation 94 5 min
Stages 2 to 4 repeated 40 times
Denaturation 94 30 seconds
Patching 55 30 seconds
Extension 72 60 seconds
Final extension 72 10 min
The tube was shaken for 10 min and incubated at 37°C for 1 h. The concentrate of DNA was measured with spectrophotometer at an absorbance of 260 and 280 nm. DNA was concidered pure if the OD260/OD280 ratio ranged from 1.6–1.9. The DNA extracted was based on Gene JETTM Genomic DNA Purification Kit®Fermentas (Latief et al., 2012).
PCR Amplification of N. lugens DNA
The amplification of DNA from N. lugens DreamTag Master Mix Fermentas was used with SSR primers. The SSR primers shown in Table 2. The choice of primers was based on the optimzation result, a higher polymorphism and a clearly amplified band. The DNA of bands amplification was converted to binary data, based
on score. DNA bands were valued at 1 if the DNA bands were presented, and valued at 0 if the DNA bands were not.
The reaction composition was based on the PCR process referred to with protocol kit PCR ®Fermentas (Jing et al., 2011) and is detailed as shown in Table 3. The profile of PCR SSR is shown in Table 4.
The process of PCR was as follows: pre-denaturation at 94°C for 5 min with 40 cycles (denaturation at 94°C for 30 s; annealing at 55°C for 30 s; extension at 72°C for 60 s and final elongation at 72°C for 10 min). Denaturation, annealing and extention were 40 cycles.
Population structure
λ50 λ100 1 2 3 4 5 6 7 8 9 10 11 12 13 14
Figure 1. Electroferogram of genomic N. lugens DNA used fourteen samples. Holes λ 50, λ100, 1, 2, 3, 4, 5, 6, 7, 8, 9, 10, 11, 12, 13 and 14, respectively are λ50 = 50 ng standard λ, λ100 = 100 ng standard DNA λ, 1 = Tanjung Mutiara, 2 = IV Nagari, 3 = Lubuk Basung, 4 = Kinali, 5 = Lengayang, 6 = Koto VII, 7 = X Koto Singkarak, 8 = Rambatan, 9 = Sitiung, 10 = Koto Baru, 11 = Nanggalo, 12 = Kuranji, 13 = Talawi,14 = Sungai Geringging
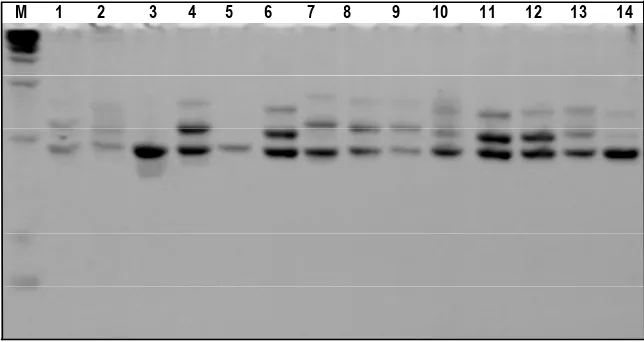
M 1 2 3 4 5 6 7 8 9 10 11 12 13 14
Figure 2. Electroferogram of acrylamide gel 8% used SSRNLES24 primer. Holes M, 1, 2, 3, 4, 5, 6, 7, 8, 9, 10, 11, 12, 13 dan 14, respectively are Marker 100 bp DNA Ladder, 1 = Tanjung Mutiara, 2 = IV Nagari, 3 = Lubuk Basung, 4 = Kinali, 5 = Lengayang, 6 = Koto VII, 7 = X Koto Singkarak, 8 = Rambatan, 9 = Sitiung, 10 = Koto Baru, 11 = Nanggalo, 12 = Kuranji, 13 = Talawi,14 = Sungai Geringging
lugens group. It was based on similarity and dendrogram. The kinship relationship population of N. Lugens was known. The phylogenetic analysis of N. lugens DNA was SSR primers molecular markers. The phylogenetic analysis was done with Clustering UPGMA NTSys 2.1 method (Rohlf, 2000).
RESULTS
DNA Extraction
DNA extraction was DNA electrophoresis. There were
fourteen samples of N. lugens imago. The DNA extracted was an electropherogram as shown in Figure 1.
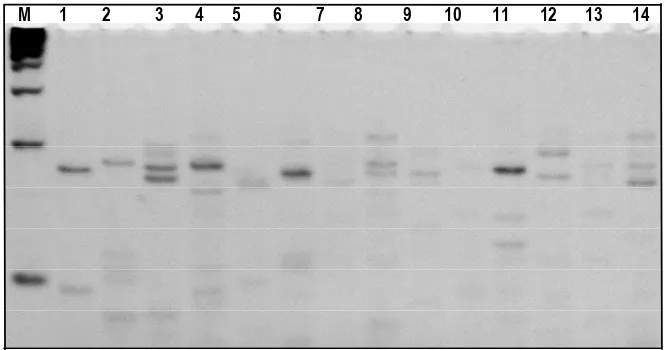
PCR Amplification
PCR amplification was primers of SSRNLES24, SSRBM1262 and SSRBPH06. The PCR amplification was an electropherogram as shown in Figures 2, 3 and 4.
Population structure
M 1 2 3 4 5 6 7 8 9 10 11 12 13 14
Figure 3. Electroferogram of acrylamide gel 8% used SSRBM1262 primer. Holes M, 1, 2, 3, 4, 5, 6, 7, 8, 9, 10, 11, 12, 13 dan 14 respectively are Marker 100 bp DNA Ladder, 1 = Tanjung Mutiara, 2 = IV Nagari, 3 = Lubuk Basung, 4 = Kinali, 5 = Lengayang, 6 = Koto VII, 7 = X Koto Singkarak, 8 = Rambatan, 9 = Sitiung, 10 = Koto Baru, 11 = Nanggalo, 12 = Kuranji, 13 = Talawi,14 = Sungai Geringging
M 1 2 3 4 5 6 7 8 9 10 11 12 13 14
Figure 4. Electroferogram of acrylamide gel 8% used SSRBPH06 primer. Holes M, 1, 2, 3, 4, 5, 6, 7, 8, 9, 10, 11, 12, 13 dan 14 respectively areMarker 100 bp DNA Ladder, 1 = Tanjung Mutiara, 2 = IV Nagari, 3 = Lubuk Basung, 4 = Kinali, 5 = Lengayang, 6 = Koto VII, 7 = X Koto Singkarak, 8 = Rambatan, 9 = Sitiung, 10 = Koto Baru, 11 = Nanggalo, 12 = Kuranji, 13 = Talawi,14 = Sungai Geringging
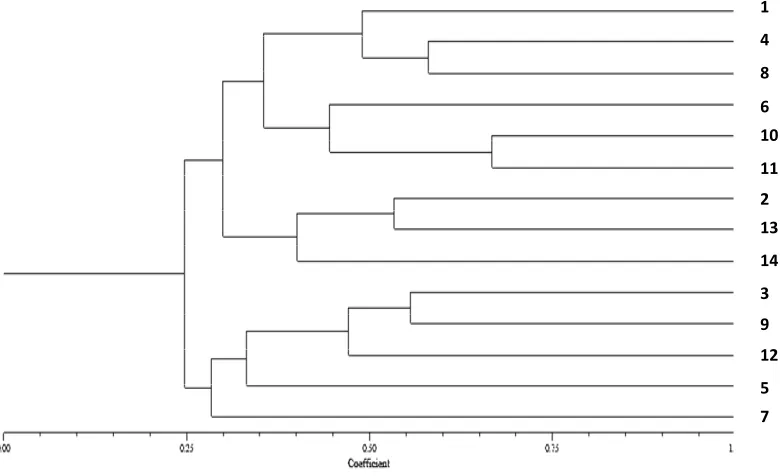
genetic similarity dendrograms was estimated. It was a method of arithmetic averages (UPGMA). The cophenetic correlation was calculated to check the clustering consistency (Manly, 1997). All samples were performed with software NTSYS-pc version 2.1 (Rohlf, 2000). The genetic similarity dendrogram is shown in Figure 5.
DISCUSSION
In Figures 2, 3 and 4, analysis of the PCR amplification showed that fourteen samples of imago N. Lugens and
1 Sumatra Province. 1 = Tanjung Mutiara, 2 = IV Nagari, 3 = Lubuk Basung, 4 = Kinali,5 = Lengayang, 6 = Koto VII, 7 = X Koto Singkarak, 8 = Rambatan, 9 = Sitiung, 10 = Koto Baru, 11 = Nanggalo, 12 = Kuranji, 13 = Talawi,14 = Sungai Geringging
Figure 5 shows that there is a significant kinship relationship with the value of the coefficient of similarity between 0 and 1. The smaller the value of similarity (close to 0), the farther away is the kinship relationship; and the larger the value of similarity (close to 1), the closer the kinship relationship. The based clustering analysis shows that the kinship was very close to similarity value > 0.50, and the kinship was slightly different with similarity value < 0.50 (Harti, 1988; Lynch and Milligan, 1994). The dendrogram shows that in the group based on genetic similarity, there were some populations that showeda population cluster with population of other locations. The clustering population of N. lugens was based on genetic similarity at 50%. The highest genetic similarities were Koto Baru and Nanggalo (0.68), Kinali and Rambatan were 0.63, Lubuk Basung and Sitiung were 0.61, and then IV Nagari and Talawi were 0.59. It was justifying on a high genetic similarity among them. The similarity was lowest (< 0.50) in six samples of N. lugens location. According to Ghislain et al. (2006), SSR markers detect highly repetitive regions in the genome that can be derived from untranslated regions and Lintrons (Ghislain et al., 2006).
Genetic similarity is affected by some factor in population structure, such as insect behaviour, agroecosystem conditions and abiotic factors that affect the distribution of insects (Roderick, 1996; Slatkin, 1994). According to Gullan and Cranston (2000), the clustering patterns formed tend to be based on geographical variation and altitude.
Conclusion
The research was used for phylogenetic analysis of N. lugens DNA based on analysis of SSR primers molecular markers. The primers were gene amplification in forward and reverse capacity. All samples (sample 1 to 14) of DNA bands showed that DNA pattern bands are consistent. The clustering population of N. lugens genetic similarity was eight samples, based on > 50%. The results obtained became the next basic research.
REFERENCES
Agisimanto D, Supriyanto A (2007). Genetic diversity of Pamelo in Indonesia based on random primers of DNA amplified polymorphic. J. Hort. 17(1):17.
Baehaki SE (2012). Development of brown planthopper biotype in rice plants. Plant Food Sci. 7(1):8-17.
Bardakoi F (2001). Random amplified polymorphic DNA (RAPD) markers. Turk. J. Biol. 25:185-196.
BPTPH (2007). Laporan Tahunan. Balai Perlindungan Tanaman Pangan dan Hortikultura, Sumatera Barat. p. 450.
Catindig JLA, Arida GS, Baehaki SE, Bentur JS, Cuong LQ, Norowi M, Rattanakarn W, Sriratanasak W, Xia J, Lu Z (2009). Situation of plant hoppers in Asia. In K..Heong and B Hardy,Proc. Planthopper-new threat to the sustainabilityon intensive rice production system in Asia. International Rice Research Institute, Los Banos,Philippines. p.191-220.
Ghislain M, Andrade D, Rodríguez F, Hijmans RJ, Spooner DM (2006). Genetic analysis of the cultivated potato Solanum tuberosum L. Phureja Group using RAPDs and nuclear SSRs. Theor. Appl. Genet. 113:1515–1527.
Harti DL (1988). Population genetics: A primer. Academic Press, New York.
Jing S, Liu B, Peng L, Peng X, Zhu L, Gu Q, He G (2011). Bulletin of Entomological Research p. 1-10.DOI:1017/S0007485311000435. Latief MA, Rafii MY, Mazid MS, Ali ME, Ahmed F, Omar MY, Tan SG
(2012). Genetic dissection sympatric populations of brown planthopper, Nilaparvata lugens (Stal), using DALP-PCR molecular markers. The Scientific World Journal, Article ID 586831.
Luque C, Legal L, Staudter H, Gers C, Wink M (2002). Brief report: ISSR as genetic markers in Noctuids (Lepidoptera). Hereditas. 136:251-253.
Lynch M, Milligan BG (1994). Analysis of population genetic structure wih RAPD markers. Mol. Ecol. 3:91-99
Manly BFJ (1997). Randomization, bootstrap and Monte Carlomethods in biology. Chapman & Hall, London, p. 281.
Reddy KD, Nagaraju J, Abraham EG (1999). Genetic characterization of the silkworm Bombyx moriby simple sequence repeat (SSR) anchored PCR. Heredity 83:681-687.
Roderick GK (1996). Goegraphic structure on insect population: gene flow, phylogeography, and their uses. Ann. Rev. Ent. 41:325-352.
Rohlf FJ (2000). Program NTSYS-pc:numerical taxonomy and multivariate analysis system: version 2.1. Exeter Software, NewYork, p. 83.
Slatkin M (1994). Gene flow and population structure. In Real. LA (Ed). Ecological genetics. Princeton University Press.Princeton. New York. pp. 3-17.
Vijayan K, Anuradha HJ, Nair CV, Pradeep AR, Awasthi AK, Saratchandra B, Rahman SAS, Singh KC, Chakraborti R, Raje SU (2006). Genetic diversity and differentiation among population of the indian Eri Silkworm, Samia cynthia ricini, revealed by ISSR markers. J. Ins. Sci. 6(30):1-11.
Wada T, Ito K, Takahashi A, Tang J (2007). Variation of pre-ovipositional period in the brown planthopper, Nilaparvata lugens, collected in tropical, subtropica land temperate Asia. J. Appl. Entomol. 131(9-10):698-703.