No. 29 Vol.2 Thn. XV April 2008 ISSN: 0854-8471
Teknik
A
91
THE HEIGHT AND DISTANCE EFFECT TO SURGE
INDUCED VOLTAGE ON A TELECOMMUNICATION
SUBSCRIBER LINES (TSL) DUE TO THE SURGE CURRENT
SOURCE LOCATION: EKSPERIMENTAL APPROACH
Aulia
1, Zulkurnain Malek
2, Zuraimy Adzis
2 1Teknik Elektro, Fakultas Teknik Universitas Andalas, Padang, Indonesia
2Institut Voltan dan Arus Tinggi, Universiti Teknologi Malaysia, Skudai, Johor
Bahru, Malaysia
Abstract
In order to develop a remote lightning mapping system using the existing telecommunication subscriber line (TSL), it is importance to investigate the relation between distances and heights of the TSL on its induced voltages to lightning current sources. This work deals with the experimental thing that mimics the lightning current that strikes a TSL nearby. The experiment shows that the induced voltage is significantly affected by TSL height and distance relative the surge current sources location.
Keywords: induced voltage, remote lightning mapping, telecommunication subscriber line, experimental.
I. Intoduction
A Telecommunication Subscriber Line (TSL) and power distribution line are the two systems that always in danger of lightning strike nearby. Many studies have been done to understand this lightning effect to the system in order to achieve a better design of a lightning protection system. For example, the effect of distances and height of TSL to lightning strike position explained in [1] and [2]. The induction voltage in a complex TSL, a simplified wire model was simulated in [3]. In a different work, lightning surges induced in a telecommunication building observed in [4]. The stroke locations approximately along the line prolongation and their effect to the amplitude and shape of the induced voltages are discussed in [5]. The techniques to calculate the electromagnetic fields from known sources applied to lightning are discussed in [6].The experimental approach to test the theory of lightning induced voltages on an overhead wire was done in [7] and [8].
All of the above studies give the information about parameters of lightning induced voltage on the overhead wire mostly for lightning protection purpose but in this work, the induced voltages are measured in order to predict the lighting current. This is possible by using the concept developed in [9].
This paper will present our experimental work in a TSL reduced scaled model in order to investigate further the relationship between lightning parameters and their induced voltage in a different height and distance. This is a preliminary work to gather some knowledge to develop a local lightning mapping utilizing the existing TSL.
II. Experimental Set up
The high surge current is generated by a high surge current generator that consists of a high voltage DC generator and an impulse circuit that are connected in parallel, see figure 1. The impulse circuit consists of a trigger switch that is connected in parallel with a high voltage capacitor 2x0.3 pF. To enable current flowing through the copper strip measured, a high voltage resistor, 5-10 Ω, is added in series with the capacitor. The height of the copper strip is 2 m. The coaxial cable, RG 59, 50 Ω, is installed to mimic the Telecommunication Subscribers Line (TSL) in a certain distance, d, and height, h. The length of the cable, l, is 4 m. The high current is measured by a Rogowski coil that has a sensitivity of 0.01 v/m. The induced voltage on the cable is measured through a 50 Ω resistor. These signals then be captured and visualized by 3052 series textronic oscilloscope through a 10 m data cable.
No. 29 Vol.2 Thn. XV April 2008 ISSN: 0854-8471
Teknik
A
92
Figure-1 The circuit connection to simulate thelightning induced voltage on a coaxial cable for reduced scale model
The following data were taken during the experiment:
1. The peak of high surge current and voltage 2. The peak induced voltage in the height of 50 cm,
100 cm, and cm
3. The peak induced voltage with a distance of 10 cm, 20 cm, 30 cm, 40, cm, 50 cm and 60 cm in every height from 2.
III.Results and Discussion
The next tables and figures show the result of the experiment. Tabel 1 is the data taken on April 2, 2007. The polarity is negative and the room temperature is 20o C. The room is well covered by Faraday Cage. The cable is tightened to the roof of the cage using an insulated wire in 6 six point.
Tabel-1 Cable induced peak voltage, Vp, in a different distance and height
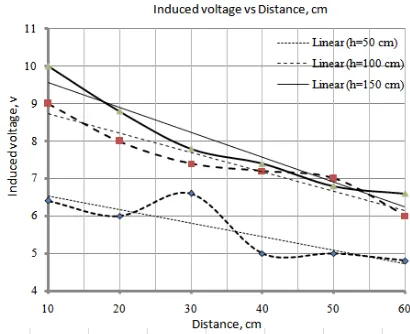
Tabel 1, shows the average peak of induced voltage on the coaxial cable in a differen distances. The voltage varies with distance, d, and height, h. In the distance of 10 cm for example, the induced voltage are 6,4 volt, 8,8 volt and 10 volt for the height of 50 cm, 100 cm and 150 cm from the floor or ground. In the distance of 20 cm, the induced voltage are 6,0 volt, 8,0 volt and 8.8 volt for the height of 50 cm, 100 cm and 150 cm from the floor or ground. The last for distance of 60 cm, the induced voltage becomes smaller then the induced voltage from the shorter distance. The graphical verse is shown in figure 2.
Figure-2 Cable Induced voltage in different distance and height
Tabel 2 shows the induced voltage on the cable at different distances and heights for positive polarity. The data is taken on April 5, 2007. The temperature is about 20o C. The result shows the somewhat similar with negative polarity. The line trend is typical. The highest induced voltage, 7.4 volt, given by the nearest position of cable, 10 cm, to the copper bar that pass the high surge current and at the highest height, 150 cm. The smallest induced voltage, 4.6 volt, given by the most distance, 60 cm, at the height of 50 cm.
Tabel-2 Cable induced peak voltage, Vp, in a different distance and height
No. 29 Vol.2 Thn. XV April 2008 ISSN: 0854-8471
Teknik
A
93
Figure-3 Cable Induced voltages in differentdistance and height for positive polarity
The relation between the induced voltage and the current sources could be seen in table 4 and figure 5. The lowest value of current source, 663 A, gives about 36 volt of induced voltage on the cable. The biggest value of current source, 2483 A, gives about 183 volt of induced voltage. As a whole the relationship between current sources and induced voltages on the cable are also linear as relation between the current sources and the voltage sources.
Tabel-3 Relationship between voltage sources and current sources.
Tabel-3 and figure-4 shows how the current sources varied with the voltage sources. The lowest voltage sources in this experiment are 20 kV and the highest one is 60 kV. The lowest current is 653 A and the heist one is 2483 A in averages. It is clearly seen that in the range of the experiment, the value voltage increase as the current increase. It seems that the relation between values tend to be linear. It is true that some values are not exactly in line but it is still in the range of accepted error, and in average it is linear.
Figure-4 Relationship between voltage sources and current sources. The cable distance is 20 cm from
copper bar.
Tabel-4 Relation between induced voltage and current sources
Figure-5 Relation between induced voltage and current sources. The cable distance is 20 cm from
copper bar.
IV. Conclusion
The data shows that the height and distance of TSL has the significant effect to the surge induced voltage on it. The extreme effect is given by the combination of the highest height and the closest distance to the surge current sources.
Acknowledment
The authors would like to thank Ministry of Science, Technology and Innovation (MOSTI) Malaysia and Research Management Centre (RMC), Universiti Teknologi Malaysia, for the financial and management support provided under VOT 79032 to carry out this research.
Literatures
[1].M.G.Sorwar, 1997, “The Analysis of Induced Surge on Overhead Telecommunication Subscriber Line Due to Lightning Return Stroke”, Master Thesis, UTM, Malaysia
[2].M. G. Sorwar at al, 1999, “Lightning Radiated Electric Fields and Their Contribution to Induced Voltages”, 0-7803-5057/99/IEEE [3].Tetsuya T., at al, 2003, “Characteristics of
Lightning Surges Induced in Telecommunication Center in Tropical Area”,
IEEE TRANSACTIONS ON ELECTROMAGNETIC COMPATIBILITY, VOL. 45, NO. 1, FEBRUARY
No. 29 Vol.2 Thn. XV April 2008 ISSN: 0854-8471
Teknik
A
94
[5].Farhad Rachidi at al, 1997, “ Voltages Inducedon Overhead Lines by Dart Leaders and Subsequent Return Strokes in Natural and Rocket-Triggered Lightning”, IEEE TRANSACTIONS ON ELECTROMAGNETIC COMPATIBILITY, VOL. 39, NO. 2, MAY [6].R.Marcos at al, 1989, “ Methods for Calculating
the Electromagnetic Fields from a Known Source Distribution: Application to Lightning “, IEEE TRANSACTIONS ON
ELECTROMAGNETIC COMPATIBILITY, VOL. 31, NO. 2, MAY
[7].R. Marcos at al., 1989, “An Experimental Test of Theory of Lightning-Induced Voltages on an Overhead Wire”, IEEE TRANSACTIONS ON ELECTROMAGNETIC COMPATIBILITY, VOL. 31, NO. 4, Nov
[8].M. Ishii, K. Michishita, Andy. Hongo, 1999, “Experimental study of lightning induced voltage on an overhead wire over lossy ground,” IEEE Trans.Electromagn. Compat., vol. 41, pp. 39–45, Feb
[9].Agrawal at al, 1980, “Transient Response of Multiconductor Transmission Lines Excited by a Uniform Electromagnetic Field”, vol. EMC-22, pp 119-129, 1980.