166
CONSUMPTION FUNCTION UNDER THE PERMANENT INCOME
HYPOTHESIS IN SELECTED ARAB COUNTRIES
1MILOUD ELWAKSHI, 2ALI AL-QUDAH
1Faculty of Economics, Misurata University, Misurata 2478, Libya;
2Faculty of Finance and Business Administration, Al Al-Bayt University, Al Mafraq, Jordan;
Coorresponding Author: [email protected]
ABSTRACT
This article estimates the consumption function under the permanent income hypothesis. The study is based on annual data covering the period from 1985 to 2010 for selected 10 Arab countries. The models specification implemented refer to the combined partial adjustment and adaptive expectations model, and the adaptive expectations model. The estimation results with respect to the consumption function under the permanent income hypothesis and the combined partial adjustment and adaptive expectations model were rather good only for some countries. Therefore, we demonstrated only the estimation outcomes for the consumption function model under the permanent income hypothesis and the adaptive expectations model. The results show strong support for the hypothesis, supporting thus the consumption function under the permanent income hypothesis and the adaptive expectations model.
Keywords: Consumption Function, Permanent-Income Hypothesis, Arab Countries.
Introduction
According to Milton Friedman’s (1957) permanent income hypothesis (PIH), due to
permanent and transitory fluctuations in income actual consumption expenditureCt is made up of two parts as the following:
(1)
WhereCtpis permanent consumption expenditure andCtTis transitory consumption expenditure. Also, actual income is made up of the following two components:
(2)
WhereYtpis permanent income and is transitory income. Moreover, permanent consumption expenditure is assumed to be determined by permanent income, as the following: (3)
Where
a
andb
are parameters to be estimated. It is instructive to investigate whetherthe elasticity of consumption with respect to permanent income varies among the 10 Arab countries. The aim of this paper is to examine consumption function under the permanent income hypothesis for selected 10 Arab countries by combining the partial adjustment and the
T t p t t C C
C
T t p t t Y Y
Y
P t p
t a bY
167 adaptive expectations model.
Methodology
Since permanent consumption expenditure and permanent income are not directly observable, Katsouli (2006) suggested that model (3) can be estimated by combining the partial adjustment and the adaptive expectations model, in order to transform the unobservable variables into the observable permanent consumption expenditure and permanent income respectively. Thus, the model obtained is as follows (Seddighi et al. 2000):
(4)
, 0 < λ ≤ 1 (5)
, 0 < η ≤ 1 (6)
Where η is the adaptive expectations coefficient and λ is the partial adjustment
parameter. By solving the system of the three models (4), (5) and (6), we obtained the following model (Johnston, 1984):
(7) On the other hand, we obtained the following model by substituting (1) is into (3):
T By Combining (8) and (6) we obtained the following model (Johnston, 1984):
(10) The consumption function under the permanent income hypothesis and the adaptive expectations model which represented in model (10), and the consumption function under the permanent income hypothesis and the combined partial adjustment and adaptive expectations model which represented in model (7), are estimated in the notion that all the variables involved are expressed in actual and not in observable variables.
Data
The data used in the analysis is annual, cover the period from 1985 to 2010. The data on the variables in this study, household final consumption expenditure, and income (GDP), are taken from World Development Indicators, published by United Nations, Department of Economic and Social Affairs, Statistics Division, and refer to the initial 10 Arab countries.
The identification of the variables used is the following:
t
Y = Gross domestic product, as income (USD, constant 2000 prices).
t
C = Private final consumption expenditure (USD, constant 2000 prices)
Results
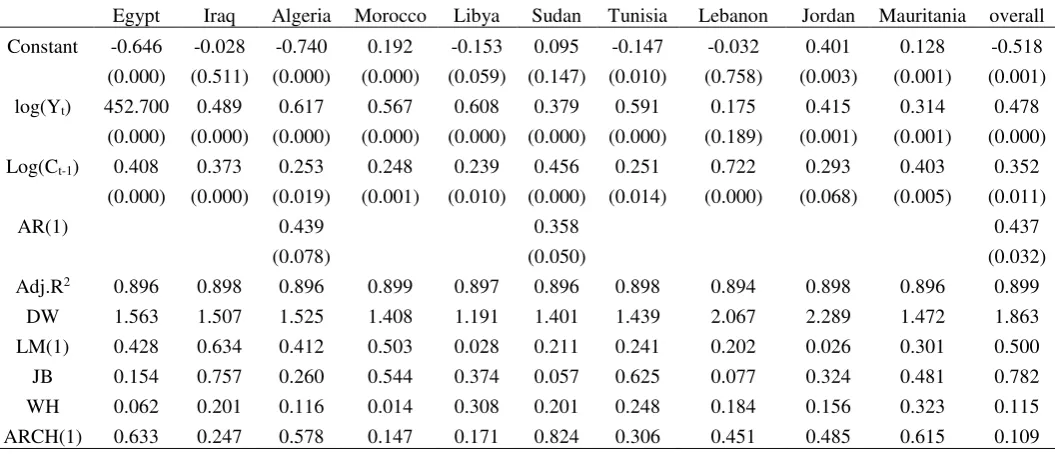
Table 1 demonstrated the results for the consumption model (10), expressed into logs,
168 where:
Adj. R2 = adjusted for degrees of freedom determination coefficient.
DW = Durbin – Watson statistic for autocorrelation.
LM(1) = Lagrange multiplier statistic of order one for autocorrelation. JB = Jarque – Bera statistic for normality.
WH = White heteroskedasticity statistic.
ARCH(1) = Autoregressive conditional heteroskedasticity statistic of order one. Generally we have investigated the consumption function in model (7) and the results were not favorable. In fact, from the statistically the estimation results with respect to model (7) were rather good for Sudan, Mauritania and Algeria, but from the economically the
adjustment coefficients λ and η did not follow the restrictions set in models (5) and (6).
Therefore, we did not to discuss these results and, demonstrated in Table 1 only the estimation outcomes for the case of model (10), or the consumption function model under the permanent income hypothesis and the adaptive expectations model. Based on these results model (10) seems to represent fairly the consumption function under the permanent income hypothesis and the adaptive expectations model in the selected 10 Arab countries.
Table 1: Regression results for Model (10): Dependent variable log(Ct)
Egypt Iraq Algeria Morocco Libya Sudan Tunisia Lebanon Jordan Mauritania overall
Constant -0.646 -0.028 -0.740 0.192 -0.153 0.095 -0.147 -0.032 0.401 0.128 -0.518
(0.000) (0.511) (0.000) (0.000) (0.059) (0.147) (0.010) (0.758) (0.003) (0.001) (0.001)
log(Yt) 452.700 0.489 0.617 0.567 0.608 0.379 0.591 0.175 0.415 0.314 0.478
(0.000) (0.000) (0.000) (0.000) (0.000) (0.000) (0.000) (0.189) (0.001) (0.001) (0.000)
Log(Ct-1) 0.408 0.373 0.253 0.248 0.239 0.456 0.251 0.722 0.293 0.403 0.352
(0.000) (0.000) (0.019) (0.001) (0.010) (0.000) (0.014) (0.000) (0.068) (0.005) (0.011)
AR(1) 0.439 0.358 0.437
(0.078) (0.050) (0.032)
Adj.R2 0.896 0.898 0.896 0.899 0.897 0.896 0.898 0.894 0.898 0.896 0.899
DW 1.563 1.507 1.525 1.408 1.191 1.401 1.439 2.067 2.289 1.472 1.863
LM(1) 0.428 0.634 0.412 0.503 0.028 0.211 0.241 0.202 0.026 0.301 0.500
JB 0.154 0.757 0.260 0.544 0.374 0.057 0.625 0.077 0.324 0.481 0.782
WH 0.062 0.201 0.116 0.014 0.308 0.201 0.248 0.184 0.156 0.323 0.115
ARCH(1) 0.633 0.247 0.578 0.147 0.171 0.824 0.306 0.451 0.485 0.615 0.109
Conclusion
169 given time of period.
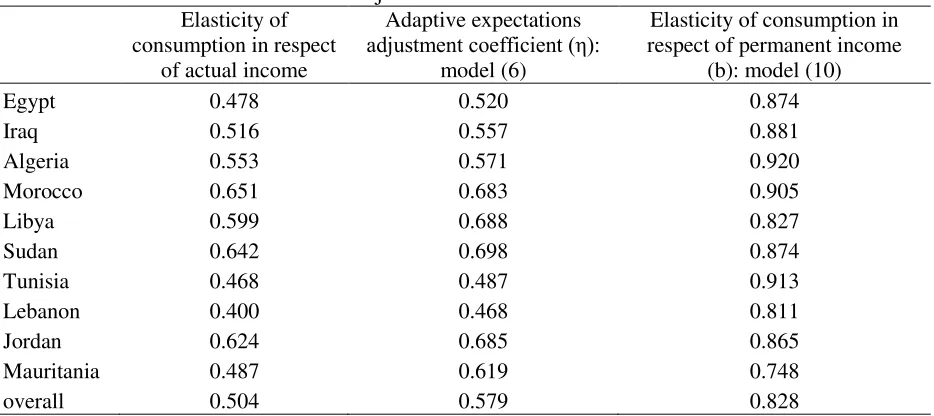
Table 2: Long-run and short-run elasticities of consumption in respect of Income and adjustment coefficients
Elasticity of consumption in respect
of actual income
Adaptive expectations
adjustment coefficient (η):
model (6)
Elasticity of consumption in respect of permanent income
(b): model (10)
Egypt 0.478 0.520 0.874
Iraq 0.516 0.557 0.881
Algeria 0.553 0.571 0.920
Morocco 0.651 0.683 0.905
Libya 0.599 0.688 0.827
Sudan 0.642 0.698 0.874
Tunisia 0.468 0.487 0.913
Lebanon 0.400 0.468 0.811
Jordan 0.624 0.685 0.865
Mauritania 0.487 0.619 0.748
overall 0.504 0.579 0.828
The results indicate to robust support for the permanent income hypothesis (PIH), supporting consequently, the consumption function under the permanent income hypothesis and the adaptive expectations model. However, it is informative to investigate whether the elasticity of consumption with respect to permanent income differs between the 10 Arab countries. In what follows we set the 10 Arab countries according to the adaptive expectations adjustment coefficients, and the elasticity of consumption with respect to the actual and permanent income respectively:
Grouping of 10 Arab countries with respect to elasticity of consumption with respect to actual income:
Low: Lebanon, Tunisia, Egypt
Medium: Mauritania, Iraq, Algeria, Libya High: Jordan, Sudan, Morocco
Grouping of 10 Arab countries with respect to elasticity of consumption with respect to permanent income:
Low: Mauritania, Lebanon, Libya Medium: Jordan, Egypt, Sudan, Iraq High: Morocco, Tunisia, Algeria
Grouping of 10 Arab countries with respect to adaptive expectations adjustment coefficient:
Low: Lebanon, Tunisia, Egypt
Medium: Iraq, Algeria, Mauritania, Morocco High: Jordan, Libya, Sudan
170 suffer of inconsistency.
References
Zar J.H. 1984. Biostatistical analysis, 2nd edition. Prentice Hall, Englewood, USA. Friedman, M. 1957. A theory of the consumption function. Princeton University Press. Johnston, J. 1984. Econometric methods. 3rd ed. New York: McGraw-Hill.
Katsouli, E. 2006. Testing the ‘surprise’ consumption function: A comparative study between
15 European Union member-states. International Research Journal of Finance and Economics, 1:36–41.