ANAEROBIC TREATMENT OF POLYETHYLENE GLYCOL (PEG) -CONTAINING WASTEWATER IN A FIXED-BED REACTOR
Satoto E. Nayono
Department of Civil Engineering, Yogyakarta State University (UNY) Kampus UNY Karangmalang, Yogyakarta 55281
Email: [email protected]
ABSTRACT
This paper presents the suitability of anaerobic treatment of PEG-containing wastewater as a pre-treatment in order to recover the potential energy in the form of biogas. Polyethylene glycols (PEGs) are polymers composed of repeating sub-units of identical structure, called monomers, and are the most commercially important polyethers. PEGs are liquid or low-melting solids, depending on their molecular weights. It is prepared by polymerization of ethylene oxide. PEGs are non-toxic and are widely used in the manufacture of cosmetics, water-soluble lubricants, antifreeze agents for automobile radiators, and pharmaceutical, in the conservation treatment of ancient wood and in the production of non-ionic surfactants. Therefore, millions of tons of PEGs are manufactured or involved in industrial processes worldwide every year. Most of them reach conventional wastewater treatment systems after industrial utilization.
A batch-assay test was performed in order to examine the degradability and the methane production potential of PEG-containing wastewater. A laboratory-scale fixed bed reactor made from glass column was also used in this study in order to determine the maximum loading rate during continuous feeding mode. Mesophilic condition (37 °C) and synthetic wastewaters were applied in both experiments. In the batch-assay tests, most of the organic matters (mainly PEG) were degraded and converted to biogas
after 70 hours of incubation. A methane production potential of approx. 0.36 m3∙kg
-1COD
added or 0.60 m3∙kg-1PEGadded was observed in this batch-assay test. During the
continuous-feeding mode in the fixed-bed reactor, an OLR of 8 kg-COD∙m-3∙d-1 was
considered as the maximum OLR with more than 90% of the COD in the wastewater was eliminated.
Considering the performance of the laboratory-scale reactor (i.e.COD elimination
and biogas production), it can be concluded that anaerobic treatment is a suitable method for the treatment of PEG-containing wastewater.
1. Introduction
Polyethylene glycols (PEGs) with typical molecular formula of HO-CH2-(CH2
-O-CH2-)n-CH2-OH are considered as an important group of non-ionic synthetic
water-soluble polymers of ethylene oxide. PEGs have various molecular weights ranging from
106 to 20,000 g∙mol-1. These compounds are non-toxic compounds and widely used in
industrial processes such as the production of pharmaceuticals, cosmetics, lubricants and antifreeze for automobile radiators, as one component in copper electroplating solution which acts as a brightener and stabilizer to enhance the copper deposition rate
or for direct use such as de-icing agents at airports during winter time (Chang et al.,
2003, Huang et al., 2005 and Nitschke, 1996). Millions of tons of PEGs are involved in
industrial processes worldwide every year which most of them have to be discharged as wastewater after industrial utilization.
Due to its huge production, the fate of PEG-containing wastewater has been a main concern in the last three decades. Basically there are two treatment options to
reduce PEG content in wastewater (Chang et al., 2003). The first option is
physic-chemical removal of PEGs using destructive processes such as ozonation,
ozonation/UV, or H2O2/UV oxidation, and recuperative processes such as adsorption
into activated carbon or montmorillonite clay. The second option is biological processes using aerobic or anaerobic treatment. Several reports on biodegradation of PEGs under aerobic or anaerobic conditions show that the capability of growth of bacterial strains depends on the molecular weight and the structural conformation of PEG molecules.
Whereas short-chain PEGs with molecular weights up to 600 g∙mol-1 are aerobically
degraded, PEGs with molecular weights higher than 1,000 g∙mol-1 are considered
"bioresistant". Complete degradation of PEGs with molecular weights up to 20,000
g∙mol-1 have been reported when these compounds were oxidized by pure and mixed
cultures of aerobic bacteria (Schink and Stieb, 1983, Otal and Lebrato, 2003 ).
Anaerobic reactors for wastewater treatment have been used since more than 2000 years ago in the form of Indian and Chinese animal manure digesters (Veenstra, 2000). However, the anaerobic process had been ignored for relatively long time as an option for wastewater treatment since it was considered to be inefficient and too slow to serve the needs of quickly expanding wastewater volumes especially in industrialized and
dense populated area (Polprasert et al., 2001). Pushed by the world energy crisis,
anaerobic digestion for wastewater treatment has been “rediscovered” in the late of
1960s. Since the work of Young and McCarty (1969, cited in Hickey et al., 1991), the
application of anaerobic process for industrial and municipal wastewater treatment has been considered as a practical and an economical alternative to aerobic wastewater treatment. Although several studies reported that anaerobic degradation of PEG-containing wastewater has limited success (Schink and Stieb, 1983), this method has potential advantages such as potential energy recovery in the form of biogas, low biomass production thus less cost for excess sludge treatment and no requirement of oxygen.
2. Materials and methods 2.1 Wastewater and inoculum
PEG-containing wastewater in this study was artificial wastewater simulating the
real wastewater from a solar-cell factory. The factory produces 70 – 200 m3
PEG-containing wastewater per day with COD content (mainly from PEG) ranging from 2 to
30 g ∙L-1. In this study, the artificial wastewater was made using pure PEG and diluted
with tap water in order to have COD content of approximately 15 g ∙L-1(see Table 1).
[image:3.595.85.512.284.458.2]The anaerobic sludge inoculum was obtained from the effluent of a full-scale anaerobic digestion plant treating industrial wastewater. Before using the anaerobic sludge as inoculum for batch assays and continuous fed reactor, the sludge was acclimatized with PEG for about 2 weeks.
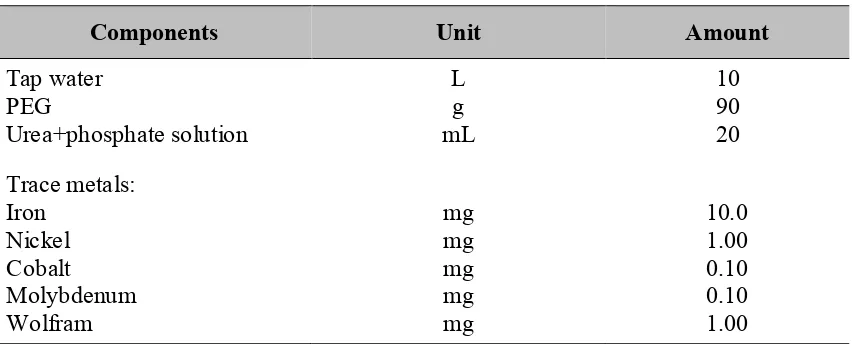
Table 1.Composition of 10 L artificial PEG-containing wastewater
Components Unit Amount
Tap water L 10
PEG g 90
Urea+phosphate solution mL 20
Trace metals:
Iron mg 10.0
Nickel mg 1.00
Cobalt mg 0.10
Molybdenum mg 0.10
Wolfram mg 1.00
2.2 Experimental set-up
Methane production potential of PEG was investigated in triplicate assays in Schott-bottles of one liter volume. The test was performed by adding 0.372 g of PEG to 200 mL of inoculums. Methane production potential from the inoculum alone was also determined as a control assay. The assays were tightly closed with rubber stopper. After
displacing the head space air with N2, the assays were incubated at 37 °C on an orbital
shaker. Cumulative methane production of the assays was measured 2-3 times a day. To assess the suitability of PEG-containing wastewater as a substrate for anaerobic digestion, a laboratory-scale anaerobic fixed bed reactor consisted of a glass column with a liquid working volume of 7.0 L was operated in continuous feeding mode. Supporting material for the growth of biomass made from liaporclay sinterlamellas was arranged inside the reactor. The temperature of the reactor was maintained at 37 °C by a warm water jacket. To obtain an adequate mixing, liquid and/or biogas from the top of the reactor was withdrawn by a pump and recirculated through the bottom of the reactor together with the feeding (see Figure 1).
In order to examine the performance of the reactor, pH-value, chemical oxygen demand (COD) and residual volatile fatty acids (VFA) in the effluent and biogas production were daily measured. COD was determined according to Wolf and
Nordmann (1977) using potassium dichromate (K2Cr2O7) in a mixture of sulphuric acid
3. Results and discussion
3.1 Methane potential production of PEG-containing wastewater
Anaerobic digestion is described as a series of processes involving micro-organisms to break down biodegradable material in the absence of oxygen. The overall result of anaerobic digestion is a nearly complete conversion of the biodegradable organic material into methane, carbon dioxide, hydrogen sulfide, ammonia and new
bacterial biomass (Veeken et al., 2000; Kelleher et al., 2002). Buswell (1952 as cited in
Gallert and Winter, 2005) proposed a generic formula describing the overall chemical reaction of the anaerobic fermentation process of organic compounds which can be used for the prediction of biogas production:
S sH nNH 2s)CH 3n 2o h (4c 8 1 2s)CO 3n 2o h (4c 8 1 O 2s)H 3n 2o -h -(4c 4 1 S N O H C 2 3 4 2 2 s n o h c + + -+ + + + + -® + + +
[image:5.595.128.524.432.698.2]The biogas potential of organic waste including wastewater depends on the content of digestible carbohydrates, lipids and proteins, as well as on the content of more resistant cellulose, hemicellulose and lignin (Hartmann and Ahring, 2006). If a certain type of wastewater has higher readily digestible compounds, the methane production potential is also higher. Glucose for instance, is considered as the most readily degradable carbohydrate. Theoretically, if one mol glucose is completely degraded, the process will yield three moles of methane (1 g glucose yields ca. 0.37 L methane at standard conditions for temperature and pressure, STP)
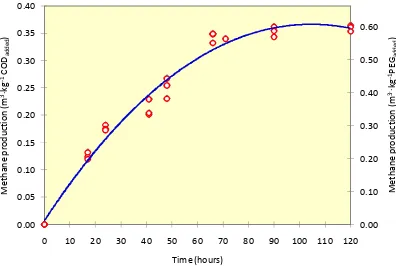
Figure 2. Methane production potential of PEG-containing wastewater. Curves represent methane production from press water only and were obtained by subtracting
methane production in assays with and without press water addition.
0.00 0.10 0.20 0.30 0.40 0.50 0.60 0.00 0.05 0.10 0.15 0.20 0.25 0.30 0.35 0.40
0 10 20 30 40 50 60 70 80 90 100 110 120
M et hane pr oduc tion (m 3
∙∙kg
Figure 2 depicts the biogas production potential with time from the PEG-containing wastewater the batch assays. More than 80 % of the theoretical methane production potential was released during the first 2-3 days. After 4 days of incubation, the methane production ceased and even upon prolonged incubation no biogas was evolved any more. Therefore, it was decided that after 5 days of digestion, the methane production potential of PEG-containing wastewater reached its maximum value. The
maximum methane production potential was approximately 0.36 m3∙kg-1 COD
added
corresponded to 0.60 m3∙kg-1 PEG
added. The maximum methane production rate was
obtained within the first two days with a value of 0.13 m3-CH
4∙kg-1-COD∙d-1. The value
of methane potential production of PEG is close to that of glucose, indicating that PEG-containing wastewater is a readily biodegradable substrate.
3.2 Performance of anaerobic fixed-bed reactor
The laboratory fixed-bed reactor was operated for about four months. The reactor was filled with ca. 5.5 L of inoculums then immediately fed with artificial PEG wastewater. Initially the reactor was fed with an organic loading rate (OLR) of 2.2 kg
COD ∙ m-3 ∙ d-1. The OLR was step-wisely increased in order to investigate the maximum
OLR of the reactor. The increase of the OLR was done by increasing PEG-containing wastewater feeding (shortened the hydraulic retention time, HRT) or increases the COD concentration of the artificial wastewater (the HRT remained the same with higher OLR). Each OLR increment was performed when the reactor was considered at steady-state conditions. The steady-steady-state condition was judged by the COD elimination efficiency, methane content of the biogas, pH of the effluent and concentration of residual VFA in the effluent.
When the OLR was operated at an OLR of 8.2 kg COD ∙ m-3 ∙ d-1 for about two
weeks, the reactor showed a symptom of overload. Although the COD elimination efficiency and the biogas production were not really influenced, pH value of the effluent dropped to below 6.8 (data not showed). The pH value of the digester content is an important indicator of the performance and the stability of an anaerobic digester. Although acceptable enzymatic activity of acid-forming bacteria can occur at pH 5.0, methanogenesis proceeds only at a high rate when the pH is maintained in the neutral range. Most anaerobic bacteria including methane-forming bacteria function in a pH range of 6.5 to 7.5, but optimally at a pH of 6.8 to 7.6, and the rate of methane
production may decrease if the pH is lower than 6.3 or higher than 7.8 (Stronach et al.,
1986; Lay et al., 1998). Therefore, the feeding was stopped for about one weeks in
order to give adaptation time for the reactor to obtain its previous capacity. The similar symptom of failure was also observed when the reactor was operated for two months at
an OLR of 8.0 kg COD ∙ m-3 ∙ d-1. In this case, the feeding was not stopped but reduced
to an OLR of 2.1 kg COD ∙ m-3 ∙ d-1and the reactor was working again.
Biogas and methane production and their relationship with OLR during the reactor experiment are shown in Figure 3. From the figure, it can be seen that the volumetric biogas and methane production of the reactor increased linearly with the increment of the OLR except for the first week when the reactor was fed with an OLR
of 8.2 kg COD ∙ m-3 ∙ d-1. When the reactor was continuously fed with an OLR up to 5.5
kg COD ∙ m-3 ∙ d-1, the methane yield reached an average value of 0.34 m3∙kg-1COD
added
(94% of the maximum potential methane production of PEG, 0.37 m3-CH
4∙kg-1
organisms in sufficient amounts that were required for efficient PEG-containing
wastewater biodegradation. However, when the OLR was increased to 8.2 kg COD ∙ m-3
∙ d-1, the methane yield dropped to only 0.21 m3∙kg-1 COD
added (57% of the maximum
[image:7.595.94.500.187.439.2]methane production potential). This decrease together with the drop of pH value indicated that there was a disturbance in methanogenesis process, most probably due to the low pH value within the reactor.
Figure 3OLR and daily volumetric biogas and methane production
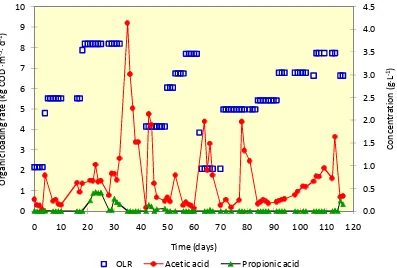
In a well-balanced anaerobic digestion process, almost all products of a metabolic stage are continuously converted into the next breaking down product without any significant accumulation of intermediary products such as different fatty acids. If the production rate of VFA by polymer hydrolysis and acidogenesis exceeds their consumption rate, an increased level of VFA (causing a low pH) may inhibit the whole process. Therefore, the concentration of residual VFA in the effluent is an important parameter to examine the performance of an anaerobic reactor. Figure 4 depicts the concentrations of VFA in the effluent of the reactor against its OLR. Although the analysis of residual VFA was done for four different type of VFA (acetic, propionic, butyric and valeric acids), only acetic and propionic acids were detected in significant amounts.
The initially present acetic acid was rapidly degraded, whereas the propionic acid concentration was not detectable. Acetic acid increased drastically and reached a
maximum concentration of 4.2 g×L-1when the OLR was increased to 8.2 kg COD ∙ m-3 ∙
d-1. In the same time, the concentration of propionic acid increased to about 0.5 g×L-1. As
has been reported by several authors (e.g. Inanc et al. 1999; Gallert et al., 2003 and
Nayono et al., 2009a), the accumulation of fatty acids is normally occurred during
start-up periods or process instability following shock loading. Among VFAs, propionic acid 0
1 2 3 4 5 6 7 8
0 1 2 3 4 5 6 7 8 9 10
0 10 20 30 40 50 60 70 80 90 100 110 120
G
as
pr
oduc
tion
(m
3 ∙m -3·d -1)
Or
gani
c
loadi
ng
rat
e
(k
g
COD·
m
-3∙
d
-1)
Time (days)
plays an important role during both start-up period and process instabilities following shock loading or reparation. As an intermediate product during the breakdown of organic matter to fatty acids, propionic acid is believed to be the most toxic VFA.
McCarty and Brosseau (1963 in Vavilin et al., 2003) reported that methanogenic
bacteria population were inhibited at propionic acid concentration of 1,000 mg×L-1while
[image:8.595.102.499.186.454.2]the population could tolerate acetic and butyric acids up to 10,000 mg×L-1.
Figure 4OLR and residual volatile fatty acids in the effluent
In this study, however, the increase of both acetic and propionic acid caused a decrease of pH value to lower than 6.8. This problem led to a decrease of biogas/methane production and lower COD removal efficiency (see also Figure 5). As have been previously mentioned, the feeding was stopped for about one week to repair the deteriorated performance of the reactor. Within a few days both VFA concentrations decreased to a non-measurable concentration, indicating that the propionate-degraders within the group of acetogenic bacteria and acetate-degraders methanogenic bacteria had adapted their activity to the new situation. However, when the feeding was
introduced again (with lower OLR), acetic acid concentration increased to 2.0 g×L-1but
then decreased to lower than 0.5 g×L-1. Butyric and valeric acid was not measurable at
any time. It is either not produced as an intermediate product or its acetogenic conversion to acetate and hydrogen proceeds much faster at any time than its generation
(Gallert and Winter, 2005; Nayono et al., 2009b; Palmisano and Barlaz, 1996).
The efficiency of the reactor to reduce organic compounds was measured daily by determining the elimination of total COD. Many governments impose strict regulations regarding the maximum chemical oxygen demand allowed in wastewater before they can be returned to the environment. In European countries for example, a maximum oxygen demand between 200 and 1000 mg/L must be reached before wastewater or
0.0 0.5 1.0 1.5 2.0 2.5 3.0 3.5 4.0 4.5
0 1 2 3 4 5 6 7 8 9 10
0 10 20 30 40 50 60 70 80 90 100 110 120
Co
nc
ent
rat
ion
(g
·L
-1)
Or
gani
c
loadi
ng
rat
e
(k
g
COD
·m
-3· d -1)
Time (days)
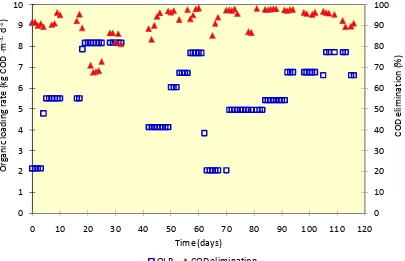
industrial water can be returned to the environment. Therefore, a good performance of a reactor to reduce COD as representation of organic compounds is expected. Figure 5 presents the daily COD elimination efficiency at different OLR levels. From the figure, it can be concluded that during the steady-state condition, anaerobic fixed-bed reactor reached a relatively high COD elimination efficiency. When the reactor was operated at
OLR ranging from 2.1 to 6.7 kg COD ∙ m-3 ∙ d-1the elimination efficiency reached up to
95%. However, when the OLR was increased to more than 8.0 kg COD ∙ m-3 ∙ d-1, the
[image:9.595.97.502.214.475.2]efficiency decreased to below 70%.
Figure 5OLR and COD elimination efficiency
Several studies of anaerobic treatment of wastewater using anaerobic fixed-bed reactor also reported satisfactory results in term of COD elimination efficiency. Anaerobic digestion of silage effluent using anaerobic fixed-bed reactor, for instance, achieved a good result with a average percentage decrease in pollution potential
obtained was 75.7% with respect to COD (Barry and Colleran, 1982). Alves et al.
(2001) reported that more than 90% of COD was removed from a synthetic wastewater
containing 12 g COD∙L-1 of sodium oleate as a sole carbon source. Another study
reported that a combined up-flow anaerobic fixed-bed, using pumice as a biofilter material and a suspended aerobic activated sludge bioreactor equipped with a microfiltration unit exhibited high performance on the COD removal efficiencies
ranging from 94 to 98.7% (Kocadagistan et al., 2005). Handajani (2004) concluded that
anaerobic fixed bed reactor is superior compared to completely stirred tank reactor (CSTR) and upflow anaerobic sludge blanket (UASB) in treating wastewater with high soluble organic matter and less settleable solids. The author also reported that about 85% COD of whey-containing wastewater from dairy industry can be removed using upflow anaerobic fixed bed reactor.
0 10 20 30 40 50 60 70 80 90 100
0 1 2 3 4 5 6 7 8 9 10
0 10 20 30 40 50 60 70 80 90 100 110 120
COD
eli
m
inat
ion
(%
)
Or
gani
c
loadi
ng
rat
e
(k
g
COD
·m
-3∙
d
-1)
Time (days)
4. Conclusions
From the results of the experiment, it can be concluded that anaerobic treatment using fixed-bed reactor is a suitable method to reduce pollutant content of PEG-containing wastewater. The COD elimination efficiency reached up to 95% when the
reactor was operated at an OLR up to 6.7 kg COD ∙ m-3 ∙ d-1. Moreover, the application
of anaerobic treatment offers an advantage of energy recovery in the form of biogas. The methane yield of the continuously-fed reactor reached an average value of 0.34
m3∙kg-1 COD
added or corresponded to 94% of the maximum potential methane
production of PEG.
However, three attempts to increase the OLR over kg COD ∙ m-3 ∙ d-1resulted a
poor performance of the reactor and even indicated a failure. The symptom of failure was indicated by the decrease of biogas production, high concentration of residual VFA in the effluent, low COD elimination efficiency and low pH value. This poor performance is probably resulted from “over capacity” of the fixed-bed media especially acetate-degrader methanogens (indicated by high residual acetic acid concentration in the effluent). One suggestion to solve the problem will be addition of fixed-bed media to increase the surface area in order to increase the “capacity” of the
reactor. Miyahara et al. (1995) confirmed that the number of methanogenic bacteria
closely packed anaerobic fixed bed reactor was higher than that of sparsely packed reactor.
Another possibility is to provide a pH-control mechanism within the reactor system. If the pH value of the reactor decrease to below optimum range, it can be adjusted thus the performance of the reactor can be maintained. Alkalinity and pH in anaerobic digestion can be adjusted using several chemicals such as sodium (bi-) carbonate, potassium (bi-) carbonate, calcium carbonate (lime), calcium hydroxide (quick lime) and sodium nitrate. Addition of any selected chemical for pH adjustment should be done slowly to prevent any adverse impact on the bacteria. Because methanogenic bacteria require bicarbonate alkalinity, chemicals that directly release
bicarbonate alkalinity are preferred (e.g.sodium bicarbonate and potassium bicarbonate
are more preferred due to their desirable solubility, handling, and minimal adverse impacts). Lime may be used to increase digester pH to 6.4, and then either bicarbonate or carbonate salts (sodium or potassium) should be used to increase the pH to the optimum range (Gerardi, 2003).
References
Alves, M. M., Mota Vieira, J. A., Âlvares Pereira, R. M., Pereira, M. A. and Mota, M., 2001. Effect of Lipids and Oleic Acid on Biomass Development in Anaerobic
Fixed-Bed Reactors. Part I: Biofilm Growth and Activity. Water Research 35(1):
255-263.
Barry, M. and Colleran, E., 1982. Anaerobic Digestion of Silage Effluent Using an
Upflow Fixed Bed Reactor. Agricultural Waste 4: 231 239.
Chang, C.Y., Tsai, W.T., Ing, C.H. and Chang, C.F., 2003. Adsorption of Polyethylene
Glycol (PEG) from Aqueous Solution onto Hydrophobic Zeolite. Journal of
Gallert, C. and Winter, J., 1997. Mesophilic and Thermophilic Anaerobic Digestion of Source-sorted Organic Wastes: Effect of Ammonia on Glucose Degradation and
Methane Production. Applied Microbiology Biotechnology 48: 405-410.
Gallert, C. and Winter, J., 2005. Bacterial Metabolism in Wastewater Treatment
Systems (in: Environmental Biotechnology: Concepts and Applications. Editors: Jördening, H-J. and Winter, J.). Weinheim: Wiley-VCH.
Gallert, C., Henning, A. and Winter, J., 2003. Scale-up Anaerobic Digestion of the
Biowaste Fraction from Domestic Wastes. Water Research 37: 1433-1441.
Gerardi, M.H., 2003. The Microbiology of Anaerobic Digesters. Hoboken, NJ: John
Wiley & sons, Inc.
Handajani, M., 2004. Degradation of Whey in an Anaerobic Fixed Bed Reactor. IBA,
Uni-Karlsruhe: PhD Dissertation.
Hartmann, H. and B. K. Ahring, 2006. Strategis for the Anaerobic Digestion of the
Organic Fraction of Municipal Solid Waste: an Overview. Water Science and
TechnologyVol 53 No 8: 7-22
Hickey RF, Wu WM, Veiga MC and Jones R, 1991. Start-up, Operation, Monitoring
and Control of High-rate Anaerobic Treatment Systems. Water Science and
Technology 24 (8): 207-255.
Huang, Y.L., Li, Q.B., Deng, X., Lu, Y.H., Liao, X.K., Hong, M.Y. and Yan Wang, Y., 2005. Aerobic and Anaerobic Biodegradation of Polyethylene Glycols using
Sludge Microbes.Process Biochemistry 40 (1): 207-211.
Inanc, B., Matsui, S. and Ide, S., 1999. Propionic Acid Accumulation in Anaerobic Digestion of Carbohydrates: an Investigation on the Role of Hydrogen Gas. Water Science and Technology 40 (1): 93 -100.
Kelleher, B.P., Leahy, J.J., Menihan, A.M., O’Dwyer, T.F., Sutton, D. and Leahy, M.J.,
Advances in Poultry Litter Disposal Technology – a Review. Bioresource
Technology 83 (1): 27 - 36.
Kocadagistan, B., Kocadagistan, E., Topcu, N. and Demircioglu, N., 2005. Wastewater Treatment with Combined Upflow Anaerobic Fixed-Bed and Suspended
Aerobic Reactor Equipped With a Membrane Unit. Process Biochemistry 40:
177–182.
Lay, J-J., Li, Y-Y., and Noike, T., 1998. The Influence of pH and Ammonia Concentration on the Methane Production in High-solids Digestion Processes. Water Environment Research 70 (5):1075-1082.
Miyahara, T., Takano, M. and Noike, T., 1995. Role of Anaerobic Filter Media in an
Anaerobic Fixed-Bed Reactor. Water Science and Technology 31 (9): 137-144.
Nayono, S.E., Gallert, C. and Winter, J., 2009a. Foodwaste as a Co-Substrate in a
Fed-Batch Anaerobic Biowaste Digester for Constant Biogas Supply.Water Science
and Technology 59 (6):1169–1178.
Nayono, S.E., Winter, J. and Gallert, C., 2009b. Anaerobic Digestion of Pressed Off
Leachate from the Organic Fraction of Municipal Solid Waste. Waste
Nitschke, L., Wagner, H., Metzner, G., Wilk, A. and Huber, L, 1996. Biological
Treatment of Wastewater Containing Glycols from De-icing Agents. Water
Research 30(3): 644-648.
Otal, E. and Lebrato, J., 2003. Anaerobic Degradation of Polyethylene Glycol Mixtures. Journal of Chem. Technol. Biotechnol 78:1075–1081
Palmisano, A.C. and Barlaz, M.A., 1996. Microbiology of Solid Waste. Boca Raton,
Florida: CRC Press Inc.
Polprasert, C., Van der Steen, N.P., Veenstra, S., and Gijzen, H.J., 2001. Wastewater
Treatment II: Natural System for Wastewater Management.Delft: International Institute for Infrastructure, Hydraulics and Environmental Engineering (IHE Delft).
Schink, B. and Stieb, M., 1983. Fermentative Degradation of Polyethylene Glycol by a
Strictly Anaerobic, Gram-negative, Non-sporeforming Bacterium, Pelobacter
venetianussp. nov. Applied and Environmental Microbiology 45 (6): 1905-1913.
Stronach, S.M., Rudd, T., and Lester, J.N., 1986. Anaerobic Digestion Processes in
Industrial Wastewater Treatment. Berlin: Springer-Verlag.
Vavilin, V.A, S.V Rytov, S.G. Pavlostathis, J. Jokela and J. Rintala, 2003. A Distributed
Model of Solid Waste Anaerobic Digestion: Sensitivity Analysis. Water Science
and Technology 48 (4): 147-154.
Veeken, A., Kalyuzhnyi, S., Scharff,H., and Hamelers, B., 2000. Effect of pH and VFA
on Hydrolysis of Organic Solid Waste. Journal of Environmental Engineering
126 (12):1076 – 1081.
Veenstra, S., 2000. Wastewater Treatment I. Delft: International Institute for
Infrastructure, Hydraulics and Environmental Engineering (IHE Delft).
Wolf, P. and Nordmann, W., 1977. Eine Feldmethode für die Messung des CSB von
Abwasser. (A Field Methode for COD Analysis in Wastewater). Korespondenz