Company Note
Adi Sarana
Back in the fast lane
After struggling with high interest rates and poor used car prices that resulted in
■
weak earnings during FY14-15, ASSA is set to make a comeback.
Underpenetrated corporate rental industry, economic growth recovery and lower
■
interest rates should all provide growth opportunities for its rental business. Base effect, higher prices of new cars as well as further expansion of its ancillary
■
businesses should drive earnings recovery ahead of its topline growth.
We believe the stock is undervalued at 0.8x FY18 P/BV. Our TP reflects both its
■
undervaluation and growth potential in a recovering growth environment.
Growth opportunities from underpenetrated industry
ASSA is the second-largest car rental company by fleet size in Indonesia, behind Astra-owned TRAC. Its business model of tapping into corporate auto rentals remains appealing given that the corporate rental industry is still in its infancy stage. It provides intangible benefits and better cash flow management, which remain its main attraction points for corporates. The emergence of apps-based car rentals such as Grab Car and Uber could also provide additional growth avenues.
Strong rental business execution despite economic woes
Despite the economic slowdown, ASSA’s revenue growth has remained resilient over the past four years (+25% CAGR). Cars under management also recorded a CAGR of 17% during the period, which is among the fastest growth in the industry, reflecting the
robust auto rental market and ASSA’s management strength. However, higher funding
costs, losses from mining vehicles and a slow car market took their toll on ASSA, as FY15 earnings came in at a third of FY13’s peak.
The path to earnings recovery
Three consecutive quarters of robust earnings recovery resulted in a 9M16 core net profit of Rp39bn. Core profit margin rose 135bp qoq to 4% in 3Q16, still below FY13’s 9% peak. Resilient used car prices and lower ex-mining vehicle stock suggest that earnings could rise further in 4Q16 and beyond. Faster economic growth, lower interest rates and higher new car prices are catalysts. We project an earnings CAGR of 49% in the next three years, assuming annual GDP growth hits 6% in three years’ time vs. 5% currently.
Ancillary businesses complete the rental value chain
While rental business remains its main growth driver, ASSA has also developed its supporting businesses over the years. Its logistics division is a complementary service for some customers; it includes a fleet of 1,023 trucks and contributed Rp204bn (or 17%) revenue in 9M16. Meanwhile, its auction business, though small (contributing a mere 1.1% of 9M16 revenue), is strategic in: 1) building a strong brand presence in a largely untapped market; and 2) handling sales of its growing fleet of used cars.
An undervalued stock
At 0.8x FY17 P/BV and given the improving visibility of a recovery scenario, we believe ASSA is grossly undervalued. Our GGM-based TP (ROE 16%, LTG 0% and COE 14%) implies 15x FY17 P/E and 1.1x FY17 P/BV. Re-rating catalysts include faster-than-expected adjustment in borrowing rates and ROE adjustment. Downside risks could come from lower-than-expected used car sales margins. Maintain Add
▎Indonesia
Operating EBITDA (Rpb) 480.4 561.5 638.8 722.4 874.2
Net Profit (Rpb) 43.0 34.2 55.2 74.5 110.7
Core EPS (Rp) 12.65 10.07 16.26 21.92 32.58
Core EPS Growth (53.3%) (20.4%) 61.5% 34.8% 48.6%
FD Core P/E (x) 17.56 22.05 13.65 10.13 6.81
DPS (Rp) 9.00 5.00 3.36 5.42 7.32
% Change In Core EPS Estimates 0% 0% 0%
Back in the fast lane
INVESTMENT THESIS
One of the strong executors in an underpenetrated industry
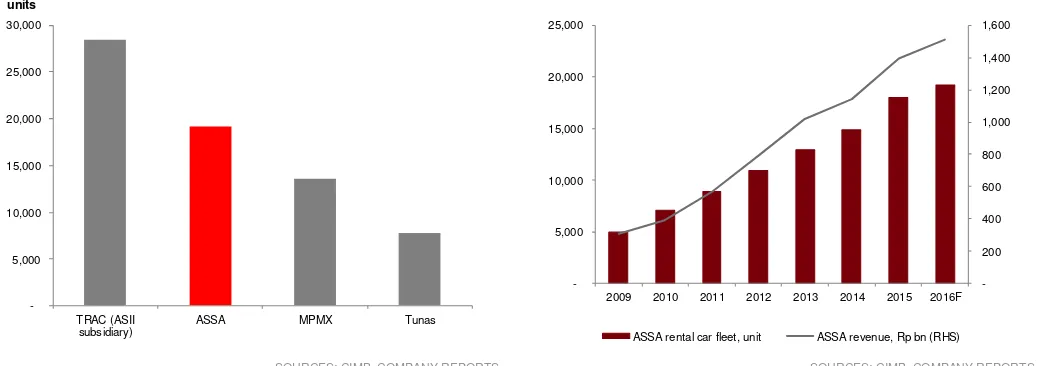
ASSA is the second-largest car rental company in Indonesia, commanding 19,199 units of rental fleet, focusing almost exclusively on corporate rentals. The company serves mainly corporate clients, spread out throughout its network of 44 cities. The company currently caters for c.1,100 corporate clients, which include big corporations i.e. HM Sampoerna, BCA, Unilever, Telkom, XL Axiata, Alfamart, Adira, Danamon, Semen Indonesia, BII Maybank, Bank Central Asia, Bank Negara Indonesia and Bentoel International Investama.
Figure 1: ASSA’s rental fleet breakdown by vehicle type – dominated by passenger cars
Figure 2: ASSA’s rental fleet breakdown by year of purchase – average age of 3 years
SOURCES: CIMB, COMPANY REPORTS SOURCES: CIMB, COMPANY REPORTS
ASSA’s car rental fleet has grown by 18% p.a. since 2010, faster than the market leader TRAC (Astra’s car rental arm). This, in turn, supported its revenue growth of 29% p.a. during FY10-15.
Figure 3: ASSA – second-largest car rental company by fleet size, based on latest company reports
Figure 4: ASSA’s car rental fleet growth, which along with the company's ancillary businesses (i.e. logistics, car auction) supported its strong revenue growth of 29% p.a. in FY10-15
SOURCES: CIMB, COMPANY REPORTS SOURCES: CIMB, COMPANY REPORTS
4x4
2009 2010 2011 2012 2013 2014 2015 2016F
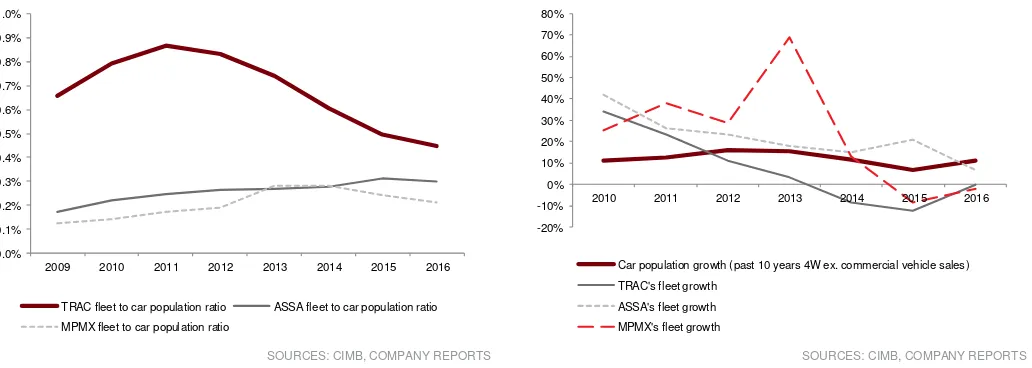
The relatively under-penetrated corporate car rental industry, the company’s industry-leading service quality as well as growth from its ancillary businesses (i.e. car auctions and logistics services) have perhaps enabled such rapid growth in revenue. In fact, we estimate that the fleet size of the top three rental companies only formed 1.0% of the total cars on the road as at end-2016, highlighting the low penetration of corporate car rentals in Indonesia. It is noteworthy that ASSA is the only rental company among the top three that has managed to grow its fleet in the past three years; the other players’ rental fleets have either stagnated or declined during the period.
Figure 5: Low penetration of corporate fleet rental (we use past 10 years of car sales as a proxy to car population)
Figure 6: Top 3 players’ corporate car rental fleet growth vs. car population growth - only ASSA has consistently increased its fleet in the past 3 years
SOURCES: CIMB, COMPANY REPORTS SOURCES: CIMB, COMPANY REPORTS
Given the lack of publicly available data, we use our channel checks with car dealers to estimate the corporate car penetration in Indonesia. Our checks suggest that around 15% of the dealer sales go to corporate buyers, a number that has declined from an estimated 30% of sales compared to four years ago.
Figure 7: Rental fleet penetration to corporate vehicles population - Indonesia compares with Brazil, and is still below European countries
SOURCES: CIMB, LOCALIZA
The figures are comparable with Brazil, with the estimated corporate rental penetration at 11% of total corporate fleet. However, Indonesia’s auto market is much behind Brazil’s market given that the latter’s car per capita ratio is almost 4x that of Indonesia. It also lags behind European companies which have a typical corporate rental penetration of 9-58%. Overall, this highlights the large potential that the corporate rental market offers, in our view.
0.0%
2009 2010 2011 2012 2013 2014 2015 2016
TRAC fleet to car population ratio ASSA fleet to car population ratio MPMX fleet to car population ratio
Along with the corporate market, another potential growth driver could come from the emergence of apps-based transportation providers such as Go-Car, Grab Car and Uber, which could provide new growth avenues. ASSA has held talks with these players, though its exposure remains low at an estimated <1% of its fleet currently.
Strong backing from Triputra Group
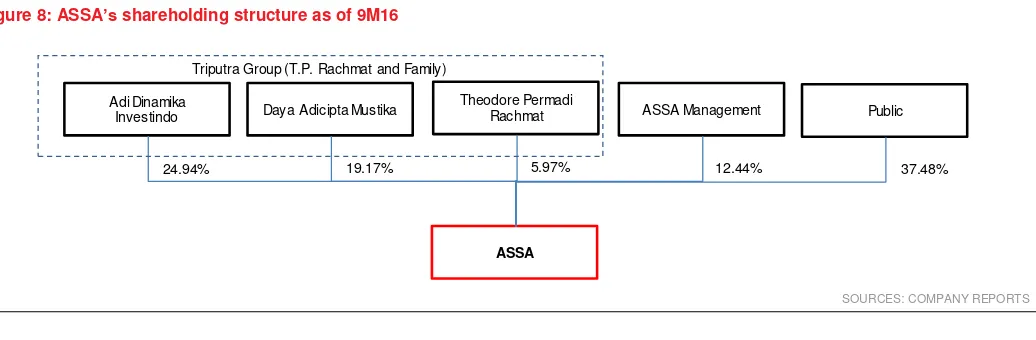
ASSA is backed and owned by the Triputra Group, a prominent Indonesian business group with interests in mining, trade, agribusiness and manufacturing. The group is led by T.P. Rachmat, who worked at the Astra Group for over 30 years, including 16 years as the CEO and six years as the Commissioner of Astra International.
Figure 8: ASSA’s shareholding structure as of 9M16
SOURCES: COMPANY REPORTS
Figure 9: Triputra Group is the 20th largest Indonesian business group with a turnover of US$1.9bn in 2016, according to Globe Asia
SOURCES: COMPANY REPORTS
Earnings to make a U
-
turn
From ASSA’s point of view, the key to profitability in its rental business is to gain a spread between the rental income and the two major operating costs: financing costs and real depreciation costs (how much the car will be worth in four years). The keys to profitability thus are a) rental pricing, b) borrowing costs and c) used car prices.
Adi Dinamika
Investindo Daya Adicipta Mustika
Theodore Permadi
Rachmat ASSA Management Public
ASSA
24.94% 19.17% 5.97% 12.44% 37.48%
Out of the three factors, ASSA generally has good control over its pricing due to its service quality, though we note that pricing (in terms of rental yield) has declined (i.e. our recent checks suggest that rental yield stood at 2.75% per month vs. c.2.9% implied back in 2013) in the past 3 years due to a more competitive environment. However, as ASSA is the only rental company among the top three that has managed to grow its rental fleet in the past three years (as discussed in the previous section), we believe it should cement ASSA’s strong hold in Indonesia’s corporate car rental industry and thus lead to better pricing power.
Figure 10: Cash flow simulation of a rental cycle for Toyota Avanza. Generates an IRR of 14% (assuming 100% equity financing) - higher if using leverage
SOURCES: CIMB, COMPANY REPORTS
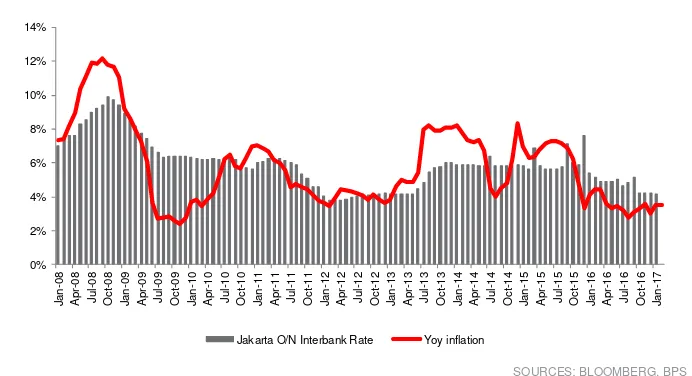
The other two factors, unfortunately, were the main drag on ASSA’s core earnings during FY14-15, as the company was hit by the double whammy of a) higher interest costs as the BI raised its key rate by 175bp in 2013, while at the same time ASSA was unable to pass through such increases due to the competitive environment, and b) a decline in used car sales margin due to a weak auto market and a drag from the disposal of 4x4 ex-mining vehicles.
The interest rate environment, fortunately has reversed as the BI cut its benchmark rate by 150bp throughout 2016. Though BI’s ability to provide easing through rate cuts appears to be limited given the external volatilities, banks’ lending rate adjustments lagged the cut in benchmark rates by 71bp as of Nov 2016. Our latest checks suggest that the current cost of debt stands at 9.2% p.a. (vs. implied cost of 10.4% p.a. in 2015), while the company reportedly managed to secure new loans at a rate of 8.5% p.a. earlier in the year. The full impact of the lower cost of debt should be fully reflected in 2017, in our view.
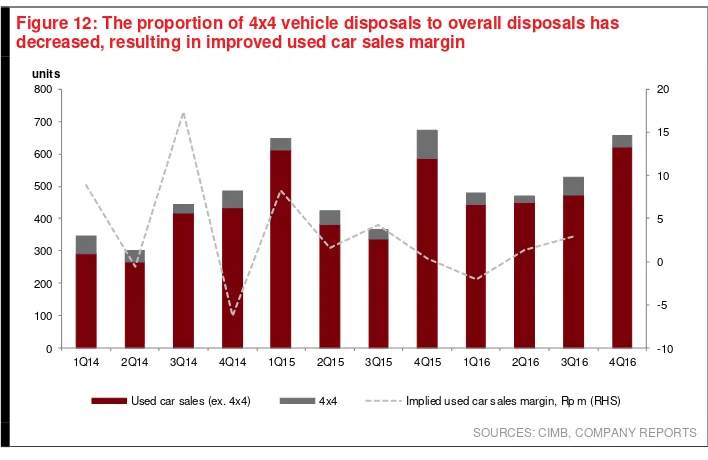
The silver lining on used car sales is that the 4x4 disposals (for which ASSA booked losses of up to Rp110m/unit in throughout 9M16) appear to be at the tail end, with the company having disposed 150 units throughout 2016 and guided for 90 disposals throughout 2017 (out of a total 3,000 vehicles planned to be disposed). With fewer 4x4 disposals planned and price increases due to last year’s commodity price improvements (which resulted in more demand for 4x4 vehicles), the drag on used car sales margins from 4x4 vehicles disposal may be lower than expected.
Figure 12: The proportion of 4x4 vehicle disposals to overall disposals has decreased, resulting in improved used car sales margin
SOURCES: CIMB, COMPANY REPORTS
As such, we project an earnings CAGR of 49% over FY15-18F, a reversal from a decline of 39% p.a. over FY13-15. Our main assumptions are a) the continued expansion of its rental fleet to 27,000 units (+11% 4-year CAGR) by 2019, b) a decline in the cost of borrowing by roughly 20bp in FY16 and 55bp in FY17, and c) a gradual recovery in used car sales margins.
The main assumption is that the economic growth will take a stronger footing; we assume that annual GDP growth will to accelerate to 6% in three years’ time from 5% currently.
Figure 13: Our rental fleet assumptions – 27,000 units by 2019 Figure 14: Our assumptions on used car sales volume and margins – expecting a gradual improvement in margins
SOURCES: CIMB, COMPANY REPORTS SOURCES: CIMB, COMPANY REPORTS
We project that gross leverage would increase to 2.4x by 2017 from 2.1x in 2015, while at the same time ROAE will recover to 8%. This still leaves room to expand the gearing to up to 4x, which is the management’s long-term target
1Q14 2Q14 3Q14 4Q14 1Q15 2Q15 3Q15 4Q15 1Q16 2Q16 3Q16 4Q16
Used car sales (ex. 4x4) 4x4 Implied used car sales margin, Rp m (RHS)
units
Number of fleet, units Utilisation ratio, % (RHS)
0
gearing. The ROAE should hit c.16% in the long-term, provided that the company maxes out its leverage to 4x, in our estimation.
Figure 15: ROE is projected to recover following lower borrowing costs, recovery in used car prices and the company leveraging up
SOURCES: CIMB
An undervalued and ignored stock
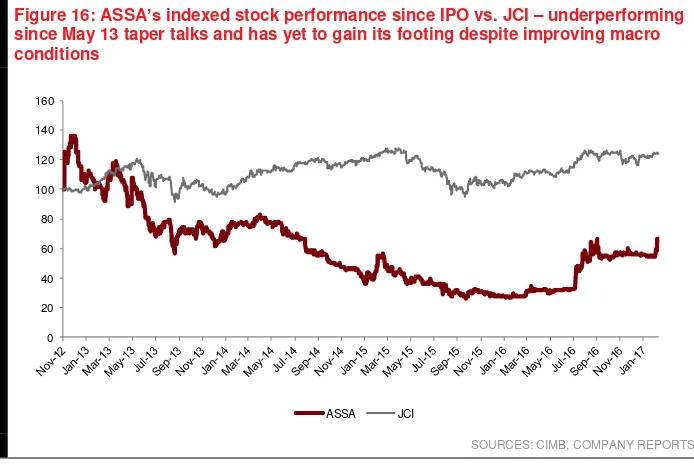
The company listed its stock in Nov 2012, and though the stock enjoyed a momentary price boost given its strong FY12 results in Mar 13, it quickly went down when the May 2013 taper talks hit the market. Throughout 2013, the benchmark interest rate was increased by 175bp, and while the company reported its all-time high core income of Rp92bn in 2013, the higher interest rates quickly ate into its margins the year after. If this was not enough, the rental yield came under pressure as competition intensified and used car margins declined due to the disposal of ex-mining 4x4 vehicles as well as a generally slow auto market. Core earnings halved yoy to Rp42bn in FY14 and further bottomed to Rp33.6bn by FY15. Along with the earnings decline, its stock price plummeted, hitting its all-time low of Rp92 (76% below IPO price) in Sep 2015.
Figure 16: ASSA’s indexed stock performance since IPO vs. JCI – underperforming since May 13 taper talks and has yet to gain its footing despite improving macro conditions
SOURCES: CIMB, COMPANY REPORTS
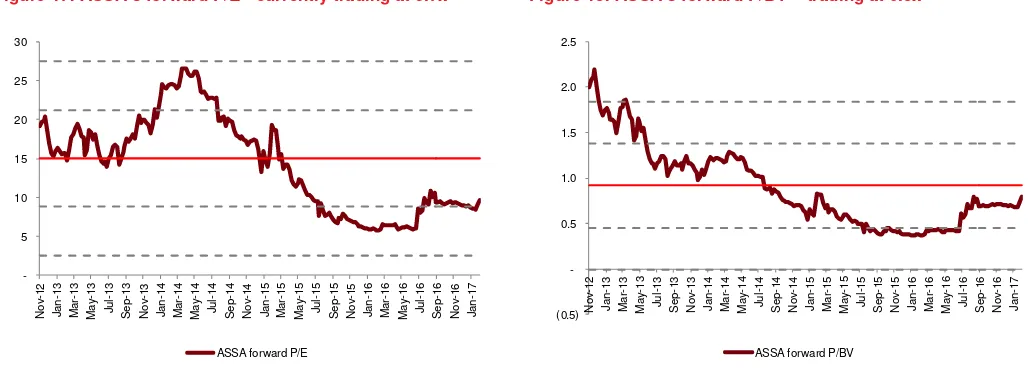
The stock is currently trading at 9.7x forward P/E and 0.8x forward P/BV. Given the visibility of a recovery scenario, we believe ASSA is grossly undervalued. While its share price has recovered by some 135% since Feb last year, it is still close to half its peak in end-2012.
0% 2% 4% 6% 8% 10% 12% 14%
0.5 1.0 1.5 2.0 2.5 3.0
2013 2014 2015 2016F 2017F 2018F
Net gearing, x ROAE (RHS)
0 20 40 60 80 100 120 140 160
Figure 17: ASSA’s forward P/E - currently trading at 9.7x Figure 18: ASSA’s forward P/BV – trading at 0.8x
SOURCES: CIMB, COMPANY REPORTS, BLOOMBERG SOURCES: CIMB, COMPANY REPORTS, BLOOMBERG
OUTLOOK
The corporate car rental benefits
To illustrate the benefits of clients outsourcing their car fleet to rental companies vs. buying and managing their own fleet, we run a simulation using three scenarios: 1) companies engaging car rental services, 2) companies buying and managing their cars by self-financing and 3) companies buying and managing their cars using credit purchases.
For the rental services, we use the assumption of a Toyota Avanza rental which now retails at a price of Rp180m (on-the-road price, after discounts), with a rental yield of 2.75% per month being charged to the client (about the rental yield ASSA is charging for Toyota Avanza). In this scenario, the customer will pay a fixed rental rate throughout the rental period of four years, while also being able to use such expense as a tax shield. We have assumed a corporate tax rate of 25%.
Figure 19: Rental simulation from customer’s point of view
SOURCES: CIMB
Our simulation using a cash outlay scenario and a discount rate of 14% suggests that managing own fleet through self-financing yields a 6% lower NPV than rental.
Figure 20: Customer’s point of view - self-financing corporate car purchase
SOURCES: CIMB
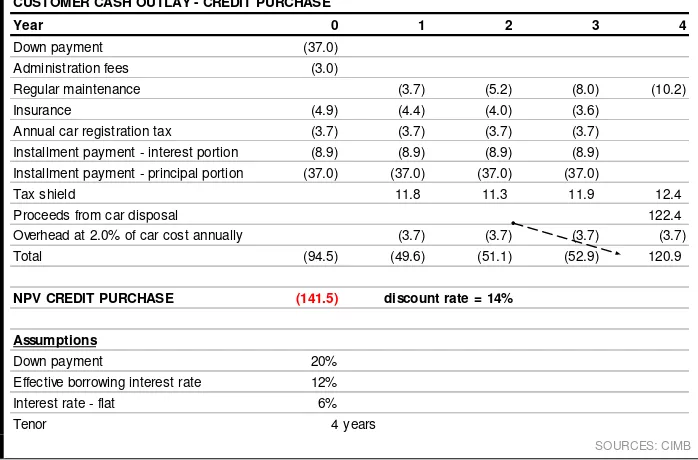
The scenario using credit financing yields an even more competitive NPV – about 8% better than the rental scenario – assuming 6% flat financing interest rate, a down payment of 20% and a discount rate of 14%.
Figure 21: Customer angle - corporate car purchase using credit
SOURCES: CIMB
Note that we have run our scenario analysis under the assumption that corporates managing their own fleet can be as cost efficient as rental companies. The rental companies, we believe, have the edge as they may be able to negotiate better discounts with the dealers as they buy cars in bulk (the gross fleet addition for ASSA has averaged 4k/year) as well as better prices for services and maintenance.
In any case, we think the NPV savings under the current interest rate environment (which are not that wide at 7-8%) are outweighed by the operational efficiency gained from outsourcing fleet management to rental companies. Note that corporate rental penetration is higher in more developed countries, i.e. Europe which has much lower interest rates than Indonesia. After all, some of ASSA’s larger clients (i.e. XL Axiata, HM Sampoerna and Alfamart) that have capital intensive businesses value ASSA’s service as an option to streamline their operations, as rental requires no staff and support infrastructure unlike owning/financing a car.
Year 0 1 2 3 4
Purchase cost (185.0)
Regular maintenance (3.7) (5.2) (8.0) (10.2) Insurance (4.9) (4.4) (4.0) (3.6)
Annual car registration tax (3.7) (3.7) (3.7) (3.7)
Tax shield 8.9 9.1 9.7 4.4 Proceeds from car disposal 122.4 Overhead at 2.0% of car cost annually (3.7) (3.7) (3.7) (3.7) Total (193.6) (6.7) (7.5) (9.3) 112.9
NPV SELF FINANCING (144.7) discount rate = 14%
CUSTOMER CASH OUTLAY - SELF FINANCING
Year 0 1 2 3 4
Down payment (37.0) Administration fees (3.0)
Regular maintenance (3.7) (5.2) (8.0) (10.2) Insurance (4.9) (4.4) (4.0) (3.6)
Annual car registration tax (3.7) (3.7) (3.7) (3.7) Installment payment - interest portion (8.9) (8.9) (8.9) (8.9) Installment payment - principal portion (37.0) (37.0) (37.0) (37.0)
Tax shield 11.8 11.3 11.9 12.4 Proceeds from car disposal 122.4 Overhead at 2.0% of car cost annually (3.7) (3.7) (3.7) (3.7) Total (94.5) (49.6) (51.1) (52.9) 120.9
NPV CREDIT PURCHASE (141.5) discount rate = 14%
Assumptions
Down payment 20%
Effective borrowing interest rate 12% Interest rate - flat 6%
Tenor 4 years
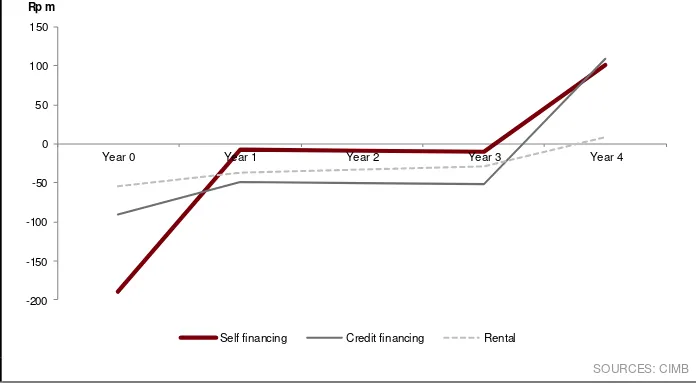
Figure 22: Rental provides the most stable cash outlay given the lack of down-payment and car maintenance and disposal responsibility. This results in the least risk to corporates' cash flow.
SOURCES: CIMB
Nevertheless, we believe there are obvious benefits of using rental services vs. managing own car fleet: 1) lower cash outlay (about c.40% lower) for the first year vs. credit financing, 2) ability to outsource many of the risks associated with owning a car i.e. maintenance costs and resale value of the car and 3) the ability to free up the company’s resources from car fleet management (i.e. staff and support infrastructure), thus focusing more on the core business.
Beyond auto rental
Over the past years, ASSA has developed its ancillary businesses alongside its rental business, namely a) auto auction business (Bid Win) and b) logistics business. While the logistics business is meant to provide complementary services to some of its customers, its auto auction business is more strategic as it handles sales of its growing fleet of used cars. If operated well, the auctioning business could boost its margin from used car sales, in our view. ASSA also offers this service to third parties i.e. leasing companies, banks, corporates as well as individuals. These parties may use ASSA’s auction houses to dispose their vehicles.
As of 9M16, 82% of ASSA’s revenue came from the rental business (rental revenue + used car disposals), while the rest came from logistics and auction businesses.
Figure 23: Rental business revenues (car rental + used car sales) used to constitute 85-88% of revenue (before
eliminations)…
Figure 24: …however, the contribution has declined to 82% as other ancillary businesses gained prominence
SOURCES: COMPANY REPORTS SOURCES: COMPANY REPORTS
-200 -150 -100 -50 0 50 100 150
Year 0 Year 1 Year 2 Year 3 Year 4
Self financing Credit financing Rental
Rp m
200 400 600 800 1,000 1,200 1,400 1,600
2012 2013 2014 2015 9M16
Car Rental Used car sales Logistic Auction Rp bn
Car Rental 70% Used car sales
12%
Logistic 17%
VALUATIONS AND RECOMMENDATIONS
Sensitivity analysis
As noted in previous sections, ASSA’s forecasts are sensitive to these key items: a) borrowing costs and b) used car price margins. Our sensitivity analysis suggests that every 25bp decline in borrowing costs would result in a 6% increase in our FY16F core earnings forecast.
Figure 25: Sensitivity analysis - borrowing rate
SOURCES: CIMB
On the other hand, our sensitivity analysis finds that every 5% drop in used car prices could decrease ASSA’s core profit by 11%, all else being equal.
Figure 26: Sensitivity analysis - used car prices margin
SOURCES: CIMB
Maintain ADD and GGM
-
based valuation of Rp350
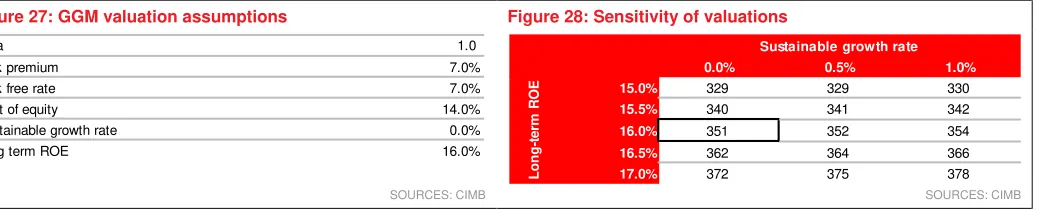
We maintain our GGM valuation with a long-term ROE assumption of 16%, LTG of 0% and a cost of equity of 14%. The assumptions are consistent with our positive outlook on the economy and manageable inflation, which all should translate into a) a recovery in the auto market, and b) improving demand for car rentals.
Our target price of Rp350/share is thus maintained, implying 11x FY18 P/E and 1.1x FY18 P/BV. Re-rating catalysts include faster-than-expected adjustments in borrowing rates and ROE adjustment. Downside risks could come from lower-than-expected used car sales margins.
Figure 27: GGM valuation assumptions Figure 28: Sensitivity of valuations
SOURCES: CIMB SOURCES: CIMB
Room for upside compared to global peers
ASSA’s current valuations of 10.1x FY17 P/E and 0.8x FY17 P/BV are well below the global average of 13x P/E and 2.4x P/BV. This may be explained by ASSA’s lower ROAE compared to peers. Nevertheless, we believe ASSA has the potential to catch up as it scales and leverages up closer to the industry average. Along with ASSA’s superior growth trajectory, all of these, in our view, should act as major re-rating catalysts for the stock.
FY17 core profit, Rp bn % deviation
+50bp change in borrowing rate 65.5 -12.1% +25bp change in borrowing rate 70.0 -6.0%
No change in assumed borrowing rate 74.5 0.0%
-25bp change in borrowing rate 79.0 6.0% -50bp change in borrowing rate 83.5 12.1%
FY17 core profit, Rp bn % deviation
+10% of used car price 90.6 21.7% +5% of used car price 82.6 10.9%
No change in used car price assumptions 74.5 0.0%
-5% of used car price 66.4 -10.9% -10% of used car price 58.3 -21.7%
Beta 1.0
Risk premium 7.0%
Risk free rate 7.0%
Cost of equity 14.0%
Sustainable growth rate 0.0%
Long term ROE 16.0%
0.0% 0.5% 1.0%
15.0% 329 329 330
15.5% 340 341 342
16.0% 351 352 354
16.5% 362 364 366
17.0% 372 375 378
Sustainable growth rate
Long-te
rm
R
O
Figure 29: Global rental/taxi peers comparison
SOURCES: CIMB, COMPANY REPORTS, BLOOMBERG
Market Cap (US$ m)
Core P/E
(x) P/BV (x)
EV/EBITDA (x)
Dividend Yield (%)
CY2017 CY2017 CY2017 CY2018 CY2017 CY2017
Adi Sarana Armada ASSA IJ Indonesia Rental Auto/Equipment 57 10.1 49.2% 0.79 8.0% 11.1% 5.3 2.4% Blue Bird BIRD IJ EQUITY Indonesia Transport-Services 614 10.7 -0.8% 1.58 14.8% 15.1% 5.2 2.9%
Indonesia average 10.4 24.2% 1.18 11.4% 13.1% 5.2 2.6%
ComfortDelGro CD SP Singapore Transport-Services 3,684 14.9 5.2% 2.02 13.7% 13.8% 6.6 4.7% Localiza Rent a Car RENT3 BZ Brazil Rental Auto/Equipment 2,821 19.3 10.3% 3.45 19.8% 20.6% 9.4 1.8% Hertz Global Holdings HTZ US United States Rental Auto/Equipment 1,873 11.4 55.6% 0.98 18.2% 16.2% 18.9 N/A Avis Budget Group CAR US United States Rental Auto/Equipment 3,574 11.8 7.2% 5.64 59.7% 46.3% 18.4 N/A
Overall global average 13.0 21.1% 2.41 22.4% 20.5% 10.6 2.9%
Company
Bloomberg
Ticker Country Sector
3-year EPS CAGR (%)
BY THE NUMBERS
12-mth Fwd Rolling FD Core P/E (x) (lhs) FD Core EPS Growth (rhs)
Profit & Loss
(Rpb) Dec-14A Dec-15A Dec-16F Dec-17F Dec-18F
Total Net Revenues 1,140 1,393 1,512 1,717 2,026
Gross Profit 627 741 812 931 1,121
Operating EBITDA 480 562 639 722 874
Depreciation And Amortisation (285) (334) (381) (419) (486)
Operating EBIT 196 228 258 303 388
Financial Income/(Expense) (139) (171) (187) (209) (248) Pretax Income/(Loss) from Assoc. 0 0 0 0 0 Non-Operating Income/(Expense) 0 0 0 0 0
Profit Before Tax (pre-EI) 56 57 71 94 140
Exceptional Items 0 0 0 0 0
Pre-tax Profit 56 57 71 94 140
Taxation (13) (23) (16) (20) (29)
Exceptional Income - post-tax 0 0 0 0 0
Profit After Tax 43 34 55 74 111
Minority Interests 0 0 0 0 (0)
Preferred Dividends 0 0 0 0 0
FX Gain/(Loss) - post tax 0 0 0 0 0
Other Adjustments - post-tax 0 0 0 0 0
Net Profit 43 34 55 74 111
Recurring Net Profit 43 34 55 74 111
Fully Diluted Recurring Net Profit 43 34 55 74 111
Cash Flow
(Rpb) Dec-14A Dec-15A Dec-16F Dec-17F Dec-18F
EBITDA 480.4 561.5 638.8 722.4 874.2
Cash Flow from Invt. & Assoc. 0.0 0.0 0.0 0.0 0.0 Change In Working Capital (7.2) (31.5) (9.2) (16.1) (18.0) (Incr)/Decr in Total Provisions 0.0 0.0 0.0 0.0 0.0 Other Non-Cash (Income)/Expense 0.0 0.0 0.0 0.0 0.0 Other Operating Cashflow (418.9) (429.9) (440.2) (876.8) (991.3) Net Interest (Paid)/Received (139.3) (170.9) (186.5) (209.0) (247.7) Tax Paid (13.4) (22.7) (16.1) (19.8) (29.4)
Cashflow From Operations (98.4) (93.5) (13.2) (399.2) (412.1)
Capex (57.1) (45.3) (22.7) (23.6) (24.6) Disposals Of FAs/subsidiaries 0.0 0.0 0.0 0.0 0.0 Acq. Of Subsidiaries/investments 0.0 0.0 0.0 0.0 0.0 Other Investing Cashflow 0.0 0.0 0.0 0.0 0.0
Cash Flow From Investing (57.1) (45.3) (22.7) (23.6) (24.6)
Debt Raised/(repaid) 181.7 162.0 45.7 452.6 443.4 Proceeds From Issue Of Shares 0.0 0.0 0.0 0.0 2.0
Shares Repurchased 0.0 0.0 0.0 0.0 0.0
Dividends Paid (30.6) (17.0) (11.4) (18.4) (24.9) Preferred Dividends 0.0 0.0 0.0 0.0 0.0 Other Financing Cashflow 0.0 0.0 0.0 0.0 0.0
Cash Flow From Financing 151.1 145.0 34.3 434.2 420.5
Total Cash Generated (4.4) 6.3 (1.7) 11.3 (16.2)
Free Cashflow To Equity 26.2 23.3 9.7 29.7 6.7
BY THE NUMBERS…
cont’d
SOURCE: CIMB RESEARCH, COMPANY DATA
Balance Sheet
(Rpb) Dec-14A Dec-15A Dec-16F Dec-17F Dec-18F
Total Cash And Equivalents 22 28 26 38 21
Total Debtors 136 179 194 221 260
Inventories 26 20 20 24 23
Total Other Current Assets 33 39 42 48 57
Total Current Assets 216 266 283 331 362
Fixed Assets 2,193 2,538 2,620 3,101 3,630
Total Investments 0 0 0 0 0
Intangible Assets 0 0 0 0 0
Total Other Non-Current Assets 99 89 89 89 89
Total Non-current Assets 2,292 2,627 2,709 3,190 3,720
Short-term Debt 23 28 8 8 8
Current Portion of Long-Term Debt 387 456 533 665 795
Total Creditors 87 86 94 105 123
Other Current Liabilities 41 54 56 65 77
Total Current Liabilities 538 625 691 844 1,003
Total Long-term Debt 1,046 1,300 1,289 1,609 1,923 Hybrid Debt - Debt Component 0 0 0 0 0 Total Other Non-Current Liabilities 86 114 114 114 114
Total Non-current Liabilities 1,132 1,413 1,403 1,723 2,037
Total Provisions 0 0 0 0 0
Total Liabilities 1,670 2,038 2,094 2,567 3,039
Shareholders' Equity 837 854 898 954 1,042
Minority Interests 0 0 0 0 0
Total Equity 837 855 898 954 1,042
Key Ratios
Dec-14A Dec-15A Dec-16F Dec-17F Dec-18F
Revenue Growth 11.9% 22.1% 8.6% 13.6% 18.0% Operating EBITDA Growth 3.4% 16.9% 13.8% 13.1% 21.0% Operating EBITDA Margin 42.1% 40.3% 42.3% 42.1% 43.2% Net Cash Per Share (Rp) (422.0) (517.0) (531.0) (660.8) (796.1) BVPS (Rp) 246.5 251.5 264.4 280.9 306.7 Gross Interest Cover 1.40 1.33 1.38 1.45 1.56 Effective Tax Rate 23.7% 39.9% 22.6% 21.0% 21.0% Net Dividend Payout Ratio 71.2% 49.7% 20.6% 24.7% 22.5% Accounts Receivables Days 37.85 39.13 42.40 41.39 40.66 Inventory Days 20.63 12.69 10.33 10.23 9.56 Accounts Payables Days 32.85 28.26 24.31 23.85 23.54 ROIC (%) 7.71% 7.73% 7.57% 8.62% 9.36%
ROCE (%) 9.2% 9.3% 9.6% 10.2% 11.1%
DISCLAIMER #01 The content of this report (including the views and opinions expressed therein, and the information comprised therein) has been prepared by and belongs to CIMB and is distributed by CIMB.
This report is not directed to, or intended for distribution to or use by, any person or entity who is a citizen or resident of or located in any locality, state, country or other jurisdiction where such distribution, publication, availability or use would be contrary to law or regulation.
By accepting this report, the recipient hereof represents and warrants that he is entitled to receive such report in accordance with the restrictions set forth below and agrees to be bound by the limitations contained herein (including the “Restrictions on Distributions” set out below). Any failure to comply with these limitations may constitute a violation of law. This publication is being supplied to you strictly on the basis that it will remain confidential. No part of this report may be (i) copied, photocopied, duplicated, stored or reproduced in any form by any means or (ii) redistributed or passed on, directly or indirectly, to any other person in whole or in part, for any purpose without the prior written consent of CIMB. The information contained in this research report is prepared from data believed to be correct and reliable at the time of issue of this report. CIMB may or may not issue regular reports on the subject matter of this report at any frequency and may cease to do so or change the periodicity of reports at any time. CIMB is under no obligation to update this report in the event of a material change to the information contained in this report. CIMB has no, and will not accept any, obligation to (i) check or ensure that the contents of this report remain current, reliable or relevant, (ii) ensure that the content of this report constitutes all the information a prospective investor may require, (iii) ensure the adequacy, accuracy, completeness, reliability or fairness of any views, opinions and information, and accordingly, CIMB, or any of their respective affiliates, or its related persons (and their respective directors, associates, connected persons and/or employees) shall not be liable in any manner whatsoever for any consequences (including but not limited to any direct, indirect or consequential losses, loss of profits and damages) of any reliance thereon or usage thereof. In particular, CIMB disclaims all responsibility and liability for the views and opinions set out in this report.
Unless otherwise specified, this report is based upon sources which CIMB considers to be reasonable. Such sources will, unless otherwise specified, for market data, be market data and prices available from the main stock exchange or market where the relevant security is listed, or, where appropriate, any other market. Information on the accounts and business of company(ies) will generally be based on published statements of the company(ies), information disseminated by regulatory information services, other publicly available information and information resulting from our research.
Whilst every effort is made to ensure that statements of facts made in this report are accurate, all estimates, projections, forecasts, expressions of opinion and other subjective judgments contained in this report are based on assumptions considered to be reasonable as of the date of the document in which they are contained and must not be construed as a representation that the matters referred to therein will occur. Past performance is not a reliable indicator of future performance. The value of investments may go down as well as up and those investing may, depending on the investments in question, lose more than the initial investment. No report shall constitute an offer or an invitation by or on behalf of CIMB or its affiliates to any person to buy or sell any investments.
CIMB, its affiliates and related companies, their directors, associates, connected parties and/or employees may own or have positions in securities of the company(ies) covered in this research report or any securities related thereto and may from time to time add to or dispose of, or may be materially interested in, any such securities. Further, CIMB, its affiliates and its related companies do and seek to do business with the company(ies) covered in this research report and may from time to time act as market maker or have assumed an underwriting commitment in securities of such company(ies), may sell them to or buy them from customers on a principal basis and may also perform or seek to perform significant investment banking, advisory, underwriting or placement services for or relating to such company(ies) as well as solicit such investment, advisory or other services from any entity mentioned in this report.
CIMB or its affiliates may enter into an agreement with the company(ies) covered in this report relating to the production of research reports. CIMB may disclose the contents of this report to the company(ies) covered by it and may have amended the contents of this report following such disclosure.
The analyst responsible for the production of this report hereby certifies that the views expressed herein accurately and exclusively reflect his or her personal views and opinions about any and all of the issuers or securities analysed in this report and were prepared independently and autonomously. No part of the compensation of the analyst(s) was, is, or will be directly or indirectly related to the inclusion of specific recommendations(s) or view(s) in this report. CIMB prohibits the analyst(s) who prepared this research report from receiving any compensation, incentive or bonus based on specific investment banking transactions or for providing a specific recommendation for, or view of, a particular company. Information barriers and other arrangements may be established where necessary to prevent conflicts of interests arising. However, the analyst(s) may receive compensation that is based on his/their coverage of company(ies) in the performance of his/their duties or the performance of his/their recommendations and the research personnel involved in the preparation of this report may also participate in the solicitation of the businesses as described above. In reviewing this research report, an investor should be aware that any or all of the foregoing, among other things, may give rise to real or potential conflicts of interest. Additional information is, subject to the duties of confidentiality, available on request.
Reports relating to a specific geographical area are produced by the corresponding CIMB entity as listed in the table below. The term “CIMB” shall denote, where appropriate, the relevant entity distributing or disseminating the report in the particular jurisdiction referenced below, or, in every other case, CIMB Group Holdings Berhad ("CIMBGH") and its affiliates, subsidiaries and related companies.
Country CIMB Entity Regulated by
Hong Kong CIMB Securities Limited Securities and Futures Commission Hong Kong
India CIMB Securities (India) Private Limited Securities and Exchange Board of India (SEBI) Indonesia PT CIMB Securities Indonesia Financial Services Authority of Indonesia
Malaysia CIMB Investment Bank Berhad Securities Commission Malaysia
Singapore CIMB Research Pte. Ltd. Monetary Authority of Singapore
South Korea CIMB Securities Limited, Korea Branch Financial Services Commission and Financial Supervisory Service Taiwan CIMB Securities Limited, Taiwan Branch Financial Supervisory Commission
(i) As of February 16, 2017 CIMB has a proprietary position in the securities (which may include but not limited to shares, warrants, call warrants and/or any other derivatives) in the following company or companies covered or recommended in this report:
(a) ComfortDelGro
(ii) As of February 16, 2017, the analyst(s) who prepared this report, and the associate(s), has / have an interest in the securities (which may include but not limited to shares, warrants, call warrants and/or any other derivatives) in the following company or companies covered or recommended in this report:
(a) -
This report does not purport to contain all the information that a prospective investor may require. CIMB or any of its affiliates does not make any guarantee, representation or warranty, express or implied, as to the adequacy, accuracy, completeness, reliability or fairness of any such information and opinion contained in this report. Neither CIMB nor any of its affiliates nor its related persons shall be liable in any manner whatsoever for any consequences (including but not limited to any direct, indirect or consequential losses, loss of profits and damages) of any reliance thereon or usage thereof.
This report is general in nature and has been prepared for information purposes only. It is intended for circulation amongst CIMB and its affiliates’ clients generally and does not have regard to the specific investment objectives, financial situation and the particular needs of any specific person who may receive this report. The information and opinions in this report are not and should not be construed or considered as an offer, recommendation or solicitation to buy or sell the subject securities, related investments or other financial instruments or any derivative instrument, or any rights pertaining thereto.
Investors are advised to make their own independent evaluation of the information contained in this research report, consider their own individual investment objectives, financial situation and particular needs and consult their own professional and financial advisers as to the legal, business, financial, tax and other aspects before participating in any transaction in respect of the securities of company(ies) covered in this research report. The securities of such company(ies) may not be eligible for sale in all jurisdictions or to all categories of investors.
Australia: Despite anything in this report to the contrary, this research is provided in Australia by CIMB Securities (Singapore) Pte. Ltd. and CIMB Securities Limited. This research is only available in Australia to persons who are “wholesale clients” (within the meaning of the Corporations Act 2001 (Cth) and is supplied solely for the use of such wholesale clients and shall not be distributed or passed on to any other
person. You represent and warrant that if you are in Australia, you are a “wholesale client”. This research is of a general nature only and has been prepared without taking into account the objectives, financial situation or needs of the individual recipient. CIMB Securities (Singapore) Pte. Ltd. and CIMB Securities Limited do not hold, and are not required to hold an Australian financial services licence. CIMB Securities (Singapore)
Pte. Ltd. and CIMB Securities Limited rely on “passporting” exemptions for entities appropriately licensed by the Monetary Authority of Singapore
(under ASIC Class Order 03/1102) and the Securities and Futures Commission in Hong Kong (under ASIC Class Order 03/1103).
Canada: This research report has not been prepared in accordance with the disclosure requirements of Dealer Member Rule 3400 – Research Restrictions and Disclosure Requirements of the Investment Industry Regulatory Organization of Canada. For any research report distributed by CIBC, further disclosures related to CIBC conflicts of interest can be found at https://researchcentral.cibcwm.com .
China:For the purpose of this report, the People’s Republic of China (“PRC”) does not include the Hong Kong Special Administrative Region, the Macau Special Administrative Region or Taiwan. The distributor of this report has not been approved or licensed by the China Securities Regulatory Commission or any other relevant regulatory authority or governmental agency in the PRC. This report contains only marketing information. The distribution of this report is not an offer to buy or sell to any person within or outside PRC or a solicitation to any person within or outside of PRC to buy or sell any instruments described herein. This report is being issued outside the PRC to a limited number of institutional investors and may not be provided to any person other than the original recipient and may not be reproduced or used for any other purpose.
France: Only qualified investors within the meaning of French law shall have access to this report. This report shall not be considered as an offer to subscribe to, or used in connection with, any offer for subscription or sale or marketing or direct or indirect distribution of financial instruments and it is not intended as a solicitation for the purchase of any financial instrument.
Germany: This report is only directed at persons who are professional investors as defined in sec 31a(2) of the German Securities Trading Act (WpHG). This publication constitutes research of a non-binding nature on the market situation and the investment instruments cited here at the time of the publication of the information.
The current prices/yields in this issue are based upon closing prices from Bloomberg as of the day preceding publication. Please note that neither the German Federal Financial Supervisory Agency (BaFin), nor any other supervisory authority exercises any control over the content of this report.
Hong Kong: This report is issued and distributed in Hong Kong by CIMB Securities Limited (“CHK”) which is licensed in Hong Kong by the Securities and Futures Commission for Type 1 (dealing in securities), Type 4 (advising on securities) and Type 6 (advising on corporate finance) activities. Any investors wishing to purchase or otherwise deal in the securities covered in this report should contact the Head of Sales at CIMB Securities Limited. The views and opinions in this research report are our own as of the date hereof and are subject to change. If the Financial Services and Markets Act of the United Kingdom or the rules of the Financial Conduct Authority apply to a recipient, our obligations owed to such recipient therein are unaffected. CHK has no obligation to update its opinion or the information in this research report.
This publication is strictly confidential and is for private circulation only to clients of CHK. CIMB Securities Limited does not make a market on the securities mentioned in the report.
India: This report is issued and distributed in India by CIMB Securities (India) Private Limited (”CIMB India") which is registered with SEBI as a stock-broker under the Securities and Exchange Board of India (Stock Brokers and Sub-Brokers) Regulations, 1992, the Securities and Exchange Board of India (Research Analyst) Regulations, 2014 (SEBI Registration Number INH000000669) and in accordance with the provisions of Regulation 4 (g) of the Securities and Exchange Board of India (Investment Advisers) Regulations, 2013, CIMB India is not required to seek registration with SEBI as an Investment Adviser.
and value of research, firm profitability or revenues, client feedback and competitive factors. Research analysts', strategists' or economists' compensation is not linked to investment banking or capital markets transactions performed or proposed to be performed by CIMB India or its
affiliates.”
Indonesia:This report is issued and distributed by PT CIMB Securities Indonesia (“CIMBI”). The views and opinions in this research report are our own as of the date hereof and are subject to change. If the Financial Services and Markets Act of the United Kingdom or the rules of the Financial Conduct Authority apply to a recipient, our obligations owed to such recipient therein are unaffected. CIMBI has no obligation to update its opinion or the information in this research report. Neither this report nor any copy hereof may be distributed in Indonesia or to any Indonesian citizens wherever they are domiciled or to Indonesian residents except in compliance with applicable Indonesian capital market laws and regulations.
This research report is not an offer of securities in Indonesia. The securities referred to in this research report have not been registered with the Financial Services Authority (Otoritas Jasa Keuangan) pursuant to relevant capital market laws and regulations, and may not be offered or sold within the territory of the Republic of Indonesia or to Indonesian citizens through a public offering or in circumstances which constitute an offer within the meaning of the Indonesian capital market law and regulations.
Ireland: CIMB is not an investment firm authorised in the Republic of Ireland and no part of this document should be construed as CIMB acting as, or otherwise claiming or representing to be, an investment firm authorised in the Republic of Ireland.
Malaysia:This report is issued and distributed by CIMB Investment Bank Berhad (“CIMB”) solely for the benefit of and for the exclusive use of our clients. If the Financial Services and Markets Act of the United Kingdom or the rules of the Financial Conduct Authority apply to a recipient, our obligations owed to such recipient therein are unaffected. CIMB has no obligation to update, revise or reaffirm its opinion or the information in this research reports after the date of this report.
New Zealand: In New Zealand, this report is for distribution only to persons who are wholesale clients pursuant to section 5C of the Financial Advisers Act 2008.
Singapore:This report is issued and distributed by CIMB Research Pte Ltd (“CIMBR”). CIMBR is a financial adviser licensed under the Financial
Advisers Act, Cap 110 (“FAA”) for advising on investment products, by issuing or promulgating research analyses or research reports, whether in electronic, print or other form. Accordingly CIMBR is a subject to the applicable rules under the FAA unless it is able to avail itself to any prescribed exemptions.
Recipients of this report are to contact CIMB Research Pte Ltd, 50 Raffles Place, #19-00 Singapore Land Tower, Singapore in respect of any matters arising from, or in connection with this report. CIMBR has no obligation to update its opinion or the information in this research report. This publication is strictly confidential and is for private circulation only. If you have not been sent this report by CIMBR directly, you may not rely, use or disclose to anyone else this report or its contents.
If the recipient of this research report is not an accredited investor, expert investor or institutional investor, CIMBR accepts legal responsibility for the contents of the report without any disclaimer limiting or otherwise curtailing such legal responsibility. If the recipient is an accredited investor, expert investor or institutional investor, the recipient is deemed to acknowledge that CIMBR is exempt from certain requirements under the FAA and its attendant regulations, and as such, is exempt from complying with the following :
(a) Section 25 of the FAA (obligation to disclose product information);
(b) Section 27 (duty not to make recommendation with respect to any investment product without having a reasonable basis where you may be reasonably expected to rely on the recommendation) of the FAA;
(c) MAS Notice on Information to Clients and Product Information Disclosure [Notice No. FAA-N03]; (d) MAS Notice on Recommendation on Investment Products [Notice No. FAA-N16];
(e) Section 36 (obligation on disclosure of interest in securities), and
(f) any other laws, regulations, notices, directive, guidelines, circulars and practice notes which are relates to the above, to the extent permitted by applicable laws, as may be amended from time to time, and any other laws, regulations, notices, directive, guidelines, circulars, and practice notes as we may notify you from time to time. In addition, the recipient who is an accredited investor, expert investor or institutional investor acknowledges that a CIMBR is exempt from Section 27 of the FAA, the recipient will also not be able to file a civil claim against CIMBR for any
loss or damage arising from the recipient’s reliance on any recommendation made by CIMBR which would otherwise be a right that is available to the recipient under Section 27 of the FAA, the recipient will also not be able to file a civil claim against CIMBR for any loss or damage arising
from the recipient’s reliance on any recommendation made by CIMBR which would otherwise be a right that is available to the recipient under Section 27 of the FAA.
CIMB Research Pte Ltd ("CIMBR"), its affiliates and related companies, their directors, associates, connected parties and/or employees may own or have positions in securities of the company(ies) covered in this research report or any securities related thereto and may from time to time add to or dispose of, or may be materially interested in, any such securities. Further, CIMBR, its affiliates and its related companies do and seek to do business with the company(ies) covered in this research report and may from time to time act as market maker or have assumed an underwriting commitment in securities of such company(ies), may sell them to or buy them from customers on a principal basis and may also perform or seek to perform significant investment banking, advisory, underwriting or placement services for or relating to such company(ies) as well as solicit such investment, advisory or other services from any entity mentioned in this report.
As of February 16, 2017, CIMBR does not have a proprietary position in the recommended securities in this report. CIMB Securities Singapore Pte Ltd and/or CIMB Bank does not make a market on the securities mentioned in the report.
South Korea:This report is issued and distributed in South Korea by CIMB Securities Limited, Korea Branch (“CIMB Korea”) which is licensed as a cash equity broker, and regulated by the Financial Services Commission and Financial Supervisory Service of Korea. In South Korea, this report is for distribution only to professional investors under Article 9(5) of the Financial Investment Services and Capital Market Act of Korea
(“FSCMA”).
CIMB is not registered with the Spanish Comision Nacional del Mercado de Valores to provide investment services.
Sweden: This report contains only marketing information and has not been approved by the Swedish Financial Supervisory Authority. The distribution of this report is not an offer to sell to any person in Sweden or a solicitation to any person in Sweden to buy any instruments described herein and may not be forwarded to the public in Sweden.
Switzerland: This report has not been prepared in accordance with the recognized self-regulatory minimal standards for research reports of
banks issued by the Swiss Bankers’ Association (Directives on the Independence of Financial Research).
Taiwan: This research report is not an offer or marketing of foreign securities in Taiwan. The securities as referred to in this research report have not been and will not be registered with the Financial Supervisory Commission of the Republic of China pursuant to relevant securities laws and regulations and may not be offered or sold within the Republic of China through a public offering or in circumstances which constitutes an offer or a placement within the meaning of the Securities and Exchange Law of the Republic of China that requires a registration or approval of the Financial Supervisory Commission of the Republic of China.
Thailand:This report is issued and distributed by CIMB Securities (Thailand) Company Limited (“CIMBS”) based upon sources believed to be reliable (but their accuracy, completeness or correctness is not guaranteed). The statements or expressions of opinion herein were arrived at after due and careful consideration for use as information for investment. Such opinions are subject to change without notice and CIMBS has no obligation to update its opinion or the information in this research report.
If the Financial Services and Markets Act of the United Kingdom or the rules of the Financial Conduct Authority apply to a recipient, our obligations owed to such recipient are unaffected.
CIMB Securities (Thailand) Co., Ltd. may act or acts as Market Maker, and issuer and offerer of Derivative Warrants and Structured Note which may have the following securities as its underlying securities. Investors should carefully read and study the details of the derivative warrants in the prospectus before making investment decisions.
AAV, ADVANC, AMATA, AOT, AP, BA, BANPU, BBL, BCH, BCP, BDMS, BEAUTY, BEC, BEM, BH, BIG, BLA, BLAND, BTS, CBG, CENTEL, CHG, CK, CKP, COM7, CPALL, CPF, CPN, DELTA, DTAC, EGCO, EPG, GLOBAL, GLOW, GPSC, GUNKUL, HANA, HMPRO, ICHI, IFEC, INTUCH, IRPC, ITD, IVL, KAMART, KBANK, KCE, KKP, KTB, KTC, LH, LHBANK, LPN, MAJOR, MINT, MTLS, PLANB, PSH, PTG, PTT, PTTEP, PTTGC, QH, ROBINS, RS, S, SAMART, SAWAD, SCB, SCC, SCN, SGP, SIRI, SPALI, SPCG, SPRC, STEC, STPI, SUPER, TASCO, TCAP, THAI, THANI, THCOM, TISCO, TKN, TMB, TOP, TPIPL, TRUE, TTA, TTCL, TTW, TU, TVO, UNIQ, VGI, VIBHA, VNG, WHA.
Corporate Governance Report:
The disclosure of the survey result of the Thai Institute of Directors Association (“IOD”) regarding corporate governance is made pursuant to the policy of the Office of the Securities and Exchange Commission. The survey of the IOD is based on the information of a company listed on the Stock Exchange of Thailand and the Market for Alternative Investment disclosed to the public and able to be accessed by a general public investor. The result, therefore, is from the perspective of a third party. It is not an evaluation of operation and is not based on inside information. The survey result is as of the date appearing in the Corporate Governance Report of Thai Listed Companies. As a result, the survey result may be changed after that date. CIMBS does not confirm nor certify the accuracy of such survey result.
Score Range: 90 - 100 80 - 89 70 - 79 Below 70 or No Survey Result
Description: Excellent Very Good Good N/A
United Arab Emirates: The distributor of this report has not been approved or licensed by the UAE Central Bank or any other relevant licensing authorities or governmental agencies in the United Arab Emirates. This report is strictly private and confidential and has not been reviewed by, deposited or registered with UAE Central Bank or any other licensing authority or governmental agencies in the United Arab Emirates. This report is being issued outside the United Arab Emirates to a limited number of institutional investors and must not be provided to any person other than the original recipient and may not be reproduced or used for any other purpose. Further, the information contained in this report is not intended to lead to the sale of investments under any subscription agreement or the conclusion of any other contract of whatsoever nature within the territory of the United Arab Emirates.
United Kingdom: In the United Kingdom and European Economic Area, this report is being disseminated by CIMB Securities (UK) Limited
(“CIMB UK”). CIMB UK is authorized and regulated by the Financial Conduct Authority and its registered office is at 27 Knightsbridge, London, SW1X7YB. Unless specified to the contrary, this report has been issued and approved for distribution in the U.K. and the EEA by CIMB UK.
Investment research issued by CIMB UK has been prepared in accordance with CIMB Group’s policies for managing conflicts of interest arising as a result of publication and distribution of investment research. This report is for distribution only to, and is solely directed at, selected persons on the basis that those persons: (a) are eligible counterparties and professional clients of CIMB UK; (b) have professional experience in matters relating to investments falling within Article 19(5) of the Financial Services and Markets Act 2000 (Financial Promotion) Order 2005 (as amended,
the “Order”), (c) fall within Article 49(2)(a) to (d) (“high net worth companies, unincorporated associations etc”) of the Order; (d) are outside the United Kingdom subject to relevant regulation in each jurisdiction, or (e) are persons to whom an invitation or inducement to engage in investment activity (within the meaning of section 21 of the Financial Services and Markets Act 2000) in connection with any investments to which this report relates may otherwise lawfully be communicated or caused to be communicated (all such persons together being referred to as
“relevant persons”). This report is directed only at relevant persons and must not be acted on or relied on by persons who are not relevant persons. Any investment or investment activity to which this report relates is available only to relevant persons and will be engaged in only with relevant persons.
Where this report is labelled as non-independent, it does not provide an impartial or objective assessment of the subject matter and does not
constitute independent “investment research” under the applicable rules of the Financial Conduct Authority in the UK. Consequently, any such non-independent report will not have been prepared in accordance with legal requirements designed to promote the independence of investment research and will not subject to any prohibition on dealing ahead of the dissemination of investment research. Any such non-independent report must be considered as a marketing communication.
Co. Ltd, CIMB Securities Limited, CIMB Securities (India) Private Limited, and is distributed solely to persons who qualify as “U.S. Institutional
Investors” as defined in Rule 15a-6 under the Securities and Exchange Act of 1934. This communication is only for Institutional Investors whose ordinary business activities involve investing in shares, bonds, and associated securities and/or derivative securities and who have professional experience in such investments. Any person who is not a U.S. Institutional Investor or Major Institutional Investor must not rely on this communication. The delivery of this research report to any person in the United States of America is not a recommendation to effect any transactions in the securities discussed herein, or an endorsement of any opinion expressed herein. CIMB Securities (USA) Inc, is a FINRA/SIPC member and takes responsibility for the content of this report. For further information or to place an order in any of the above-mentioned securities please contact a registered representative of CIMB Securities (USA) Inc.
CIMB Securities (USA) Inc does not make a market on the securities mentioned in the report.
Other jurisdictions: In any other jurisdictions, except if otherwise restricted by laws or regulations, this report is only for distribution to professional, institutional or sophisticated investors as defined in the laws and regulations of such jurisdictions.
Spitzer Chart for stock being researched ( 2 year data )
Adi Sarana (ASSA IJ)
Corporate Governance Report of Thai Listed Companies (CGR). CG Rating by the Thai Institute of Directors Association (Thai IOD) in 2016, Anti-Corruption 2016.
AAV– Very Good, n/a, ADVANC– Very Good, Certified, AEONTS– Good, n/a, AMATA– Excellent, Declared, ANAN– Very Good, Declared,
AOT – Excellent, Declared, AP – Very Good, Declared, ASK– Very Good, Declared, ASP – Very Good, Certified, BANPU – Very Good, Certified, BAY– Excellent, Certified, BBL– Very Good, Certified, BCH– not available, Declared, BCP - Excellent, Certified, BEM– Very Good, n/a, BDMS– Very Good, n/a, BEAUTY– Good, Declared, BEC - Good, n/a, BH - Good, Declared, BIGC - Excellent, Declared, BJC– Good, n/a, BLA– Very Good, Certified, BPP– not available, n/a, BTS - Excellent, Certified, CBG– Good, n/a, CCET– not available, n/a, CENTEL–
Very Good, Certified, CHG – Very Good, n/a, CK– Excellent, n/a, COL – Very Good, Declared, CPALL– not available, Declared, CPF –
Excellent, Declared, CPN - Excellent, Certified, DELTA - Excellent, Declared, DEMCO– Excellent, Certified, DTAC– Excellent, Certified, EA–
Very Good, Declared, ECL– Good, Certified, EGCO - Excellent, Certified, EPG– Good, n/a, GFPT - Excellent, Declared, GLOBAL– Very Good, Declared, GLOW– Very Good, Certified, GPSC– Excellent, Declared, GRAMMY - Excellent, n/a, GUNKUL– Very Good, Declared,
HANA - Excellent, Certified, HMPRO - Excellent, Declared, ICHI– Very Good, Declared, INTUCH - Excellent, Certified, ITD– Good, n/a, IVL - Excellent, Certified, JAS– not available, Declared, JASIF– not available, n/a, JUBILE– Good, Declared, KAMART– not available, n/a, KBANK
- Excellent, Certified, KCE - Excellent, Certified, KGI– Good, Certified, KKP– Excellent, Certified, KSL– Very Good, Declared, KTB - Excellent, Certified, KTC– Excellent, Certified, LH - Very Good, n/a, LPN– Excellent, Declared, M– Very Good, Declared, MAJOR - Good, n/a, MAKRO–
Good, Declared, MALEE– Very Good, Declared, MBKET– Very Good, Certified, MC– Very Good, Declared, MCOT– Excellent, Declared,
MEGA– Very Good, Declared, MINT - Excellent, Certified, MTLS– Very Good, Declared, NYT– Excellent, n/a, OISHI– Very Good, n/a, PLANB
– Very Good, Declared, PSH– not available, n/a, PSL - Excellent, Certified, PTT - Excellent, Certified, PTTEP - Excellent, Certified, PTTGC - Excellent, Certified, QH– Excellent, Declared, RATCH– Excellent, Certified, ROBINS– Very Good, Declared, RS– Very Good, n/a, SAMART - Excellent, n/a, SAPPE - Good, n/a, SAT– Excellent, Certified, SAWAD– Good, n/a, SC – Excellent, Declared, SCB - Excellent, Certified,
SCBLIF– not available, n/a, SCC– Excellent, Certified, SCN– Good, Declared, SCCC - Excellent, Declared, SIM - Excellent, n/a, SIRI - Good, n/a, SPALI - Excellent, Declared, SPRC– Very Good, Declared, STA– Very Good, Declared, STEC– Excellent, n/a, SVI– Excellent, Certified,
TASCO– Very Good, Declared, TCAP– Excellent, Certified, THAI– Very Good, Declared, THANI– Very Good, Certified, THCOM– Excellent, Certified, THRE– Very Good, Certified, THREL– Very Good, Certified, TICON– Very Good, Declared, TISCO - Excellent, Certified, TK– Very Good, n/a, TKN– Good, n/a, TMB - Excellent, Certified, TOP - Excellent, Certified, TPCH– Good, n/a, TPIPP– not available, n/a, TRUE– Very Good, Declared, TTW– Very Good, Declared, TU– Excellent, Declared, UNIQ– not available, Declared, VGI– Excellent, Declared, WHA– not available, Declared, WHART– not available, n/a, WORK– not available, n/a.
Companies participating in Thailand’s Private Sector Collective Action Coalition Against Corruption programme (Thai CAC) under Thai
Institute of Directors (as of October 28, 2016) are categorized into:
Rating Distribution (%) Investment Banking clients (%)
Add 58.4% 5.4%
Hold 29.6% 1.4%
Reduce 11.6% 0.4%
Distribution of stock ratings and investment banking clients for quarter ended on 31 December 2016
1626 companies under coverage for quarter ended on 31 December 2016
- Companies that have declared their intention to join CAC, and - Companies certified by CAC
CIMB Recommendation Framework
Stock Ratings Definition:
Add The stock’s total return is expected to exceed 10% over the next 12 months.
Hold The stock’s total return is expected to be between 0% and positive 10% over the next 12 months. Reduce The stock’s total return is expected to fall below 0% or more over the next 12 months.
The total expected return of a stock is defined as the sum of the: (i) percentage difference between the target price and the current price and (ii) the forward net dividend yields of the stock. Stock price targets have an investment horizon of 12 months.
Sector Ratings Definition:
Overweight An Overweight rating means stocks in the sector have, on a market cap-weighted basis, a positive absolute recommendation.
Neutral A Neutral rating means stocks in the sector have, on a market cap-weighted basis, a neutral absolute recommendation.
Underweight An Underweight rating means stocks in the sector have, on a market cap-weighted basis, a negative absolute recommendation.
Country Ratings Definition:
Overweight An Overweight rating means investors should be positioned with an above-market weight in this country relative to benchmark.
Neutral A Neutral rating means investors should be positioned with a neutral weight in this country relative to benchmark.
Underweight An Underweight rating means investors should be positioned with a below-market weight in this country relative to benchmark.