Oracle® Fusion Middleware
User's Guide for Oracle Business Intelligence Discoverer
Desktop
11
g
Release 1 (11.1.1)
B40106-01B40106-01
Copyright © 1996, 2009, Oracle and/or its affiliates. All rights reserved.
This software and related documentation are provided under a license agreement containing restrictions on use and disclosure and are protected by intellectual property laws. Except as expressly permitted in your license agreement or allowed by law, you may not use, copy, reproduce, translate, broadcast, modify, license, transmit, distribute, exhibit, perform, publish, or display any part, in any form, or by any means. Reverse engineering, disassembly, or decompilation of this software, unless required by law for interoperability, is prohibited.
The information contained herein is subject to change without notice and is not warranted to be error-free. If you find any errors, please report them to us in writing.
If this software or related documentation is delivered to the U.S. Government or anyone licensing it on behalf of the U.S. Government, the following notice is applicable:
U.S. GOVERNMENT RIGHTS Programs, software, databases, and related documentation and technical data delivered to U.S. Government customers are "commercial computer software" or "commercial technical data" pursuant to the applicable Federal Acquisition Regulation and agency-specific supplemental regulations. As such, the use, duplication, disclosure, modification, and adaptation shall be subject to the restrictions and license terms set forth in the applicable Government contract, and, to the extent applicable by the terms of the Government contract, the additional rights set forth in FAR 52.227-19, Commercial Computer Software License (December 2007). Oracle USA, Inc., 500 Oracle Parkway, Redwood City, CA 94065.
This software is developed for general use in a variety of information management applications. It is not developed or intended for use in any inherently dangerous applications, including applications which may create a risk of personal injury. If you use this software in dangerous applications, then you shall be responsible to take all appropriate fail-safe, backup, redundancy, and other measures to ensure the safe use of this software. Oracle Corporation and its affiliates disclaim any liability for any damages caused by use of this software in dangerous applications.
Oracle is a registered trademark of Oracle Corporation and/or its affiliates. Other names may be trademarks of their respective owners.
Contents
Preface
... ixIntended Audience... ix
Documentation Accessibility ... ix
Oracle BI Discoverer Keyboard Navigation ... x
Related Documents ... x
Conventions ... x
Prerequisites to run Discoverer Desktop ... x
Part I
Getting Started
1
Discoverer Desktop Overview
1.1 What is Oracle Business Intelligence Discoverer?... 1-1 1.2 New Discoverer Desktop Features... 1-3 1.3 How Discoverer Desktop Works ... 1-3 1.3.1 What is a Business Area? ... 1-5 1.3.2 Understanding Workbooks and Worksheets ... 1-5 1.3.3 About Worksheets and Queries... 1-6 1.4 Opening a Workbook ... 1-6 1.4.1 Opening Another Workbook ... 1-10 1.4.2 Opening Workbooks in a Non-Oracle Database... 1-12 1.4.3 Looking at a Workbook’s Properties ... 1-12 1.4.4 Switching to Another Worksheet ... 1-13 1.5 Saving a Workbook... 1-14 1.5.1 Deleting a Workbook ... 1-15
2
What You See on the Screen
2.5.3 Formatting Headings, Data, and Titles ... 2-14
3
Presenting Data on a Graph
3.1 The Features of a Graph... 3-1 3.3.2 Displaying the Graph Legend and X Labels... 3-8 3.3.3 Resizing the Window and Graph ... 3-9 3.3.4 Reference Lines and Pull-outs on a Graph... 3-10 3.3.5 Rotating Graphs ... 3-11 3.3.6 Changing the Graph’s Colors and Patterns ... 3-13
Part II
Working with Discoverer Desktop
4
Pivoting, Drilling, and Sorting Data
4.1 Pivoting Data ... 4-1 4.1.1 Pivoting for Comparison and Analysis ... 4-1 4.1.2 Pivoting Data on a Table... 4-3 4.1.3 Pivoting Data on a Crosstab... 4-5 4.1.4 Duplicating Tables and Crosstabs... 4-7 4.2 Drilling Into and Out of Data... 4-8 4.2.1 Drilling down using the Drill icon ... 4-9 4.2.2 Drilling out using the Drill icon ... 4-10 4.2.3 Drill examples ... 4-12 4.2.4 Quick Drilling by Double-Clicking ... 4-17 4.2.5 Drilling with the Drill Dialog Box ... 4-18 4.3 Sorting Data ... 4-21 4.3.1 Sorting Data on Tables ... 4-21 4.3.2 Sorting Data on Crosstabs ... 4-27
5
Working with Discoverer Desktop
5.2 Finding Exceptions to Data ... 5-5 5.2.1 Creating a New Exception... 5-6 5.2.2 Editing an Exception ... 5-9 5.3 Totaling Numeric Data... 5-10 5.3.1 Creating a New Totals Definition... 5-12 5.3.2 Totals and Calculations ... 5-16 5.3.3 Editing a Totals Definition ... 5-16 5.4 Using Percentages... 5-17 5.4.1 Using the Percentages Tool ... 5-18 5.4.2 Creating a New Percentages Definition ... 5-20 5.4.3 Editing a Percentage Definition... 5-23 5.5 Finding Data that Meets Conditions ... 5-23 5.5.1 Creating Conditions ... 5-25 5.5.2 Editing and Removing Condition Expressions ... 5-29
6
Reporting Results
6.1 Preparing Reports for Printing ... 6-1 6.1.1 Selecting Print Options ... 6-2 6.1.2 Previewing a Report ... 6-6 6.2 Sending Reports with E-Mail Messages ... 6-7 6.3 Exporting to Other Applications ... 6-9 6.3.1 Exporting to Oracle Reports... 6-9 6.3.2 Exporting to Microsoft Excel... 6-11 6.4 Producing Scheduled Reports... 6-12 6.4.1 Seeing the Results of a Scheduled Report ... 6-14 6.4.2 Working with the Scheduling Manager ... 6-16 6.5 Sharing Workbooks ... 6-18
7
Building Worksheets and Workbooks
8.1 Retrieving All Rows and Counting the Number of Rows ... 8-1 8.1.1 Refreshing the Worksheet ... 8-2 8.2 Creating Parameters ... 8-2 8.2.1 Loading Multiple Values ... 8-5 8.3 Creating Calculations ... 8-6 8.4 Creating Advanced Conditions ... 8-10 8.4.1 Creating Subqueries ... 8-12 8.4.2 Editing a Subquery ... 8-14 8.5 Setting Options ... 8-15 8.6 Using Command-Line Options... 8-16 8.7 Using SQL ... 8-17 8.7.1 Looking at the SQL Statements for Worksheets... 8-17 8.7.2 Importing SQL... 8-17 8.7.3 Using the Discoverer Execution Plan... 8-18 8.7.4 Looking at an SQL Execution Plan... 8-18 8.7.5 Viewing the SQL and Execution Plan with an Oracle Enterprise Edition database 8-19 8.7.6 Configuring the SQL type used ... 8-21 8.7.7 Exporting SQL without running a Workbook... 8-22
A
Calculation Examples
A.1 Getting More Information ... A-1 A.2 About the examples in this chapter... A-1 A.3 Additional formatting ... A-1 A.4 Simple Calculation Examples... A-1 A.4.1 Calculate the number of rows returned by a query... A-2 A.4.2 Calculate a 25% increase in sales ... A-2 A.4.3 Convert text to upper-case ... A-3 A.5 Analytic Function Examples ... A-3 A.5.1 Analytic Function Categories... A-3 A.5.2 Calculations and Drilling Into and out of data ... A-4 A.5.3 About The Analytic Function Template... A-4 A.5.4 Ranking Function Examples ... A-4 A.5.5 Banding Function Examples ... A-7 A.5.6 Windowing Function Examples ... A-10 A.5.7 Reporting Function Examples... A-12 A.5.8 Lag/Lead Function Examples ... A-14 A.5.9 Statistical Function Examples ... A-16 A.6 More about the Analytic Function Template... A-17 A.7 Analytic Functions and Sequencing... A-17
B
Oracle Applications Support
B.3.2 Connecting to Discoverer Desktop as an Oracle Applications User... B-2 B.3.3 Configuring the Oracle Applications user Connect dialog ... B-3 B.3.4 Configuring Discoverer Desktop to use standard EULs ... B-4 B.3.5 Connection Configuration ... B-5
Glossary
Preface
Welcome to Oracle Business Intelligence Discoverer Desktop! This guide explains how to use the Discoverer Desktop ad hoc query and analysis interface for business use.
Intended Audience
This guide is designed for business professionals who want to view, analyze, and manipulate data using Discoverer Desktop. You may want to have Discoverer Desktop running on your computer while reading this guide, so you can follow the step-by-step explanations. If your Discoverer manager at your organization has not created a business area or workbook, you can use the sample database included with Discoverer Desktop.
Documentation Accessibility
Our goal is to make Oracle products, services, and supporting documentation accessible to all users, including users that are disabled. To that end, our
documentation includes features that make information available to users of assistive technology. This documentation is available in HTML format, and contains markup to facilitate access by the disabled community. Accessibility standards will continue to evolve over time, and Oracle is actively engaged with other market-leading
technology vendors to address technical obstacles so that our documentation can be accessible to all of our customers. For more information, visit the Oracle Accessibility Program Web site at http://www.oracle.com/accessibility/.
Accessibility of Code Examples in Documentation
Screen readers may not always correctly read the code examples in this document. The conventions for writing code require that closing braces should appear on an
otherwise empty line; however, some screen readers may not always read a line of text that consists solely of a bracket or brace.
Oracle BI Discoverer Keyboard Navigation
Oracle BI Discoverer supports standard keyboard navigation. Standard keyboard navigation includes the use of the tab key, mnemonics (using the Alt key and the underlined character), and accelerators (such as Alt+F4 to exit a window).
Related Documents
You can access the documents referenced in this guide, and other information about Oracle Business Intelligence (e.g. whitepapers, best practices, documentation updates, other collateral) on Oracle Technology Network at:
http://www.oracle.com/technology
Conventions
The following text conventions are used in this document:
Prerequisites to run Discoverer Desktop
To run Discoverer Desktop, a Discoverer End User Layer must already exist. Your Discoverer manager must have created or upgraded the End User Layer using Oracle Business Intelligence Discoverer Administrator (which is shipped as a component of Oracle Developer Suite).
Convention Meaning
boldface Boldface type indicates graphical user interface elements associated with an action, or terms defined in text or the glossary.
italic Italic type indicates book titles, emphasis, or placeholder variables for which you supply particular values.
monospace Monospace type indicates commands within a paragraph, URLs, code in examples, text that appears on the screen, or text that you enter. < > Angle brackets enclose user-supplied names or values.
[] Square brackets enclose optional clauses from which you can choose one or none.
Menu name | Command
Part I
1
1
Discoverer Desktop Overview
This chapter explains the basic concepts of Oracle Business Intelligence Discoverer Desktop. Being familiar with these concepts will help you work more effectively with Discoverer.
The topics covered in this chapter include:
■ What is Oracle Business Intelligence Discoverer? ■ New Discoverer Desktop Features
■ How Discoverer Desktop Works ■ Opening a Workbook
■ Saving a Workbook
1.1 What is Oracle Business Intelligence Discoverer?
Oracle Business Intelligence Discoverer is an intuitive ad-hoc query, reporting, analysis, and Web publishing toolset that gives business users immediate access to information in databases.
Oracle Business Intelligence Discoverer enables business users at all levels of the organization to make faster and more informed business decisions. Using any standard Web browser, you have secure and immediate access to data from both relational and multidimensional data sources. Oracle Business Intelligence Discoverer provides a business view to hide the complexity of the underlying data structures, enabling you to focus on solving business problems.
Figure 1–1 Oracle Discoverer components
Which Oracle Business Intelligence Discoverer component you use will depend on what you want to do. For example:
■ if you want to create new worksheets and analyze data from both relational and
multi-dimensional data sources across the Web, you will use Discoverer Plus (Relational and OLAP)
■ if you want to create new worksheets and analyze data from relational data
sources using a Windows application on a PC, you will use Discoverer Desktop
■ if you want to analyze data in existing worksheets, you will use Discoverer Viewer
or Discoverer portlets (that have been added to an Oracle Portal page or Oracle WebCenter Spaces, using Discoverer Portlet Provider)
■ if you want to obtain Discoverer connections, workbooks, worksheets, and execute
queries in Oracle BI Publisher, or from a Java client application using the SOAP protocol, you will use Discoverer Web Services
■ if you want to display Discoverer worksheets as gauges in dashboard-style
portals, you will use Discoverer Portlet Provider and Discoverer portlets
■ if you want to manage the end user view of relational data, you will use
Discoverer Administrator
The Oracle Business Intelligence Discoverer components use definitions of Discoverer objects stored in the Discoverer End User Layer or the Discoverer Catalog.
How Discoverer Desktop Works
1.2 New Discoverer Desktop Features
No new features have been added to Discoverer Desktop in this release. Where necessary, changes to the product have been made for compatibility reasons (for example, to integrate with new versions of other Oracle products).
1.3 How Discoverer Desktop Works
Oracle Business Intelligence Discoverer Desktop is a data access tool. You use it to view the information in your company’s databases. The whole purpose of Discoverer Desktop is to help you—the business professional—view the data you want from a database, analyze it to support your business decisions, and create reports to keep track of things.
Figure 1–2 Oracle Discoverer Desktop
Discoverer Desktop solves many of the problems normally associated with databases so that now you can easily:
■ Find data that you know is in the database.
■ See data displayed quickly without waiting for the computer to spend a long time
searching through the entire database.
■ View data in a familiar format that is easy to read and understand.
■ Analyze data using a wide array of techniques including drilling up and down
through the data’s details, finding data that meets certain conditions or that falls within ranges you specify, sorting data, comparing results from “what if”
The following two figures compare the old fashioned, data access methods with the new Discoverer Desktop methods.
Figure 1–3 The Old-Fashioned Method of Data Access
How Discoverer Desktop Works
1.3.1 What is a Business Area?
A business area is a logical grouping of database tables or views that apply to your specific data requirements. For example, the accounting department wants data about budgets and finance, while project leaders want data specifically about their projects as well as about budgets. Although some of the data you need may be the same (such as the budgets folder as shown in the following figure), the exact combination of tables and views for each department is usually unique. Using Discoverer Administrator, your Database administrator tailors the grouping of data to provide you with the proper access to the precise data needed for analysis, decision support, and presentation of results.
Figure 1–5 Business Areas and Folders
1.3.2 Understanding Workbooks and Worksheets
Think of a workbook as a three-ring binder filled with specific data for specific tasks. The workbook has pages, or worksheets, that contain data for the specific tasks. For example, if the workbook is for sales and profit data, one worksheet in it might be a table listing your profit for sales versus rentals. Another worksheet might be a comparison of your profit over the last two years by sales region.
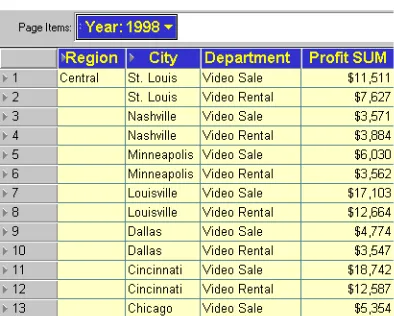
The sample database that you receive with Discoverer contains data from a fictitious video store business. The sample data covers many topics including:
■ Sales Region ■ Year
Figure 1–6 Sample Worksheets
Key to Figure 1–6:
a. These two worksheets are from the same workbook. They are both designed for analyzing profit.
b. This worksheet is a table. It lists the data in a familiar tabular format.
c. This worksheet is a crosstab. It shows the data in a more aggregate form that is usually better for data analysis than tables.
1.3.3 About Worksheets and Queries
A query is simply a search of the database that finds and retrieves the data you want. Each worksheet in a workbook contains the result of a query. So, when you see the term “query” while working with Discoverer Desktop, you can think of it as a worksheet with retrieved data.
1.4 Opening a Workbook
Your Database Administrator usually supplies the various passwords and server access instructions to log on to Discoverer Desktop and open a workbook. The following steps explain the basic process.
To open a workbook:
1. From the Windows Start menu, choose Programs | Oracle Business Intelligence Tools - <HOME_NAME> | Discoverer Desktop.
The Connect to Discoverer Desktop dialog appears (Figure 1–7). Your user name should already be in the Username box. If not enter it in the Username box.
Opening a Workbook
Figure 1–7 Connect to Oracle Discoverer
2. In the Password box, enter your password.
Passwords are case-sensitive in Oracle databases (Enterprise Edition version 11.1 or later).
3. In the Connect box, enter the name of the database that you wish to use.
See your Database Administrator for password and database name details.
4. Click Connect.
The first screen of the Workbook Wizard appears. The wizard steps you through the process to get the specific data you want to see.
Figure 1–8 The Workbook Wizard
Open an existing workbook—shows options for opening one of your existing workbooks.
5. Click Open an Existing Workbook. The next Workbook Wizard dialog box shows options for opening your existing workbooks:
Figure 1–9 Opening an Existing Workbook
My Computer—opens a dialog box for selecting a workbook stored on your local computer or on a server on your business network.
Database—opens a dialog box for selecting a workbook stored as part of a specific database. The workbook can be shared easily with others who have access to the database.
Scheduling Manager—displays a list of workbooks previously scheduled to run at a certain times (usually overnight, on a weekend, or at some periodic interval). Scheduled workbooks run automatically and are available when you need to open them.
Recently Used List—shows the workbooks you’ve previously opened (see
Figure 1–10 for an example). If you usually work with the same workbooks on a daily basis, this option is the quickest way to open a workbook.
Figure 1–10 A Most Recently User Workbook List
If you choose My Computer from the Where is the workbook you want to open?
Opening a Workbook
Figure 1–11 Select a Workbook to Open
6. Select the workbook name and click Open, or just double-click the name.
A dialog box asks if you want to run the query for the worksheet.
Figure 1–12 Run the Query Confirmation
A query causes Discoverer Desktop to find the most recent data to fill in the worksheet. Normally you click Yes because you want to see the most recent data associated with the sheet. Click No if you don’t want to see the data in the
worksheet. For example, click No if you want to create a new worksheet and don’t need to see the data on the existing worksheet. See Chapter 7, "Building
Worksheets and Workbooks" for details to create a new worksheet.
7. Discoverer Desktop now evaluates the query to determine how much time it will take to open the workbook and shows you an estimate. Click Yes to see the data.
Figure 1–14 A Discoverer Workbook
1.4.1 Opening Another Workbook
You can open several workbooks at a time and switch back and forth between them. This is an excellent way to compare data to find specific analytical results.
When several workbooks are open at the same time, use the Window menu to switch between them:
Figure 1–15 Window Menu
To open another workbook:
1. Choose File | Open.
Opening a Workbook
Figure 1–16 Open Workbook Dialog Box
2. Click one of the options.
A dialog box for the selected Open Workbook type appears.
Figure 1–17 Selecting a Workbook from My Computer
3. Select a workbook and click Open.
If the workbook you select is stored in another database account, a dialog box appears for you to open the new workbook.
1.4.2 Opening Workbooks in a Non-Oracle Database
If your business uses other, non-Oracle databases your Database Administrator can set up Discoverer to open workbooks in those databases. You can then use the features of Discoverer Desktop to access the data. However, depending on the type of database, you may not be able to use all the data access and analysis features available with Oracle databases
The basic process to open workbooks in the other, non-Oracle databases is essentially the same as opening a workbook in an Oracle database. Please see your Database Administrator for the correct steps to open the workbooks.
1.4.3 Looking at a Workbook’s Properties
A workbook’s properties provide basic information about the workbook. To see a workbook’s properties:
1. Open the workbook.
2. Choose File | Manage Workbooks | Properties.
The Workbook Properties dialog box appears showing information about the Workbook. You can record additional information about the workbook in the
Description box.
Figure 1–19 Workbook Properties Dialog Box
Note: Identifiers are unique names that Discoverer uses to identify EUL and Workbook elements, (e.g. Business Areas, Folders, Items etc). The default Identifier value is generated automatically by Discoverer.
Do not change Identifiers except under the following circumstances:
■ The Identifier must be changed to comply with strict naming
conventions.
■ An element has been deleted and needs to be recreated with the
same Identifier.
Opening a Workbook
3. Click OK.
1.4.4 Switching to Another Worksheet
The tabs on the bottom of the workbook window show the various worksheets in the workbook. Clicking a tab switches to the next worksheet.
The following figure shows only two tabs, but your workbook may have several worksheets—hence, more tabs.
Figure 1–20 Switch to Another Worksheet
Key to Figure 1–20:
a. Tab scroll buttons.
b. Click these tabs to switch to another sheet in the workbook. This figure shows the worksheet named Tabular Layout is the current worksheet.
To switch to another worksheet:
1. Click the appropriate tab at the bottom of the workbook window. Use the scroll button if necessary to see additional worksheets. You can also use the key combinations Ctrl Pg Up and Ctrl Pg Dn to cycle through the tabs.
2. Click Yes to open the worksheet.
Discoverer Desktop then estimates the time involved for the search and gives you the option to open the worksheet. Click OK to open the worksheet.
If you decide not to open a worksheet and click Cancel, but then later click on the worksheet tab to open it, this dialog box does not appear. Choose
Sheet | Refresh Sheet to retrieve the data.
1.5 Saving a Workbook
Saving a workbook saves all of its changes. You have two options:
■ To save a workbook, choose File | Save. The changes are saved and the workbook
remains open.
■ To close and save a workbook at the same time, choose File | Close. If you haven’t
made changes to any worksheet in the workbook, it closes.
If the workbook contains any unsaved changes on any worksheet, a dialog box reminds you to save the changes.
Figure 1–22 Save Workbook Reminder
Click Yes to save the changes; click No to close the workbook without saving the changes; click Cancel to keep the workbook open without saving the changes.
To save the workbook under a different name:
1. Choose File | Save As.
A dialog box appears for you to specify where you want to save the renamed workbook.
Figure 1–23 Save Workbook Dialog Box
2. Select an option from the Save Workbook dialog box and click Save.
My Computer - saves the workbook locally on your computer.
Saving a Workbook
■ If you select My Computer, the Save As dialog box appears (Figure 1–24).
Enter a new name and click Save.
■ If you select Database, the Save Workbook to Database dialog box appears and
lists the workbooks already saved to the database (Figure 1–25). Enter a new name for the workbook and click Save.
Figure 1–24 Save As Dialog Box
Figure 1–25 Save Workbook to Database Dialog Box
1.5.1 Deleting a Workbook
Deleting a workbook from the database permanently removes it. You should not delete a workbook from the database unless you are absolutely certain that you won’t need it in the future.
To delete a workbook from the database:
1. Choose File | Manage Workbooks | Delete.
Figure 1–26 Delete Workbook from Database Dialog Box
2. Click the name of the workbook you want to delete, then click Delete.
1.5.1.1 Deleting a Workbook from Your Computer
If you saved a workbook locally on your computer, deleting it removes it from your computer, but not from the database.
2
2
What You See on the Screen
This chapter explains how to use the various items on the screen while you’re working with Discoverer Desktop.
The topics covered in this chapter include:
■ The Workbook Window ■ The Four Types of Display ■ Selecting Sections of a Worksheet ■ Seeing the Next Page of Data ■ Formatting a Worksheet ■ Some Helpful Shortcuts
2.1 The Workbook Window
The workbook window is where you will do most of your work with Discoverer Desktop. It shows the data in the workbook.
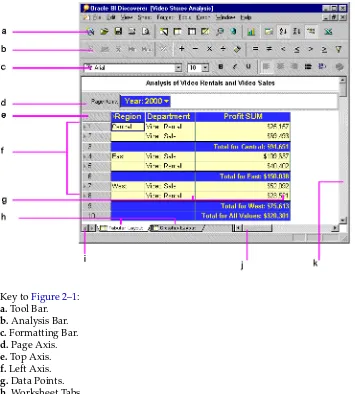
Figure 2–1 The Workbook Window
Key to Figure 2–1:
a. Tool Bar.
b. Analysis Bar.
c. Formatting Bar.
d. Page Axis.
e. Top Axis.
f. Left Axis.
g. Data Points.
h. Worksheet Tabs.
i. Tab Scroll Buttons.
j. Page Scroll Bar (Horizontal).
k. Page Scroll Bar (Vertical).
Tool Bar - Buttons help you use Discoverer Desktop’s features quickly, for example, opening a new workbook, editing a worksheet, drilling data, or sorting data.
Analysis Bar - Buttons help you analyze data quickly, such as adding two sums together or finding the maximum value in a column.
Formatting Bar - Buttons format a selected item quickly, such as aligning text in a column or changing the font and background color of a column.
Clicking a button on these bars runs that button’s function. The functions controlled by these buttons are also available from the menus. Note that button availability depends on the type of selected item. For example, if you select a text item, the Average button is not available because it doesn’t make sense to find the average of text.
The Four Types of Display
Figure 2–2 Tool Tips and Status Bar
Key to Figure 2–2:
a. When a pointer is on a button, the button enlarges and displays its tool tip, (Conditions in this example).
b. The status bar also explains what tools are used for.
Axis Items - The page axis, top axis, and left axis on the workbook window represent the data in your database that have a relatively few, discrete values associated with them.
Typical axis items are Sales Regions, Cities, Year, Company Department, Product Name, Salesperson Name, and so on. Sales Region, for example, usually has only a few values associated with it: North, South, Central, West.
Axis items represent data that you can pivot on a crosstab worksheet or that can be column headings on a table. Another way of thinking about axis items is that they are the items that would appear on the axes of a graph. When creating a new worksheet, you identify the data that become axis items.
Data Points - The data points of a table or crosstab are the data in the “body” of the worksheet. Data points are the data that you want to use for analysis purposes or to see listed on a table. On a crosstab worksheet, the data is almost always numerical, such as monthly profits or sales amounts by product. Table worksheets, on the other hand, are better for listing text and numeric information. Mailing lists of customers or product part number lists are typical table worksheets.
Worksheet Tabs - Click to open or view the various worksheets in the workbook. If you’ve already opened the worksheet, it appears right away. If you haven’t opened the worksheet yet, Discoverer Desktop gets it from the business area and then displays it. You can rename these tabs.
Tab Scroll Buttons - Click to scroll through the worksheet tabs in the workbook, then click on the tab of the worksheet you want to see.
Page Scroll Bars - If the worksheet is larger than the screen, it extends off the edges of the screen. Click the scroll bars to see the rest of the worksheet.
2.2 The Four Types of Display
customer name, lists of income or profit from various departments, lists of products sorted by part number or part name, and so on.
Here is a sample of a table layout on the workbook window. As you can see, it is essentially a listing of data.
Figure 2–3 Table Layout
2.2.1.1 Table Layout with Page Details
A table layout with page details is a table with multiple pages of data, where each page shows various portions of the data in detail. You set the criteria for displaying portions of data in order to see exactly what you want on each page. Usually you use this type of layout to study data details in a specific, recurring way. For example, in the Video Store data you may always want to see monthly profits per region. In that case, each page would show one region’s profits each month.
Figure 2–4 Table Layout with Page Items
2.2.2 Crosstab Layout
A crosstab, short for cross-tabulation, relates two different sets of data and summarizes their interrelationship in terms of a third set of data. For example, a typical crosstab for a chain of retail business stores might show the monthly total sales by products by store. In other words, there are three sets of original data: each store name, product type, and total sales amounts. The store name and product type are axes of the crosstab as rows and columns. Each row and column intersection shows the data points, in this case the total sales for a store and product type.
Selecting Sections of a Worksheet
dimensions of data on the various axes. A crosstab layout has three axes: side axis, top axis and page axis. Because each axis can hold several data items, a crosstab can display many dimensions of data.
For example, the following figure is a sample crosstab that shows five dimensions of data: regions and city names, year, department (video rentals and video sales) and the total profit. In this example, the data points (that is, the intersections, or cells on the crosstab) are the sums for total profit. The next page of data would show the same type of data, except for the next department, which is Video Sale.
Figure 2–5 Crosstab Layout with Page Items
Key to Figure 2–5:
a. Page Axis. In this sample it contains a single data item—Department.
b. Top Axis. This top axis contains two data items—Year and Profit.
c. Side Axis. This side axis also contains two data items—Region and City.
2.2.2.1 Page Detail Crosstab Layout
A page detail crosstab layout is a crosstab with multiple pages of data, so you can group the data on separate pages. You set the criteria for displaying portions of data in order to see exactly what you want on each page, (see Figure 2–5).
2.2.2.2 A Note About Crosstabs
One of the most powerful features of crosstabs is that they can uncover subtleties in the data that are not readily apparent from a table of data or from the raw data itself. By relating one group of data to another, for example, you might find that your best salesperson in terms of volume isn’t the best in terms of efficiency (sales calls versus deals closed). Or that the return on investment at one store may be higher in a percentage sense than at another store that posts a higher profit.
A word of caution—used incorrectly, crosstabs can show relationships between two sets of numbers when, in fact, there is no meaningful correlation between them at all. For example, it is a well-known observation that the rise and fall of stock prices on the New York Stock Exchange seems to correlate with the length of women’s
By selecting sections on a worksheet you can assign various features to the sections. For example, to boldface the data in a column, you select any cell that column first.
Hint: You can select several portions of a worksheet at a time by holding down the Shift key while clicking (Shift-click).
To select a cell, click the cell. The outline box around the cell indicates it is selected.
Figure 2–6 Select a Cell
Key to Figure 2–6:
a. Click a cell to select it.
To select a row, click the row number or row marker (Figure 2–8). You can also click the cells at the beginning or the end of the row and drag the pointer across the rest of the cells in the row.
Highlighting indicates all the cells in the row are selected. Notice that the first cell is outlined, consistent with selecting on a spreadsheet.
Figure 2–7 Select a Row on a Table
Key to Figure 2–7:
a. Click the row number to select the entire row.
Figure 2–8 Select a Row on a Crosstab
Key to Figure 2–8:
Selecting Sections of a Worksheet
To select a column, click the column heading on a table (Figure 2–9) or the column marker on a crosstab (Figure 2–10). You can also click on the cells at the top or bottom of the row and drag the pointer down over the rest of the cells in the column.
Highlighting indicates all the cells in the column are selected. As in a selected row, the first selected cell on the table or crosstab is outlined instead of highlighted.
Figure 2–9 Select a Column on a Table
Key to Figure 2–9:
a. Click the column heading on a table to select the entire column.
Figure 2–10 Select a Column on a Crosstab
Key to Figure 2–10:
a. Click the column marker to select the entire column.
To select all the cells in the entire worksheet:
■ On a table, click the box at the top of the row numbers (Figure 2–11).
■ On a crosstab, click the small box at the top corner of the rows and columns
(Figure 2–12).
Figure 2–12 Select All the Cells in a Crosstab
Key to Figure 2–12:
a. Click this box to select all the cells in the crosstab.
To select a single axis item, click the axis item. The item is highlighted.
Figure 2–13 Select a Single Axis Item
Key to Figure 2–13:
a. Click an axis item to select it.
To select all the items at one level on an axis, click an axis item marker. These markers are either horizontal or vertical depending on the axis where the item is located. See
Section 2.3.1, "About the Axis Item Markers" for more about item markers.
Figure 2–14 Axis Item Markers
Key to Figure 2–14:
a. On the top axis or side axis of a crosstabs the markers are horizontal or vertical.
Selecting Sections of a Worksheet
Figure 2–15 Select All Items at One Level on an Axis
Key to Figure 2–15:
a. Click an axis marker to select all the items at that level on the axis.
In this sample, clicking this marker selects all the City names on the Left Axis but not the Region names because they are at a different level on the axis.
b. To select the Region names you would click this marker.
2.3.1 About the Axis Item Markers
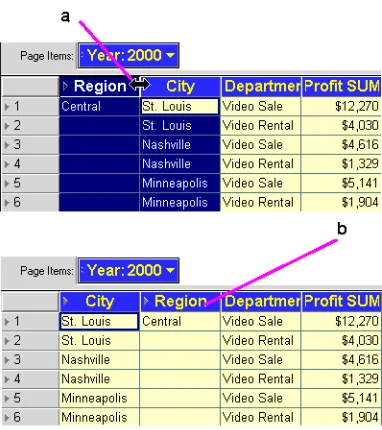
An axis item marker pertains to one level of data on the axis. For example, Region is at a higher level than Cities (because the Regions contain the Cities). When you click an axis item marker it selects all the items at that level.
Tables and crosstabs can have several axis item markers. Items on the side axis have their axis markers at the top of the axis. Items on the top axis or page axis have their markers to the left of the item. The number of markers on a crosstab indicates how many levels of items in the axes (which is another way of saying how many “dimensions” of data the crosstabs displays).
Figure 2–16 Axis Item Marker Examples
a. Axis Item Markers.
b. Note that this side axis has two item markers for the two data items on that axis—Region and City.
2.3.2 Selecting Axis Item Markers
When you put the pointer on an axis item, it changes to an arrow, indicating the marker is selected. On a crosstab, a small note shows you the name of the data item for the selected marker. Typically you use an axis marker to pivot data from one axis to another. See Section 4.1, "Pivoting Data" for details about pivoting.
Figure 2–17 Pointers on the Axis Item Markers
Key to Figure 2–17:
a. Depending on the location of the axis item marker, the pointer changes to an arrow pointing up, down, or sideways.
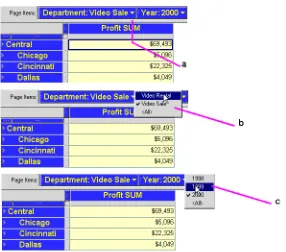
2.4 Seeing the Next Page of Data
When the page axis contains data, the table or crosstab displays one page of data at a time. A page displays all of the data for a particular data item, such as the profits from Video Rentals for 1996.
To see another page of data on a table or crosstab:
1. Click the down arrow next to the data you want to see.
Figure 2–18 The Down Arrow on Page Axis Items
Seeing the Next Page of Data
a. Click the down arrow to select the next page of data for the particular data item. A drop-down list appears showing the pages available for that data item. A checkmark indicates the current page being displayed on the table or crosstab.
2. Select the page that you want to see next from the drop-down menu.
In the following figure, the page axis has two data items—Department and Calendar Year. The Calendar Year data covers 1998, 1999, and 2000; the Department data has two departments—Video Sale and Video Rental. Therefore, in combination, the crosstab has a total of six pages of data:
1. 1998 Video Sale 2. 1999 Video Sale 3. 2000 Video Sale 4. 1998 Video Rental 5. 1999 Video Rental 6. 2000 Video Rental
Figure 2–19 See the Next Page of Data
c. To see data for other Calendar Years, click the down arrow in the Calendar Years item. Then choose a Year from the list. You can now compare Profit revenues for different years.
2.5 Formatting a Worksheet
Part of a Database Administrator’s responsibility when designing workbooks is to format each worksheet. Text fonts, background colors, column names, and so forth are all part of the default format set up by the Database Administrator. However, you can reformat a worksheet. The following sections describe how to do this.
2.5.1 Rearranging the Columns on Tables
On a table you can move columns from left to right. You can also move columns from the body of a table to the page axis. This is known as pivoting (see Section 4.1, "Pivoting Data" for more information).
To move a table column to the left or right:
1. Select the column heading of the column to move.
The pointer changes to a double-headed line indicating you can move the column to the left and right.
2. Drag the column in the direction you want to move it.
3. Release the mouse button when you reach the new position.
Hint: To make the selected column the first or last one in the table, drag the pointer to the leftmost or rightmost column. See Figure 2–20 for an example.
Figure 2–20 Move a Column Left or Right on a Table
Key to Figure 2–20:
a. Select a column and move the cursor to the right.
Formatting a Worksheet
2.5.2 Resizing Columns
You can enlarge or reduce the size of each column by dragging the column’s right-hand edge to the right or left.
Dragging the column edges is relatively imprecise, but is quick and usually sufficient for working on the screen. If you want to resize columns precisely (for example, for printing purposes or to create a report), use the Format menu.
To resize a column by dragging its edge:
1. Put the pointer on the right-hand edge of the column header. The pointer changes to a resize pointer.
2. Hold down the mouse button and drag to the right or left.
Figure 2–21 Resize a Column
Key to Figure 2–21:
a. Drag the resize pointer to the left or right to change the width column width.
b. The Department column has been resized to display the whole Department names.
When decreasing the size of a column that contains text data, click the Text Wrap button. This ensures that text too long to fit on one line in the new column width, will be displayed with multiple lines so all text remains visible. See Section 2.5.3.2,
"Reformatting a Column Heading on a Table" for the steps to make a column wrap its text.
Note: Text in the column heading does not wrap, even if Text Wrap button is clicked.
To resize columns with the Format menu:
1. Select the column(s) to resize.
2. Choose Format | Columns | Width.
The Column Width dialog box appears.
Hint: You can also resize selected columns using the Format | Columns | Auto Size
command. The columns automatically resize to fit their data and column headings. Double-clicking on the right edge of a column header also auto-sizes the column.
2.5.3 Formatting Headings, Data, and Titles
You can edit the format and text of column headings and page items.
The steps to reformat column headings are slightly different for tables and crosstabs as explained in the following sections.
2.5.3.1 Editing Column Header Text
You use the Item Properties dialog box to edit the text of column headings.
To edit column header text:
1. Select the column header, page item, or item handle.
2. Choose Edit | Item Properties.
To use the right mouse button pop up menu, double-click on a column header or click on the column header, page item, or item handle in a crosstab. Then choose Item Properties from the menu.
The Item Properties dialog box appears.
3. Enter a new heading and click OK.
2.5.3.2 Reformatting a Column Heading on a Table
To reformat column headings on a table:1. Select the column heading. To change the formats of several columns at the same time, Shift-click or Ctrl-click to select them.
Note: Do not use the tools on the formatting bar to format column headings on tables. Selecting a column heading and clicking a button on the formatting bar is how you reformat the data in the table.
2. Choose Format | Headings.
The Format Heading dialog box appears.
Figure 2–23 Format Heading Dialog Box
Formatting a Worksheet
a. Click these tabs to display the various formatting options.
3. Click the tabs across the top of the dialog box and select the options for reformatting the heading(s).
Font—Select the font, style, size, and color for the column heading text. In the example above, the text is Arial, Bold, 11 point and yellow. Click a color on the color palette to set the text to that color.
Alignment—Select the options to align the text in the column heading in both the horizontal and vertical directions. The example above shows text that is both left and top aligned. The horizontal alignment option Wrap Text means a column heading automatically extends to the next line, in case the text is too long to fit on a single line.
Background Color—Click a color for the column heading background. Usually you’ll want contrasting colors such as yellow text on a blue background.
4. Click Apply to apply the new formats so you can see how they look.
5. Click OK when you’re finished.
2.5.3.3 Reformatting a Column Heading on a Crosstab
When formatting a column heading on a crosstab, all of the headings at the same level will also be reformatted because a column heading represents the same data. For example, Year:1995 and Year:1996 both represent the data item, Year. You cannot reformat a single column heading on a crosstab if there are other columns at the same level.
To reformat a column heading on a crosstab:
1. Select a column heading. All column headings at that level receive the formatting.
2. Choose Format | Headings and now format the headings the same way you do for a table (see Section 2.5.3.2, "Reformatting a Column Heading on a Table").
Note: Unlike tables, you can use the formatting buttons on the formatting bar to reformat column heading on crosstabs. For example, to change the format of the Year columns on the sample crosstab, select either Year column, click a formatting button, and the both columns are reformatted. Figure 2–1 shows the formatting bar.
To reformat all of the data in a table at the same time, select the entire table or any row in the table. Page items will not be formatted unless you select them.
2. Choose Format | Data and select options from the Format Data dialog box.
To reformat data in a crosstab:
1. Select a column heading or any cell in the column. You can also Shift-click to reformat the data in multiple columns.
To reformat all of the data in a crosstab at the same time, select the entire crosstab. Page items will not be formatted unless you select them.
2. Choose Format | Data and select options from the Format Data dialog box.
As you select the table or crosstab formatting options, a sample shows the format, including number of decimal places. Click Apply to apply the new formatting, and click OK when you’re finished.
2.5.3.5 Adding Bars to Numeric Data
You can add graphic bars to numeric data in tables or crosstabs to provide a quick visual comparison of the relative amounts displayed. Here is an example:
Figure 2–24 Graphic Bars Added to Numeric Data
Key to Figure 2–24:
a. The graphic bars added to the Profit SUM column show the amount visually as a colored bar. The larger the amount, the larger the graphic bar.
To add graphic bars to numbers:
1. Select a column heading with numeric data, or any cell in the column.
2. Choose Format | Data.
3. Click the Number tab on the Format Data dialog box.
4. Click the checkbox labelled Show Graphic Bars.
Figure 2–25 Show Graphic Bars
Key to Figure 2–25:
Formatting a Worksheet
5. Click OK. The graphic bars are added to the table or crosstab.
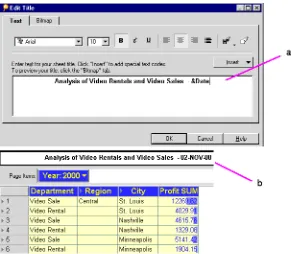
2.5.4 Formatting a Worksheet Title
The worksheet title is at the top of the worksheet:
Figure 2–26 Worksheet Title
Key to Figure 2–26:
a. Worksheet Title.
You can edit all aspects of the title, including the name, text, color, style, and so on.
A special editing feature lets you insert text codes that automatically add certain types of data to the title. These text codes are particularly helpful when printing a
worksheet. For more information, see Section 2.5.4.1, "Adding Text Variables to Titles".
Discoverer Desktop also has a special function so you can put a bitmap image in the title. For example, your company logo as the background for the worksheet title is useful when printing copies of worksheets for external distribution. For more information, see Section 2.5.4.2, "Adding Bitmaps to Titles".
To reformat a worksheet title:
1. Choose Sheet | Edit Title.
The Edit Title dialog box appears:
Note: As you select options, the sample in the dialog box changes to show the effects of your choices.
4. Click OK when the formatting is complete.
You can also edit formats of a title by choosing Format | Sheet | Title and selecting options from the Format Title dialog box. Those options are the same as shown in
Figure 2–23.
To edit the worksheet title:
1. Click in the title where you want to add text, or select a portion of the title to change it.
Figure 2–28 shows a section of text that has been selected:
Figure 2–28 Enter Title Text
Key to Figure 2–28:
a. Selected text.
2. Type the new text.
2.5.4.1 Adding Text Variables to Titles
Text Codes contain Workbook information such as the current date and time, the name of the workbook where the worksheet is located, or the number of pages. Once inserted, they are automatically updated when Workbook details change.
To add text code to the title of the worksheet:
1. Click in the title where you want to add a text variable.
To add it on the next line under the title, put the pointer at the end of the title and press Return.
2. Click the Insert button.
Formatting a Worksheet
Figure 2–29 Edit Title Insert Menu
3. Select the text code from the menu.
The code is added at the pointer location in the title. Note that the text code begins with an ampersand (&); the ampersand is a programming character and does not appear in the title.
Figure 2–30 shows a text code example.
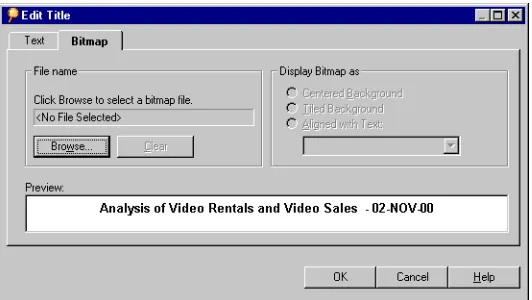
2.5.4.2 Adding Bitmaps to Titles
A bitmap image can be the background of a worksheet title. For example, you can insert a bitmap of your company logo.
To add a bitmap to the title:
1. Choose Sheet | Edit Title.
The Edit Title dialog box appears:
2. Click the Bitmap tab on the Edit Title dialog box.
Figure 2–31 Bitmap Page for Edit Title Dialog Box
3. Click the Browse button.
An Open dialog box appears.
4. Find the bitmap file that you want to use and click Open.
The bitmap appears with the title. For example, in Figure 2–32, the file Disco.bmp has been defined as the bitmap graphic.
Figure 2–32 Bitmap Page with a bitmap graphic (Disco.bmp) file defined
Some Helpful Shortcuts
a. The bitmap file location and filename.
b. Bitmap alignment options.
c. The graphics file Disco.bmp displayed as part of the Worksheet title.
5. Select an option for displaying the bitmap with the title as Centered, Tiled or Aligned with the text.
For a bitmap aligned with the text, choose an alignment option from the drop-down menu.
6. When the bitmap is properly displayed in the title, click OK. The bitmap is added to the title on the worksheet.
Hint: To remove the bitmap and start over, click Clear.
2.5.5 Renaming a Worksheet
A worksheet’s name appears in the worksheet tabs at the lower left of the Workbook windows. See Figure 2–1, "The Workbook Window" as an example.
To rename a worksheet:
1. Choose Sheet | Rename Sheet.
The Rename Sheet dialog box appears and shows the sheet’s current name.
2. Type a new name for the sheet and click OK.
2.6 Some Helpful Shortcuts
In addition to the tool bars and other buttons on the window, Discoverer Desktop has built-in shortcuts to help you work more efficiently.
2.6.1 Right Mouse Support
Clicking the right mouse button when the pointer is on various features of the window produces a pop-up menu with context-sensitive commands specific to that feature. This shortcut helps you choose commands quickly without having to use the menus.
Figure 2–33 shows samples of right-click menus. There are many others for the other Note: Bitmaps are saved in the database along with the
Workbook. If Discoverer Desktop cannot find the original bitmap file, it uses the bitmap stored in the database.
Figure 2–33 Sample Right-Click Menus
Key to Figure 2–33:
a. Right-click menu for the Department page item.
b. Right-click menu for a Profit SUM cell item.
2.6.2 Resizing Windows
Many of Discoverer Desktop’s windows can be resized horizontally or vertically. You may find a more appropriate size better for your particular computer monitor.
To resize a window:
1. Put the pointer on an edge of the window.
The pointer becomes a horizontal or vertical arrow. In Figure 2–34 below, the pointer is horizontal arrow, used to change the width of the dialog box.
Some Helpful Shortcuts
Key to Figure 2–34:
a. Horizontal resize arrow at the edge of the dialog box.
2. Drag the pointer to adjust the width of the dialog box.
When the pointer is on the side edge, drag it to the left or right. When the pointer is on the top or bottom edge, drag it up or down.
3
3
Presenting Data on a Graph
Discoverer Desktop can convert tables and crosstabs to graphs or charts so you can analyze and present data graphically. Graphs and charts of tables and crosstabs are especially effective for presentations of results.
This chapter explains how display data on a graph.
The topics covered in this chapter include:
■ The Features of a Graph ■ Creating a Graph ■ Modifying a Graph
3.1 The Features of a Graph
The following figure shows a table and its resulting graph. This sample shows a bar graph, but several other styles are also available.
To display Worksheet data as a graph:
1. Display the worksheet that you want to see as a graph.
2. Choose Graph | Show or click the Graph button on the worksheet tool bar.
The first time you display a graph, the Graph Wizard walks you through the process of defining the graph’s features. Then, a graphical representation of the worksheet appears in the Graph window.
3. When you are finished working with the graph, click the Close button on Graph window. You can also click the Minimize button on the Graph window.
The graph retains its design features when closed. The next time you open it, the graph has the same appearance.
Figure 3–2 shows the features on a typical graph.
Figure 3–2 Graph Window
Key to Figure 3–1:
a.Tool Bar - click a tool to work with the graph; click a color or pattern and drag it onto the graph to change the data’s color or pattern; click the arrows to scroll the colors and patterns.
b.Y-Axis Scale - shows the scale appropriate for the data in the original table or crosstab; you can reset the scale and add decimal points.
c.Titles - additional labels that you can add to the graph. Four positions for the titles are Top, Left, Right, and Bottom.
d.Top title.
e.Legend - the color and label for data.
f.Data - the graphical representation of the data (in the figure, 3D bars).
3.1.1 The Graph Tool Bar
Creating a Graph
Figure 3–3 The Graph Tool Bar
Key to Figure 3–3:
a. Copy Graph to Clipboard - copies the current graph to the Windows Clipboard.
b.Print - prints the graph to your computer’s printer using the default settings for that printer. If the graph is too large for a single page, prints additional pages as necessary. You can also choose Graph | Print to print the current page with Discoverer
Desktop’s print settings.
c.New Graph Type - displays a drop-down list for choosing a new type of graph.
d.Show/Hide Labels - shows/hides a list of labels that correspond to the row numbers along the graph’s x-axis. You can also choose Graph | X Labels.
e.Show/Hide Legend - shows/hides the graphs legend. You can also choose Graph | Legend.
f.Modify Graph - displays a dialog box for editing and formatting a graph; the options in the dialog box are the same ones offered in the Graph Wizard. You can also choose Graph | Edit Graph.
Figure 3–4 Graph Colors and Patterns
Key to Figure 3–4:
a. Scroll to see additional colors.
b. To change colors, click a color and drag it onto a portion of the graph.
c. Scroll to see additional patterns.
d. To change patterns, click a pattern and drag it onto a portion of the graph.
Note: You can also show or hide the status bar in the Graph window. Choose Graph | Status Bar.
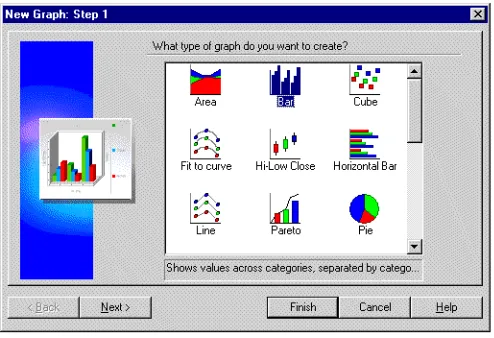
3.2 Creating a Graph
Figure 3–5 New Graph: Step 1
3. Select one of the graph types. Scroll to see additional choices.
To expand the text description at the bottom of the box, put the pointer on the text.
4. Click Next.
Figure 3–6 New Graph: Step 2
5. Select one of the graph formats. Scroll to see additional choices.
Creating a Graph
Figure 3–7 New Graph: Step 3
■ To add titles to the graph, enter them in the appropriate boxes. See Figure 3–2
to see the locations of the titles.
■ To add a legend to the graph, click Show Legend.
■ To format the axes labels, click the formatting button next to each feature to
see the Font dialog box for that element.
Figure 3–8 Font Dialog Box
Select the font choices and click OK. Repeat for the other design elements that you want to format individually.
Figure 3–9 New Graph: Step 4
8. Select options for the data on the graph:
Y-Axis Scale - enter numbers in the Minimum and Maximum boxes to set the upper and lower boundaries of the y-axis; usually the Minimum value is zero. The Maximum value is normally a value higher than the maximum data point value.
Decimals - enter a number for the number of decimal places on the y-axis scale; enter 2, for example, to display the scale numbers as 100.00.
Show Gridlines—click each option to show gridlines on the background of the graph.
Graph Series By—select one or the other option:
■ Column - plots the rows on the x-axis and the data for each row in the graph. ■ Row - plots the columns on the x-axis and the data for each column in the
graph.
9. Click Finish. The Graph window appears with the new graph in it.
3.2.1 Updating the Data on a Graph
You do not have to update a graph manually. As you analyze data on tables and crosstabs, additional data displayed as part of the analysis is automatically added to the graph and appears the next time you display the graph.
For example, if you display a column of percentages for the data, that column’s data becomes data points on the graph. Likewise if you pivot a column to the page axis, the graph is automatically updated to reflect that change.
3.3 Modifying a Graph
To modify a graph:
1. Click the Modify Graph tool on the Graph window’s tool bar or choose Graph | Edit Graph.
■ If you choose Graph | Edit Graph, the first Graph Wizard dialog box for
Modifying a Graph
■ If you click the Modify Graph tool, a dialog box appears for modifying the
graph.
Figure 3–10 Modify Graph Dialog Box
The tabs across the top of the dialog box offer the same features as the Graph Wizard dialog boxes that you initially used to create the graph.
Here the Options tab is selected. Compare the options shown in the figure above with Figure 3–9. You can see that the two provide the same options.
2. Use the Type, Format, Titles and Legends, and Options tabs to change the graph details as required.
3. Click OK.
In addition to modifying the y-axis scale with the Modify Graph dialog box shown above, you can also choose Graph | Scale. The dialog box that appears includes additional options to set the y-axis scale units, plot the scale linearly or
logarithmically, and to set the size of the gap between plotted data points.
3.3.1 Selecting a New Graph Type
To select a new graph type:
1. In the Graph window, click the New Graph Type button on the Graph window tool bar.
Figure 3–11 New Graph Type Drop-Down List
2. Click the new graph type. The graph changes to its new type.
If you do not want to change the graph’s current type, click on the Graph window (off the drop-down list) and the list closes.
Here are samples of two types of graph that plot the same data.
Figure 3–12 A Horizontal Bar Graph
Figure 3–13 A Cube Chart
3.3.2 Displaying the Graph Legend and X Labels
You can show or hide the legend and X labels by clicking the buttons on the tool bar.
To display the legend and X labels:
Modifying a Graph
Note: These buttons and commands are toggles—that is, click a button to show the data; click it again to hide the data.
Here is a sample graph showing both the legend and X labels from the rows on the original table or crosstab.
Figure 3–14 Graph Showing Legend and X Labels
Key to Figure 3–14:
a. Each row in the table is represented on the Bar Graph as a bar.
b. The X labels.
c. The legend corresponds to the rows in the table.
3.3.3 Resizing the Window and Graph
You may need to resize the graph or its window depending on the type of graph and the amount of plotted data. You can resize most portions of the window and graph.
To select the window or graph so you can resize it:
1. Put the pointer on the edge of the window, edge of the graph, or on one of the other resizable sections of the graph. The pointer changes to a resize arrow.
2. Drag the mouse pointer to resize the window or graph.
Figure 3–15 Resizable Sections
Key to Figure 3–15:
a. Drag the edge of the graph itself to enlarge it vertically and horizontally.
b. Drag these lines from side to side or up and down to enlarge the columns so that text can fit.
c. When the pointer is on the edge of the window, drag the edge to resize the window. The other edges are also resizable.
3.3.4 Reference Lines and Pull-outs on a Graph
On most of the graph types, dragging on the graph produces a set of reference lines that you can use to visually correlate the graph’s data points with the vertical and
horizontal scales. On the pie graph and donut graph types, however, dragging pulls sections of the graph out so you can call special attention to them.
Modifying a Graph
Figure 3–16 Sample Pull-Outs on a Pie Graph and Donut Graph
Key to Figure 3–16:
a. You can point at sections of a Pie Chart and drag out sections for emphasis. To replace a section of the Pie Chart, drag it back to its original position.
b. If you change the graph type to a Donut Graph, any pulled out sections remain emphasized. To replace a section of the Donut Graph, drag it back to its original position.
Figure 3–17 Sample Reference Lines on a Bar Graph
1. Choose Graph | 3D View.
A dialog box for rotating the graph appears.
Figure 3–18 3D View Properties Dialog Box
Key to Figure 3–18:
a. Drag these dots around the edge of the sphere rotates the graph in the corresponding x and y direction.
b. These numbers show the amount of rotation in each axis.
c. Drag this slider to rotate the graph in the z-axis plane.
Hint: Before you begin to rotate a graph, write down the X Angle and Y Angle numbers and note the position of the slider so you can return the graph to its unrotated position after experimenting with rotation.
2. Select the options for displaying the graph:
■ 3D - displays the graph with both the X Angle and Y Angle set at 45 degrees;
this is the standard 3D display.
■ Full 3D View - displays the graph based on the positions of the dots and
slider on the dialog box; this option must be selected to drag the dots. Turning off this option returns the graph to the standard 3D display.
■ Shadows - displays shading on the edges of the graph’s features to enhance
the 3D representation.
3. Drag the dots around the x- and y-axis circles.
■ Dragging the x-axis dot rotates the graph from left to right. ■ Dragging the y-axis dot rotates the graph from top to bottom.
As you drag the dots, the reference figure represents the amount of rotational change to the graph. The X Angle and Y Angle numbers also change as you drag the dots.
Hint: You can also enter numbers for the X Angle and Y Angle in the respective boxes. Entering numbers instead of dragging the dots is often a good way to get the exact rotation for a series of graphs.
4. To rotate the graph in the z-axis, drag the slider under the reference figure.
Dragging the slider increases or decreases the amount of depth to the graph.