Extension of Social Security
Report on the workshop
“Mapping existing international social protection
statistics and indicators that would contribute to the
monitoring of social protection extension through social
protection floors”
Geneva, Switzerland, 13
th
-15
th
March 2013
Compiled by
Florence Bonnet
and
Lou Tessier
ESS Working Paper no. 38
Copyright © International Labour Organization 2013
First published 2013
Publications of the International Labour Office enjoy copyright under Protocol 2 of the Universal Copyright
Convention. Nevertheless, short excerpts from them may be reproduced without authorization, on condition that
the source is indicated. For rights of reproduction or translation, application should be made to ILO Publications
(Rights and Permissions), International Labour Office, CH-1211 Geneva 22, Switzerland, or by email:
[email protected]. The International Labour Office welcomes such applications.
Libraries, institutions and other users registered with reproduction rights organizations may make copies in
accordance with the licences issued to them for this purpose. Visit www.ifrro.org to find the reproduction rights
organization in your country.
ILO Cataloguing in Publication Data
Bonnet, Florence and Tessier, Lou
Report on the workshop “Mapping existing international social protection statistics and indicators that would
contribute to the monitoring of social protection extension through Social Protection Floors”, held in Geneva,
Switzerland, March 13th, 14th and 15th, 2013 / Florence Bonnet, Lou Tessier; International Labour Office, Social
Protection Department.- Geneva: ILO, 2013
ix, 85 p.
ESS paper, No. 38; ISSN 1020-9581; 1020-959X
International Labour Office; Mapping existing international social protection statistics and indicators that would
contribute to the monitoring of social protection extension through social protection floors (2013, Switzerland)
social protection / contributions / guaranteed income / data collecting / measurement / methodology
02.03.1
The designations employed in ILO publications, which are in conformity with United Nations practice, and the
presentation of material therein do not imply the expression of any opinion whatsoever on the part of the
International Labour Office concerning the legal status of any country, area or territory or of its authorities, or
concerning the delimitation of its frontiers.
The responsibility for opinions expressed in signed articles, studies and other contributions rests solely with their
authors, and publication does not constitute an endorsement by the International Labour Office of the opinions
expressed in them.
Reference to names of firms and commercial products and processes does not imply their endorsement by the
International Labour Office, and any failure to mention a particular firm, commercial product or process is not a
sign of disapproval.
ILO publications and electronic products can be obtained through major booksellers or ILO local offices in many
countries, or direct from ILO Publications, International Labour Office, CH-1211 Geneva 22, Switzerland.
Catalogues or lists of new publications are available free of charge from the above address, or by email:
Visit our web site: www.ilo.org/publns
Mapping social protection statistics and indicators.docx
iii
Foreword
This document provides a summary of the workshop on “Mapping existing
international social protection statistics and indicators that would contribute to the
monitoring of social protection extension through Social Protection Floors (SPFs)”, which
was hosted by the International Labour Organization (ILO) in Geneva between 13
thand
15
thMarch 2013.
This workshop was organized in line with the inter-agency collaboration which began
in 2009 with the launch of the Social Protection Floor Initiative. Since that collaborative
work started, a number of issues related to coordination between agencies have been
raised. The availability and quality of national social protection data, statistics and
indicators were identified early on as a key issue when trying to monitor the extension of
social protection at both the national and the global level. More specifically, the
importance of social protection data and indicators of coverage, spending and financing
was underlined during the Social Protection Inter-Agency Cooperation Board (SPIAC-B)
meeting held in New York on 11
thFebruary 2013. A key objective of ongoing
collaboration between concerned organizations is the harmonisation of international social
protection data in order to promote data availability and quality as well as to combine
efforts to develop a consistent statistical picture of social protection provision across
countries. The workshop hosted by the International Labour Organization (ILO) in Geneva
on March 13
th, 14
thand 15
th, 2013 aimed at nurturing SPIAC-B’s future discussions on
social protection statistics. It also provided relevant insight that would contribute to the
implementation of the ILO Social Protection Floors Recommendation, 2012 (No. 202).
The workshop aimed at fomenting discussion among persons responsible for social
protection statistics from various organizations active in this field. It focused on social
protection data, statistics and indicators produced or to be produced in order to assess and
monitor social protection extension and its contribution to basic income security
throughout the life cycle.
The workshop allowed participants to work towards two concrete outputs: a mapping
of existing, comparable, internationally collected data and related indicators on social
protection (and more specifically its contribution to ensuring basic income security
throughout the life cycle) and a reflection on current gaps and possible future joint actions.
We hope that the mapping presented in this document will be useful for nurturing
discussions on the monitoring of social protection floors. We also hope that the work
which has started at this first workshop will continue towards building a permanent social
protection statistics inter-agency working group.
Alejandro Bonilla García
Mapping social protection statistics and indicators.docx
v
Contents
Foreword ...
iii
Acknowledgements ...
vii
List of acronyms ...
ix
1.
Introduction ...
1
2.
Session A: Mapping of non age-specific data and indicators ...
6
3.
Session B: Mapping of data and indicators related to social protection
contribution to income security of children ...
21
4.
Session C: Mapping of data and indicators related to social protection
contribution to income security of persons in active age ...
33
5.
Session D: Mapping of data and indicators related to social protection
contribution to income security for older persons ...
46
6.
Session E: Identification of challenges – issues, gaps and overlaps ...
59
7.
Conclusion ...
63
Resources ...
64
[image:5.595.82.532.111.473.2]Appendices ...
65
Table of figures
Box 1
Cooperating on the basis of complementarities:
the Eurostat- ILO-OECD collaboration ...
3
Box 2
Mapping method ...
5
Mapping social protection statistics and indicators.docx
vii
Acknowledgements
All workshop participants have to be thanked for their contributions to the workshop
and, further, to the mapping presented in this publication:
Simone Cecchini
ECLAC
Ceren Gurkan
FAO
Silvio Daidone
FAO
Carlo Cafiero
FAO
Victoire Cleren
GIP SPSI
Charles Knox-Vydmanov
Helpage
Florence Bonnet
ILO
Krzyzstof Hagemejer
ILO
Lou Tessier
ILO
Christoph Ernst
ILO
Fabio Veras
IPC-Brasilia
Shea McClanahan
ISSA
Magid Fathallah
ISSA
Filhon Guillaume
ISSA
Maxime Ladaique
OECD
Chiho Suzuki
UNICEF
Niels Balzer
WFP
RuslanYemtsov
World Bank
Maddalena Honorati
World Bank
Victoria Strokova
World Bank
The following persons also made valuable contributions to the mapping:
Luiza Cristina Munteanu
Eurostat
Sri Wening Handayani
Asian Development Bank
Special thanks must also be paid to Christine Bockstal and Krzysztof Hagemejer for
their support and advice as well as to Jonathan Evershed and all those who contributed to
this publication for their support.
The editors, however, are solely responsible for the content of, any opinions
expressed and any omissions or mistakes made within this paper.
Mapping social protection statistics and indicators.docx
ix
List of acronyms
ADB
Asian Development Bank
ECLAC
Economic Commission for Latin America and the Caribbean
ESSPROSS
European System of Integrated Social Protection Statistics
EU
European Union
FAO
Food and Agriculture Organization
ILC
International Labour Conference
ILO
International Labour Organization/Office
IMF
International Monetary Fund
IPC-Brasilia
International Policy Centre for Inclusive Growth
ISSA
International Social Security Association
OECD
Organisation for Economic Co-operation and Development
SNA
System of National Accounts
SPIAC-B
Social Protection Inter-Agency Cooperation Board
SPF
Social Protection Floor
SSI
Social Security Inquiry
UNICEF
United Nations Children's Fund
Mapping social protection statistics and indicators.docx
1
1.
Introduction
There is a resurgence of interest in social protection at the global level. The
emergence of the SPF concept in the wake of the global crisis has contributed to a growing
global recognition of social protection as a central tool in the reduction and prevention of
poverty and inequality. Many countries, both developed and developing, have experienced
a significant growth in the provision of social protection benefits over recent decades. A
number of international and regional organizations have been engaged in the extension of
social protection. As a result, a need has arisen for coordination of their actions at the
international level, and the SPF Initiative was launched as one of the nine joint initiatives
of the United Nations in 2009. The endorsement of the concept by the G20 and the
adoption by the ILO of the Social Protection Floors Recommendation, 2012 (No.202) at
the International Labour Conference (ILC) in 2012 further highlighted the need for joint
efforts to make social protection a reality for all. The creation of the SPIAC-B is in line
with this greater demand for collaboration and a joined-up approach between relevant
organizations.
Statistics – as well as other information and monitoring indicators - were identified
early on as a critical area for collaboration between agencies working on social protection.
Data on social protection coverage, level of benefits, expenditure and financing are critical
in assessment and monitoring of the state of social protection in and across countries.
Identifying gaps and defining policies to expand coverage or to improve effectiveness and
efficiency of national social protection systems requires reliable data. Thus, there is a
growing recognition of the importance of comprehensive, up to date, comparable and
accessible data on social protection; and recognition of current gaps in its availability. As
such, an initiative for the harmonization of international social protection statistics was put
forward. Its objectives are: to improve the quality of data and statistics; to increase
institutional efficiency and to avoid unnecessary duplication. More broadly, its ultimate
aim is to develop a consistent statistical picture of social protection provisions both at
present and over time across all countries regardless of their development status.
Today, in the field of social protection, agencies collect various qualitative and
quantitative information and data and develop indicators that are not necessarily or easily
comparable. Indeed, while it would be much needed, there is no consistent or systematic
methodology shared by the community of practice regarding the collection of data and
information on provision, coverage, cost or impact of social protection. The lack of
consistent and systematic data gathering methodology has very concrete and truly
damaging consequences both at country and at global levels.
At the national level, social protection is administered by a multitude of actors.
Information and data are fragmented and the availability and quality of such data varies
across countries, as well as across schemes and programmes within countries. In the
absence of coordination mechanisms, many countries face difficulties in assessing current
social protection gaps and needs, and changes over time. Coordination requires a shared
methodology and agreed principles regarding data to be collected (how to classify and
select data, etc.). Without access to a minimum set of social protection data over a
sustained time period, countries are not able to take stock and identify gaps to define
adequate policy options for social protection. They are even less able to monitor changes,
progress and efficiency of social protection provisions over time as well as the capacity of
social protection systems to meet national policy objectives and populations’ needs.
2
Mapping social protection statistics and indicators.docxmethodology for analysing the provision of social protection across countries.
Furthermore, the efforts made by the international community to gather such data were not
always consistent, and in some cases, resulted in duplication of efforts and inefficiencies.
Thus, the need for the progressive harmonization of social protection data is evident.
The harmonization process is associated with developing common standards on: which
data to collect, how to classify data and information and how to categorize programmes
and benefits in order to ensure comparability of data and the ability to use it for multiple
purposes.
Principles and guidelines regarding social protection statistics and indicators resulting
from the harmonization process should be taken into account not only by international
organizations but primarily by countries. Many countries need international support to
enhance their capacity to collect and produce data. One can expect, in the medium to long
term, a widespread application of common statistical standards in and by countries,
improved data availability in the realm of social protection (comparable, adaptable to
various objectives), and ultimately the use of these data to orient and inform policies at the
country level.
As a first step in this process, it was identified that there was a need for a complete
stocktaking of existing social protection international data and indicators, which was the
main objective of the workshop held in Geneva on March 13
th, 14
thand 15
th, 2013. The
workshop focused, in line with the ‘life-cycle’ approach taken in ILO Recommendation
No. 202
1, on the contribution of social protection to income security for children, persons
in active age and persons in old age
2.The Social Protection Floors Recommendation, 2012
(No. 202) calls explicitly for the monitoring of social protection systems both at national
and international levels, which, as detailed above, represents an important challenge.
Conscious of this challenge, representatives from the various organizations gathered
at the workshop discussed solutions that would result in positive outcomes at both the
national and the international levels. It was suggested that a more permanent social
protection statistics and indicators inter-agency working group should be established.
Composed of representatives of key development partners working on the collection,
analysis and dissemination of social protection data for the purpose of international
comparison, the group should develop an integrated and collaborative approach to monitor
social protection extension at both national and global levels. Drawing on the existing
expertise and resources of relevant organizations and successful experiences of
collaboration (see Box 1), the working group should work towards meeting this primary
objective of harmonizing international social protection data and developing common
standards and guidelines for their implementation.
1
Social Protection Floors Recommendation, 2012 (No. 202), paragraph 4 (b), (c) and (d), available
online at: http://www.socialsecurityextension.org/gimi/gess/RessShowRessource.do?ressourceId=31110.
2
Mapping social protection statistics and indicators.docx
3
Box 1
Cooperating on the basis of complementarities: the Eurostat- ILO-OECD collaboration
Over time, Eurostat, the ILO and the OECD have built bridges between their social protection
databases (Eurostat ESPROSS, OECD SOCX and ILO social security inquiry
3), avoiding duplication in
data collection, thanks to an effort to harmonize their respective data classifications. As a result of this
successful collaboration, the three organizations have recently begun work with the Asian Development
Bank (ADB) on similar issues. This box briefly presents the main milestones over the lifetime of this
collaboration so far.
1970s
The European system of integrated social protection statistics (ESSPROS), linked to the System of
National Accounts (SNA), is a common framework developed in the late 1970s by Eurostat and the European
Union (EU) Member States to provide a coherent comparison between European countries. Through
ESSPROS, EUROSTAT defines eight functions of social protection: sickness/health care; disability; old age;
survivors; family/children; unemployment; housing; and social exclusion not elsewhere classified. The units of
reference are the schemes and then benefits provided by these schemes. The ILO Social Security Inquiry (SSI)
follows the same approach and criteria to define schemes and benefits.
1990s
The OECD SOCX database was developed in the 1990s as a tool for monitoring trends in aggregate
social expenditure and analyzing changes in its composition. It contains data for 34 OECD countries for the
period 1980-2009 and estimates for 2010-2012. The main social policy areas are as follows: old age, survivors,
incapacity-related benefits, health, family, active labour market programmes, unemployment, housing, and
other social policy areas. The main data source for the 21 European countries is ESSPROS (with the exception
of health and active labour market programmes data, which come from two other OECD databases). The
process of importing ESSPROS (EUROSTAT) data into SOCX is well established and cooperation is extended
to non-expenditure data.
2000s
The ILO social security inquiry methodology was developed as a comprehensive tool for data collection
and monitoring. The ILO adopted an extended operational definition of social security which comprises 11
functions or policies: health, disability, old age, survivors, maternity, family/children, unemployment,
employment injury, housing, active labour market programmes and general protection against poverty and
social exclusion. This definition, fully in line with the ILO Convention no. 102
4, is relevant for the analysis of
evolving social security programmes and compatible with existing statistical methodologies and frameworks
(mainly ESSPROS and SOCX). Eurostat data as well as OECD data can be imported into the structure of the
ILO social security inquiry and data from SSI can be exported automatically into the OECD structure. Since its
creation, SSI has been importing social protection expenditure data from OECD countries, avoiding duplication
in the collection of data in this area.
3
To identify resources, see the “Resources” section at the end of this document.
Manuals are available online at the following addresses:
ESSPROS Manual:
http://epp.eurostat.ec.europa.eu/portal/page/portal/product_details/publication?p_product_code=KS-RA-11-014
OECD SOCX Manual:
http://www.oecd-ilibrary.org/social-issues-migration-health/is-the-european-welfare-state-really-more-expensive_5kg2d2d4pbf0-en
SSI Manual:
http://www.socialsecurityextension.org/gimi/gess/RessShowRessource.do?ressourceId=6622
4
4
Mapping social protection statistics and indicators.docx2005-2013
More recently OECD, ILO and ADB have worked together to enhance compatibilities and comparability
between data collected by ADB in most Asian countries (part of the Social protection Index database) and
OECD and ILO databases. At present, some of ADB data are part of ILO SSI and used by OECD for wider
social protection expenditure comparisons.
Future potential collaboration with other organizations includes further harmonization and standardization
of social protection data (categorization/ qualification) and data collection tools (among others) in order to
improve data comparability, compatibility and quality.
What makes this collaboration technically possible?
■
The unit of reference is the benefit level for all three data collectors. Combined with agreed criteria to
define benefits, this allows each organization, depending on its own mandate, to use the data collected by
others and display it in its own way. The various agencies did not agree on a common definition of social
protection. The common unit of reference (benefit level) enables them to identify what elements are part of
their respective mandate.
■
The qualification, definition of this ‘unit of reference’, starting from social security functions, type of benefit
(in-cash or in-kind; periodic or not; etc.), public or private; mandatory or voluntary, etc). Criteria have to be
generic as well as detailed enough to be able to take into account the heterogeneity of situations and
developments still to come in the way social protection is and will be provided in developing as well as
developed countries.
■
The classifications by functions (probably the most critical criteria) are more or less detailed depending on
the organization. The ILO classification appears to be the most disaggregated one. The specificity of the
ILO mandate in social security and its historical evolution requires that social security in cases of
“employment injury” and “maternity” are treated as distinct separate functions. In the European
Commission and OECD approaches these are however integrated into other functions (such as maternity
income support under the family/children function).Despite these differences, the combination of criteria
used to define benefits (periodic or not; in cash or in kind; name of the benefits or category or benefits)
allows the disaggregation from a relative aggregated function to two or three specific functions.
■
The approach that takes into account existing classifications and favours compatibility and flexibility.
Structure of the workshop
The workshop itself was organized into five main sessions, four sessions dedicated to
the mapping of social protection data and indicators and one last session to identify gaps,
issues and areas for concrete collaboration. The first session aimed at mapping general/
non age-specific data and indicators while the next three sessions applied the same exercise
through the prism of the life cycle, considering social protection for different age groups,
namely: children, persons in active age and persons in old age.
In each mapping the same types of data were considered: qualitative data and
information, expenditure (and receipts when available), coverage, benefit level, effects and
efficiency, and outcome. For each data type, all collected data and related indicators
available were listed by organization that produce or compile them (see box 2).
Mapping social protection statistics and indicators.docx
5
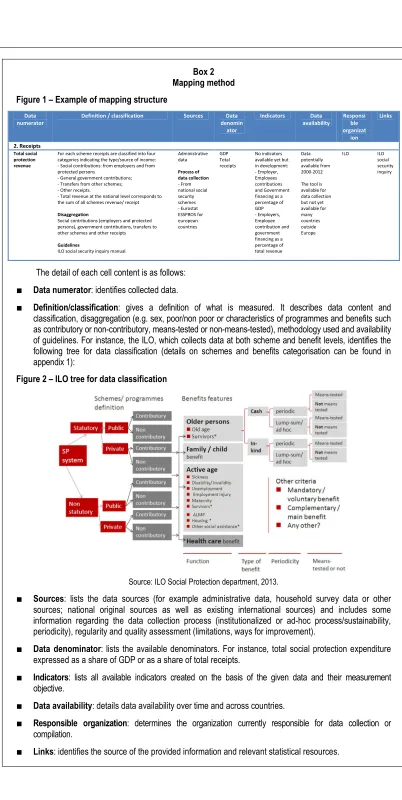
[image:15.595.128.530.0.800.2]Box 2
Mapping method
Figure 1 – Example of mapping structure
Data numerator
Definition / classification Sources Data denomin
ator
Indicators Data availability
Responsi ble organizat
ion
Links
2. Receipts
Total social protection revenue
For each scheme receipts are classified into four categories indicating the type/source of income: - Social contributions: from employers and from protected persons
- General government contributions; - Transfers from other schemes; - Other receipts.
- Total revenue at the national level corresponds to the sum of all schemes revenue/ receipt
Disaggregation
Social contributions (employers and protected persons), government contributions, transfers to other schemes and other receipts
Guidelines
ILO social security inquiry manual
Administrative data
Process of data collection - From national social security schemes - Eurostat ESSPROS for european countries
GDP Total receipts
No indicators available yet but in development: - Employer, Employees contributions and Government financing as a percentage of GDP - Employers, Employee contribution and government financing as a percentage of total revenue
Data potentially available from 2000-2012
The tool is available for data collection but not yet available for many countries outside Europe
ILO ILO social security inquiry
The detail of each cell content is as follows:
■
Data numerator
: identifies collected data.
[image:15.595.135.519.389.582.2]■
Definition/classification
: gives a definition of what is measured. It describes data content and
classification, disaggregation (e.g. sex, poor/non poor or characteristics of programmes and benefits such
as contributory or non-contributory, means-tested or non-means-tested), methodology used and availability
of guidelines. For instance, the ILO, which collects data at both scheme and benefit levels, identifies the
following tree for data classification (details on schemes and benefits categorisation can be found in
appendix 1):
Figure 2 – ILO tree for data classification
Source: ILO Social Protection department, 2013.
■
Sources
: lists the data sources (for example administrative data, household survey data or other
sources; national original sources as well as existing international sources) and includes some
information regarding the data collection process (institutionalized or ad-hoc process/sustainability,
periodicity), regularity and quality assessment (limitations, ways for improvement).
■
Data denominator
: lists the available denominators. For instance, total social protection expenditure
expressed as a share of GDP or as a share of total receipts.
■
Indicators
: lists all available indicators created on the basis of the given data and their measurement
objective.
■
Data availability
: details data availability over time and across countries.
■
Responsible organization
: determines the organization currently responsible for data collection or
compilation.
6 M a p p in g s o c ia l p ro te c tio n s ta tis tic s a n d in d ic a to rs .d o c x
2.
Session A: Mapping of non age-specific data and indicators
Session A | Inter Generational
Definition / classification Sources, including data collection process, regularity, quality assessment (limitations, potential improvements)
Data denominator Indicators Data availability Responsible organization
Links
Qualitative
Overview of social protection system - Inventory and features of existing programmes and benefits in the country [See also ISSA information below]
- Institutional structures, including public, private and mixed; compulsory and voluntary; universal and targeted programmes.
Inventory of national schemes and programmes at the country level as original source.
And when available, based on data from existing international sources, including:
- Eurostat CIRCA qualitative database. - Asian Development Bank social protection index database.
Qualitative information. Inventory and description of schemes and benefits in the ILO social security inquiry database.
Qualitative information.
Available for close to 100 countries (in some cases, partial view of the social protection system).
ILO The ILO social security inquiry: Inventory and description of schemes and benefits under "scheme information section"
http://www.ilo.org/dyn/ilossi/ssimai n.home
Inventory and overview of existing schemes, taking into account statutory and non-statutory schemes and institutional structures.
1. SSA/ISSA: Social Security Programs Throughout the World; Schemes Descriptions;
2. SSA Reforms database; 3. ISSA/OECD/IOPS Complementary and Private Pensions database; 4. ILO (GESS) social security country overviews.
Qualitative information. Qualitative information. In development. ISSA http://www.issa.int/Observatory/Cou ntry-Profiles
Number of social security branches covered by a statutory provision (over 8 of the 9 social security branches mentioned in Convention 102, excluding health care). Many developing countries do not have, at a statutory level, a comprehensive social protection system covering all nine branches as mentioned above. One common situation is a system covering long-term benefits (old-age, survivors and invalidity) and the work injury benefit.
Based on SSA/ISSA: Social Security Programs Throughout the World; Schemes Descriptions (see above). Systematic coding of qualitative information (database on 'social security programmes and mechanisms").
Total number of social security functions as mentioned in Convention 102 (with the exception of health care) [9-1 = 8 social security functions].
As an example, indicator of the comprehensiveness of the social protection system at the national level (from a statutory perspective).
Available for 181 countries. Results published in the World Social Security Report.
ILO
http://www.social-protection.org/gimi/gess/RessFileDo wnload.do?ressourceId=25261
Social protection systems in Latin America and the Caribbean: studies describing and analysing the various components of social protection in the countries of the region (contributory and non- contributory social protection; access to social services; etc.).
Inventory of national schemes and programmes at the country level.
Qualitative information. Qualitative information. 21 countries of Latin America and the Caribbean.
ECLAC http://dds.cepal.org/socialprotection /social-protection-systems/
Demographic structure, and in particular the share of older persons: another factor that can have a direct impact on old-age and health social protection needs (and then expenditure), as well as on the global public expenditure indicator.
United Nations Population Division. World Population Prospects: The 2010 Revision (New York).
Also available from the World Development indicators database.
Total population. Examples of indicators may be: the share of the population aged 0-15, 15-64 or 65 and over as a percentage of total population.
Available for most countries.
UN http://esa.un.org/wpp/
Labour market structure and in particular the size of the formal and informal economy has a direct impact on the coverage of social insurance and other contributory schemes.
International Labour Office, based on national labour force surveys Also available from other international or regional organisations.
Depends on indicator. Indicators such as:
- Labour force and employment to population ratio, unemployment rate; - Status in employment;
- Proportion of employment in the formal / informal sector; - Informal employment as a percentage of total employment. - Proportion of employment in the agricultural sector
M
a
p
p
in
g
s
o
c
ia
l p
ro
te
c
tio
n
s
ta
tis
tic
s
a
n
d
in
d
ic
a
to
rs
.d
o
c
x
7
Session A | Inter Generational
Definition / classification Sources, including data collection process, regularity, quality assessment (limitations, potential improvements)
Data denominator Indicators Data availability Responsible organization
Links
1 Social protection expenditure Public social protection
expenditure
Comprise all public social protection expenditure (main public schemes, both contributory and non-contributory providing means-tested benefits or not), but for most countries only central government expenditure.
Administrative data from ministries of finance.
GDP,
Social protection index.
Public social protection expenditure as a percentage of GDP. Government expenditure on social security and welfare as a % of GDP.
2005, 2008-2010 Asian countries.
ADB No yet available online but will be included in the social protection index database.
Disaggregation Can be disaggregated by - Social insurance / social assistance; - Pensions; health; unemployment; active labour market, family/children, other social insurance; other social assistance.
Guidelines
The Revised Social Protection Index: Methodology and Handbook, ADB 2012 | http://www.adb.org/sites/default/files/spi-handbook.pdf
Process of data collection Rounds of data collection through specific projects (and financing). National correspondent (one per country).
Data from each programme (administrative data) or responsible ministries.
Government Expenditure on - Social Security and Welfare - Health
Data refer to central government, except for the People's Republic of China, Georgia, Japan, the Kyrgyz Republic, and Tajikistan, where data refer to consolidated government or general government.
n.a. GDP Government Expenditure on Social Security and Welfare as a percentage of GDP.
Government Expenditure on Health as a percentage of GDP.
33 to 35 countries depending on indicator from 1990 to 2011.
ADB Key Indicators for Asia and the Pacific 2012: Part III – Regional Trends and Tables: Government and governance (http://www.adb.org/sites/default/fil es/ki/2012/xls/RT07.xlsx) Disaggregation:
- Social Security and Welfare; - Health.
Guidelines n.a.
Public social expenditure
Public social expenditure includes expenditures in social security and assistance, education, health and housing (including contributory and non-contributory pubic schemes).
Administrative data from ministries of finance.
GDP inhabitants sector
government expenditure.
Public social security expenditure (including health) as a percentage of GDP.
Public social expenditure as a percentage of GDP. Public social expenditure as a percentage of total public expenditure by sector.
Public social expenditure per inhabitant by sector.
1990-2010 Latin American and Caribbean countries (21 countries).
ECLAC CEPALSTAT:
http://websie.eclac.cl/infest/ajax/cep alstat.asp?carpeta=estadisticas; Social expenditure indicators: http://dds.cepal.org/gasto/indicador es/
Disaggregation
Health, education, social security and assistance, housing.
Guidelines
Considering that a number of countries only very recently adopted the classification system of the IMF Government Finance Statistics Manual 2001, which is harmonized with the 1993 SNA, this data is not always compatible at the subfunctions or subgroups level, or both.
8 M a p p in g s o c ia l p ro te c tio n s ta tis tic s a n d in d ic a to rs .d o c x
Session A | Inter Generational
Definition / classification Sources, including data collection process, regularity, quality assessment (limitations, potential improvements)
Data denominator Indicators Data availability Responsible organization
Links
Expenditure on social protection
The annual expenditure on social protection is the sum of expenditures (including benefit expenditure and administration costs) of all existing social security/social protection schemes.
Social Protection encompasses all interventions from public or private bodies intended to relieve households and individuals of the burden of a defined set of risks or needs, provided that there is neither a simultaneous reciprocal nor an individual arrangement involved. The list of risks or needs that may give rise to social protection is, by convention, as follows: Sickness/Health care, Disability, Old age, Survivors, Family/children, Unemployment, Housing and Social exclusion not elsewhere classified.
Most countries reported administrative data and register-based data as their main data sources.
ESSPROS data is annually collected mainly from administrative sources, having as statistical unit the so called social protection scheme. It is defined as a distinct body of rules, supported by one or more institutional units, governing the provision of social protection benefits and their financing.
GDP, Total population.
Data on expenditure are made available:
- As a percentage of GDP; - In national currencies (including Euro converted from former national currencies using the irrevocably fixed rate for all years);
- In Ecu/Euro; - In Euro per inhabitant; - In Purchasing Power Standards; - In PPS per inhabitant; - At current prices and at constant prices;
- At current prices and at constant prices per inhabitant; - Percentage of total benefits and percentage of total expenditure.
ESSPROS collects annual data - corresponding to calendar year -from the 27 EU Member States, Iceland, Norway, Switzerland, Croatia and Republic of Serbia. Totals for quantitative data are calculated for EU-27, EU-25, EU-15, EA-17, EA-16, EA-15, EA-13, EA-12 and The European Economic Area: EEA (except Liechtenstein).These aggregates are sums of the values for the related dimensions (no estimation included). ESSPROS online provides access to data from 1990-2010
Eurostat ESSPROS data can be accessed through the dedicated section on "Social protection"
[http://epp.eurostat.ec.europa.eu/po rtal/page/portal/social_protection/in troduction], which is available on the Eurostat website.
In the future, also the Qualitative Information will be available in this page.
Disaggregation
- Benefit in kind / benefit in cash; - Periodic; lump sum; in-kind; - Means-tested; non means-tested; - Function / program type;
- Detail total expenditure / benefit expenditure (administrative costs / other costs). Guidelines
ESSPROS manual [ ESSPROS Manual - The European System of integrated Social Protection Statistics (2012 edition) //
http://www.socialsecurityextension.org/gimi/ge ss/RessFileDownload.do?ressourceId=31988]
Process of data collection Well established (and anchored in Eurostat regulation/ Directives): regular contact with a national correspondent in each EU country (member of the ESSPROS working group).
The Framework Regulation sets the deadline for the Commission to disseminate the ESSPROS data on expenditure and receipt.
Net benefits Social Protection encompasses all interventions from public or private bodies intended to relieve households and individuals of the burden of a defined set of risks or needs, provided that there is neither a simultaneous reciprocal nor an individual arrangement involved. The list of risks or needs that may give rise to social protection is, by convention, as follows: Sickness/Health care, Disability, Old age, Survivors, Family/children, Unemployment, Housing and Social exclusion not elsewhere classified".
Most countries reported administrative data and register-based data as their main data sources.
ESSPROS data is annually collected mainly from administrative sources, having as statistical unit the so called social protection scheme. It is defined as a distinct body of rules, supported by one or more institutional units, governing the provision of social protection benefits and their financing.
GDP Total population
Data on expenditure is made available:
- As a percentage of GDP; - In national currencies (including Euro converted from former national currencies using the irrevocably fixed rate for all years);
- In Ecu/Euro; - In Euro per inhabitant; - In Purchasing Power Standards; - In PPS per inhabitant; - At current prices and at constant prices;
- At current prices and at constant prices per inhabitant; - Percentage of total benefits and percentage of total expenditure (valid only for expenditures);
- Percentage of total receipts (valid only for receipts);
ESSPROS collects annual data - corresponding to calendar year -from the 27 EU Member States, Iceland, Norway, Switzerland, Croatia and Republic of Serbia. Totals for quantitative data are calculated for EU-27, EU-25, EU-15, EA-17, EA-16, EA-15, EA-13, EA-12 and The European Economic Area: EEA (except Liechtenstein).These aggregates are sums of the values for the related dimensions (no estimation included). ESSPROS online provides access to data
Eurostat ESSPROS data can be accessed through the dedicated section on "Social protection"
[http://epp.eurostat.ec.europa.eu/po rtal/page/portal/social_protection/in troduction], which is available on the Eurostat website.
In the future, also the Qualitative Information will be available in this page.
Disaggregation
- Benefit in kind / benefit in cash; - Periodic; lump sum; in-kind; - Means-tested; non means-tested; - Function / program type;
- Detail total expenditure / benefit expenditure (administrative costs / other costs). Guidelines
ESSPROS manual [ ESSPROS Manual - The
Process of data collection Well established (and anchored in Eurostat regulation/ Directives): regular contact with a national correspondent in each EU country (member of the ESSPROS working group).
M
a
p
p
in
g
s
o
c
ia
l p
ro
te
c
tio
n
s
ta
tis
tic
s
a
n
d
in
d
ic
a
to
rs
.d
o
c
x
9
Session A | Inter Generational
Definition / classification Sources, including data collection process, regularity, quality assessment (limitations, potential improvements)
Data denominator Indicators Data availability Responsible organization
Links
European System of integrated Social Protection Statistics (2012 edition) //
http://www.socialsecurityextension.org/gimi/ge ss/RessFileDownload.do?ressourceId=31988]
disseminate the ESSPROS data on expenditure and receipt.
from 1990-2010
Public social protection expenditure
The annual public social security expenditure is the sum of expenditures (including benefit expenditure and administration costs) of all existing public social security/social protection schemes.
Includes all types of benefits - from contributory and non-contributory schemes;
- in cash (periodic or lump-sum) or in kind benefits (means tested or not)
Administrative data from social protection programmes.
GDP, Total government expenditure.
Public social security expenditure (including health) as a percentage of GDP.
Public social security expenditure (including health) as a percentage of total government expenditure.
Consolidated file will be available with the WSSR for the years 1990; 1995; 2000; 2005; 2007; 2009; 2010/2011 for 170 countries
ILO 1. Consolidated excel data file 2. ILO social security inquiry database [not consolidated for all countries] http://www.ilo.org/dyn/ilossi/ssimai n.home?p_lang=en
Disaggregation
- Contributory / non-contributory; cash periodic benefits; cash lump sum and benefits in kind; means tested and non means tested benefits (ref. to main definition of schemes and benefits) Guidelines
ILO SSI manual
[http://www.socialsecurityextension.org/gimi/ge ss/RessShowRessource.do?ressourceId=6622] and guidelines online. Methodology compatible with Eurostat ESSPROS and OECD SOCX. Established bridges.
Process of data collection [Not yet sustainable]
1. Online from social security institution websites (annual and statistical reports), national statistical office (annual yearbook); 2. National consultant coordinating data collection from the identified social security institutions and programmes;
3. Joint ADB/ ILO/ OECD project for Asian countries;
4. Eurostat ESSPROS; 5. OECD SOCX database; 6. CEPAL;
7. IMF. Public social protection
and health expenditure
Comprise all social protection and health (including health insurance schemes) expenditure (all public schemes, both contributory and non-contributory).
Administrative data collected by national ministries of finance.
GDP Public social protection and health expenditure as a percentage of GDP.
Yearly series Most countries (but not for consolidated expenditure).
IMF http://www2.imfstatistics.org/GFS/
Disaggregation
- Economic classification: distinction Social security schemes, social assistance schemes and employer social insurance schemes / in cash or in kind and disaggregation by funding source (contribution employers / employees) for public social protection revenues; distinction of level of government expenditure (central government; State government; local government, social security);
- Functional classification: distinction health and social protection. According to the manual, within social protection same classification of function than Eurostat + R&D and social protection nec) but not available in practice. Guidelines
Government Finance Statistics Manual 2001 | http://dw.mof.go.th/foc/Document/finance_stat e/fpo/GFSM2001.pdf
1
0
M
a
p
p
in
g
s
o
c
ia
l p
ro
te
c
tio
n
s
ta
tis
tic
s
a
n
d
in
d
ic
a
to
rs
.d
o
c
x
Session A | Inter Generational
Definition / classification Sources, including data collection process, regularity, quality assessment (limitations, potential improvements)
Data denominator Indicators Data availability Responsible organization
Links
Social expenditure The annual social expenditure is the sum of expenditures (including benefit expenditure and administration costs) of all existing social security/social protection schemes. Includes all types of benefits (both public and private):
- From contributory and non-contributory schemes;
- In cash (periodic or lump-sum) or in kind benefits (means tested or not).
Administrative data from social protection programmes.
Percentage of GDP / percentage of GNI/ percentage of NNI/ per head, at current or constant prices.
Total, Public, private (mandatory; voluntary) expenditure on old age in a percentage of GDP / GNI/ NNI/ per head at current or constant prices (benefits in kind and cash benefits).
1980-2012 OECD countries
OECD www.oecd.org/els/social/expenditur e
http://stats.oecd.org/wbos/default.a spx?datasetcode=SOCX_AGG
Disaggregation
- Public; private mandatory; public and private mandatory; and private voluntary; - Benefit in kind / benefit in cash; - Social security functions and policy areas by programme type (37 possible types classified within: old age, survivor, incapacity, family, active labour market programmes, unemployment, housing and other social policy areas).
Guidelines:
OECD SOCX Manual (Compatible with ESSPROS manual)
Process of data collection: Data from Eurostat ESSPROS for EU countries and national correspondents for OECD non EU countries.
Total expenditure Benefits expenditure for the following functions: - Passive and active labour market programs; - Social assistance;
- Social insurance. Covers ideally
- Cash benefits as well as benefit in kind; - From contributory and non-contributory schemes, - targeted and universal schemes.
Primary and secondary administrative sources.
GDP total SPL expenditure as a percentage of GDP, by program
- Passive and active LM programs; - Social assistance programs; - Social insurance.
SI expenditure available for 146 countries; SA and LM for 65 countries (23 ECA countries, 20 in Africa, 10 in LAC, 12 in MENA).
World Bank SI expenditure data available online (see "old age" sheet); planning to upload expenditure in SA for ECA countries.
Disaggregation
By SPL program (see ASPIRE classification of programs) for some countries. Guidelines
M
a
p
p
in
g
s
o
c
ia
l p
ro
te
c
tio
n
s
ta
tis
tic
s
a
n
d
in
d
ic
a
to
rs
.d
o
c
x
1
1
Session A | Inter Generational
Definition / classification Sources, including data collection process, regularity, quality assessment (limitations, potential improvements)
Data denominator Indicators Data availability Responsible organization
Links
Benefit expenditure Annual amount spent in program benefits (mil $PPP) for all social protection programmes (depending on information availability regarding existing social protection programmes in relevant household survey). Covers social insurance as well as social assistance programmes, private transfers, active labour market programmes.
Micro data sets.
List of surveys available on ASPIRE [http://web.worldbank.org/WBSITE/EX TERNAL/TOPICS/EXTSOCIALPROTECTIO N/EXTSAFETYNETSANDTRANSFERS/0,,c ontentMDK:23170295~pagePK:148956 ~piPK:216618~theSitePK:282761,00.ht ml#1c].
n.a. Annual Program expenditure (not including administrative costs).
52 countries maximum (depending on categories of programmes) Years: one or several points in time between 2005-2010 (depending on survey availability in countries).
World Bank ASPIRE
http://web.worldbank.org/WBSITE/E XTERNAL/TOPICS/EXTSOCIALPROTEC TION/0,,contentMDK:22986320~men uPK:8117656~pagePK:148956~piPK:2 16618~theSitePK:282637,00.html
Disaggregation
- Public transfer programs are grouped into three main categories: Social Insurance, Labour Market Programs and Social Assistance in 11 sub-categories;
- Social assistance includes i) cash transfer programmes; social pensions and other cash transfers (family/ child or disability allowances), conditional cash transfers; ii) in-kind benefits: School feeding programmes; public works; iii) other social assistance programmes; - Labour market programmes covers unemployment social insurance and ALMP; - Social insurance includes: old age contributory pensions; old age & survivors pensions; social security and health insurance; disability benefits. Guidelines
Some information regarding grouping composition, programmes covered by national surveys available online [ASPIRE website].
Process of data collection Repository of microdata sets (LSMS + national household survey datasets).
2 Receipts Social protection
receipts
Comprises all contributions to social security schemes (government, protected persons, employers).
Administrative data from social protection programmes providing benefits.
GDP Data on receipts are made available: - As a percentage of GDP; - In national currencies (including Euro converted from former national currencies using the irrevocably fixed rate for all years);
- In Ecu/Euro; - In Euro per inhabitant; - In Purchasing Power Standards; - In PPS per inhabitant; - At current prices and at constant prices;
- At current prices and at constant prices per inhabitant; - Percentage of total receipts.
1990-2010 European countries.
Eurostat http://epp.eurostat.ec.europa.eu/po rtal/page/portal/social_protection/in troduction
Disaggregation:
Social contribution, Employers' social contribution/Actual employers' social contribution/Imputed employers' social contribution, Social contribution paid by the protected persons/ Social contribution paid by the employees/ Social contribution paid by the self-employed/ Social contribution paid by pensioners and other protected person, General government contributions, Other receipts. Guidelines
ESSPROS manual [ ESSPROS Manual - The European System of integrated Social Protection Statistics (2012 edition) //
http://www.socialsecurityextension.org/gimi/ge ss/RessFileDownload.do?ressourceId=31988]
1
2
M
a
p
p
in
g
s
o
c
ia
l p
ro
te
c
tio
n
s
ta
tis
tic
s
a
n
d
in
d
ic
a
to
rs
.d
o
c
x
Session A | Inter Generational
Definition / classification Sources, including data collection process, regularity, quality assessment (limitations, potential improvements)
Data denominator Indicators Data availability Responsible organization
Links
Total social protection revenue
For each scheme receipts are classified into four categories indicating the type/source of income: - Social contributions: from employers and from protected persons
- General government contributions; - Transfers from other schemes; - Other receipts.
Total revenue at the national level corresponds to the sum of all schemes revenue/ receipt.
Administrative data. GDP, Total receipts.
No indicators available yet but in development:
- Employer, Employees contributions and Government financing as a percentage of GDP;
- Employers, Employee contribution and government financing as a percentage of total revenue.
Data potentially available from 2000-2012.
The tool is available for data collection but not yet available for many countries outside Europe.
ILO ILO social security inquiry.
Disaggregation
Social contributions (employers and protected persons), government contributions, transfers to other schemes and other receipts
in line with Eurostat ESSPROS methodology. Guidelines
ILO social security inquiry manual
[http://www.social-protection.org/gimi/gess/RessFileDownload.do? ressourceId=6622]
Process of data collection 1. From national social security schemes;
2. Eurostat ESSPROS for european countries.
3 Coverage indicators
3.1 Statutory provision: social security system overview
Number of branches covered by at least one programme
Estimate of the scope of legal coverage is usually measured by the number of branches of social security by which – according to existing legislation – a population or its specific groups is covered. The list of the nine branches covered by ILO Convention No. 102 may be used as a
comparator.
Original sources: Legal information / SSA/ISSA social security programmes throughout the world, Natlex, National legislation
- SSPTW:
http://www.ssa.gov/policy/docs/progd esc/ssptw/
- NATLEX:
http://www.ilo.org/dyn/natlex/natlex_ browse.home?p_lang=fr
n.a. Number of branches covered by law by at least one programme.
Available for most countries Latest available year (2010/2011).
ILO Compiled information
http://www.social-protection.org/gimi/gess/ShowWiki. do?wid=95
Disaggregation:
By social security functions/ branches. Guidelines
Elements of methodology on legal coverage available in the Decent Work Indicators concept note:
http://www.ilo.org/stat/Publications/WCMS_18 3859/lang--en/index.htm
Process of data collection Process of data collection Use existing legal information from international available sources (SSA/ISSA and Natlex), complemented when necessary by national legislations are specific and more difficult to quantify.
Update every 2-3 years for most countries worldwide [Centralised process].
3.2 Extent of effective coverage
Number of persons contributing to social security (by sex and area of residence in selected countries)
Comprises all contributors to a mandatory social security scheme.
Household survey data. Economically active, Total employment, Employees.
Percentage of the economically active population or percentage of total employment contributing to social security.
30 countries (expanding).
ILO
Disaggregation:
- Male / female (some countries); - Urban / rural (some countries); - status in employment (some countries). Guidelines
n.a.
M
a
p
p
in
g
s
o
c
ia
l p
ro
te
c
tio
n
s
ta
tis
tic
s
a
n
d
in
d
ic
a
to
rs
.d
o
c
x
1
3
Session A | Inter Generational
Definition / classification Sources, including data collection process, regularity, quality assessment (limitations, potential improvements)
Data denominator Indicators Data availability Responsible organization
Links
Social protection coverage in health and/or pensions
Persons in employment (Urban areas) covered by social protection in health and/ or pensions.
Household survey data. Total employment and by status in employment.
Proportion of persons in employment covered by social security for health and/ or pensions.
2000-2011 Latin America.
ILO http://www.ilo.org/americas/publica ciones/panorama-laboural/lang--es/index.htm
Disaggregation: - By status in employment; - Health / pensions; - Gender. Guidelines n.a.
Process of data collection Repository of microdata sets (Labour force surveys and other household survey data).
Number of beneficiaries
Number of beneficiaries of SPL programs per year, by program:
- Passive and active LM programs; - Social assistance programs; - Social insurance.
Primary and secondary administrative sources.
Total population. SPL coverage as a percentage of total population.
SI coverage available for 152 countries; SA and LM for 65 countries (23 ECA countries, 20 in Africa, 10 in LAC, 12 in MENA).
World Bank SI coverage data available online (see "old age" sheet).
Disaggregation
By SPL program category (see ASPIRE classification of programs). Guidelines
Ongoing efforts to compile, update and harmonize coverage data. Not available online.
Process of data collection n.a.
Population participating in Social Protection programs
Percentage of population participating in SPL programs (includes direct and indirect beneficiaries). The indicator is estimated by program, for the entire population and by quintiles of post-transfer welfare distribution. Programs are aggregated into social assistance, social insurance, and labour market according to ASPIRE program categories. Specifically, coverage is (Number of individuals in the quintile who live in a household where at least one member receives the transfer)/(Number of households in that quintile).
Nationally representative household survey data.
Total population (by post-transfer quintiles of revenue).
Coverage of Social Protection and Labour programs for the population and by quintiles of post-transfer welfare distribution, and by program category.
56 countries maximum (depending on categories of programmes), mainly from developing world. Years: one or several points in time between 2005-2010 (depending on survey availability in countries).
World Bank ASPIRE
http://web.worldbank.org/WBSITE/E XTERNAL/TOPICS/EXTSOCIALPROTEC TION/0,,contentMDK:22986320~me nuPK:8117656~pagePK:148956~piPK :216618~theSitePK:282637,00.html
Disaggregation
- By SPL function (social assistance, social insurance, labour market programs); -By program category (see ASPIRE classification); - By quintiles of post-transfer welfare distribution.
Guidelines
Some information regarding grouping composition, programmes covered by national surveys available online.
- ASPIRE - tools for practitioners:
web.worldbank.org/WBSITE/EXTERNAL/TOPICS/ EXTSOCIALPROTECTION/EXTSAFETYNETSANDTR ANSFERS/0,,contentMDK:23170295~pagePK:148 956~piPK:216618~theSitePK:282761,00.html#1b
Process of data collection Updated up to twice a year for some countries.
1
4
M
a
p
p
in
g
s
o
c
ia
l p
ro
te
c
tio
n
s
ta
tis
tic
s
a
n
d
in
d
ic
a
to
rs
.d
o
c
x
Session A | Inter Generational
Definition / classification Sources, including data collection process, regularity, quality assessment (limitations, potential improvements)
Data denominator Indicators Data availability Responsible organization
Links
Program beneficiaries by quintile
Percentage of program beneficiaries in a quintile relative to the total number of beneficiaries in the population. The indicator is estimated by program and by quintiles of post-transfer welfare distribution. Programs are aggregated into Social Assistance, Social Insurance and Labour Market according to ASPIRE classification. Specifically, beneficiary incidence is: (Number of individuals in household where at least one member participates in a SPL program in each quintile)/(Number of individuals participating in SPL programs in the population). The indicator includes both direct and indirect beneficiaries.
Nationally representative household survey data.
Total number of beneficiaries. Beneficiary incidence. 56 countries maximum (depending on categories of programmes), mainly from developing world. Years: one or several points in time between 2005-2010 (depending on survey availability in countries).
World Bank ASPIRE
http://web.worldbank.org/WBSITE/E XTERNAL/TOPICS/EXTSOCIALPROTEC TION/0,,contentMDK:22986320~me nuPK:8117656~pagePK:148956~piPK :216618~theSitePK:282637,00.html
Disaggregation:
- by SPL functions (social assistance, social insurance and labour market programs) and by program categories (see ASPIRE classification); - by quintiles of post-transfer welfare distribution.
Guidelines
Definition, composition of indicators available online.
Process of data collection Repository of microdatasets (LSMS + national household survey datasets).
Population not receiving Social Protection benefits
Percentage of population receiving no program. Nationally representative household survey data
Total population. Percentage of total population not covered by social protection.
56 countries maximum (depending on categories of programmes), mainly from developing world. Years: one or several points in time between 2005-2010 (depending from survey availability in countries)
World Bank ASPIRE
http://web.worldbank.org/WBSITE/E XTERNAL/TOPICS/EXTSOCIALPROTEC TION/0,,contentMDK:22986320~me nuPK:8117656~pagePK:148956~piPK :216618~theSitePK:282637,00.html
Disaggregation:
- by SPL functions (social assistance, social insurance and labour market programs) and by program categories (see ASPIRE classification) - by quintiles of post-transfer welfare distribution.
Guidelines
Definition, composition of indicators available online.
Process of data collection Repository of microdatasets (LSMS + national household survey datasets).
Population receiving multiple programmes
Percentage of total population benefiting from multiple categories of programmes.
Nationally representative household survey data.
Total population. Programmes overlap or duplication. 56 countries maximum (depending on categories of programmes), mainly from developing world. Years: one or several points in time between 2005-2010 (depending on survey availability in countries).
World Bank ASPIRE
http://web.worldbank.org/WBSITE/E XTERNAL/TOPICS/EXTSOCIALPROTEC TION/0,,contentMDK:22986320~me nuPK:8117656~pagePK:148956~piPK :216618~theSitePK:282637,00.html
Disaggregation:
- By SPL functions (social assistance, social insurance and labour market programs) and by program categories (see ASPIRE classification); - By quintiles of post-transfer welfare distribution.
Guidelines
Definition, composition of indicators available online.
M
a
p
p
in
g
s
o
c
ia
l p
ro
te
c
tio
n
s
ta
tis
tic
s
a
n
d
in
d
ic
a
to
rs
.d
o
c
x
1
5
Session A | Inter Generational
Definition / classification Sources, including data collection process, regularity, quality assessment (limitations, potential improvements)
Data denominator Indicators Data availability Responsible organization
Links
4 Benefit level Average per capita
transfer
Average per capita transfer among program beneficiaries (daily US$ PPP) for the population and by quintiles of post-transfer welfare distribution.
Household survey data List of surveys available on ASPIRE [http://web.worldbank.org/WBSITE/EX TERNAL/TOPICS/EXTSOCIALPROTECTIO N/EXTSAFETYNETSANDTRANSFERS/0,,c ontentMDK:23170295~pagePK:148956 ~piPK:216618~theSitePK:282761,00.ht ml#1c]
n.a. Average per capita transfer among program beneficiaries (daily US$ PPP).
52 countries maximum (depending on categories of programmes), mainly from developing world. Years: one or several points in time between 2005-2010 (depending on survey availability in countries).
World Bank ASPIRE
(http://data.worldbank.org/data-catalog/atlas_social_protection)
Disaggregation:
- by SPL functions (social assistance, social insurance and labour market programs) and by program categories (see ASPIRE classification) - by quintiles of post-transfer welfare distribution.
Guidelines
Definition, composition of indicators available online.
Process of data collection Repository of microdata sets (LSMS + national household survey datasets).
Total benefit amount received by each quintile of the post transfer welfare distribution
Percentage of benefits going to each quintile of the post-transfer welfare distribution relative to the total benefits going to the population. The indicator is estimated by program and by quintiles of post-transfer welfare distribution. Programs are aggregated into Social Assistance, Social Insurance and Labour Market according to the ASPIRE program classification. Specifically, benefit incidence is: (Sum of all transfers received by all households in the quintile)/(Sum of all transfers received by all households in the population).
Household survey data List of surveys available on ASPIRE [http://web.worldbank.org/WBSITE/EX TERNAL/TOPICS/EXTSOCIALPROTECTIO N/EXTSAFETYNETSANDTRANSFERS/0,,c ontentMDK:23170295~pagePK:148956 ~piPK:216618~theSitePK:282761,00.ht ml#1c]
Total benefit amount