Available online at HABITAT website: http://www.habitat.ub.ac.id
Farmer Satisfaction Analysis on Pseudomonas Fluorescens (PF) Biological
Agent Usage of Red Pepper Commodity (A survey conducted at Junrejo
Village, Batu)
Ayuma Septidita Dirgantari1*, Ratya Anindita2
Department Social of Economy, Faculty of Agriculture, Brawijaya University, Jl. Veteran, Malang 65145, Indonesia
Received: 2 June 2017; Revised: 31 July 2017; Accepted: 1 August 2017
ABSTRACT
Consumer satisfaction is the level of feeling perceived after using a product or service that is very important for the company. The purpose of this study is to analyze the attributes considered and to analyze the level of satisfaction of chili farmers that use Pseudomonas fluorescens (PF) biological agents. This study uses Importance Performance Analysis (IPA) and Customer Satisfaction Index (CSI). The results reveal that there are 5 attributes of PF biological agents that the farmers choose, i.e. pest and disease control, eco-friendly, ease of application, instructions manual, and ease of obtaining. The result obtained from the calculation of CSI is 71%, so the chili farmers or the consumer are satisfied with PF biological agents.
Keywords: consumer satisfaction; biological agent; chili
How to cite:
Dirgantari, A. S., & Anindita, R. (2017). Farmer Satisfication Analysis on Pseudomonas Fluorescens (PF) Biological Agent Usage of Red Pepper Commodity (A survey conducted at Junrejo Village, Batu). HABITAT, 28(2), 61-68. https://doi.org/10.21776/ub.habitat.2017.028.2.9
1. Introduction
Chili is one kind of horticulture with high sale leads as food resources, the source of income for community, domestic and international trade, as well as activity enhancement of processing industry (Andayani and Rusnadiatman, 2013). Chili's per capita household consumption level was the fourth biggest in 2014 by 1,460 ton after shallot, tomato and garlic (The Central Statistics Agency or BPS, 2016). The high level of chili consumption is caused by the function brought such as adding spiciness to dishes and even threatening pain (Wiryanta, 2002).
However, the high demand for it is not followed by the improvement of the results of production. This is in accordance with the data issued by BPS (2016) that the chili production in 2014 had not met yet the community's need and was estimated that the lack of chili stock in needs was 437.86 per day. The low level of chili production is caused by the chili plant which is easy to be attacked by a disease such as anthrax, leaf spot, and bacterial wilt. In order to overcome
the problem, most of the farmer uses chemical pesticides to reduce the disease attack.
Impact of the chemical pesticides use is the emergence of several problems from both environment and living things such as decreasing the fertility of land and resulting in poisoning for the living things themselves (Husnain, Dedi Nursyamsi, 2014). The way to do it is making the farmer aware to reduce the use of chemical pesticide and change it with the organic one like the biological agent. One of the biological agents is Pseudomonas Fluorescens (PF). The use of PF biological agent is expected able to minimize the attack of pests and diseases on chili plant and to give a good impact on agricultural land. However, it does not influence the chili farmer's awareness since s/he still uses chemical pesticide in overcoming pest and disease.
This leads to a presumption that red pepper farmer at Junrejo village does not satisfy with the PF biological agent. For that matter, this encourages PF biological agent manufacturer to search for the farmer's satisfaction on the product and what factors influencing his/her satisfaction. According to (Ganiye, Uche and Elizabeth, 2012), consumer satisfaction is the heart of marketing and is essential for the organization. ---
*Corresponding Author
Available online at HABITAT website: http://www.habitat.ub.ac.id When the organization does not succeed to serve,
it will lead consumer to not fully believe in the product again.
The result of the study carried out by (Erna, 2005) reveals that the attribute of a factor having an influence on customer satisfaction is price, brand, and quality. For that matter, the result of her study becomes a consideration to predict that the factor of quality like the capability to manage disease attack influences the satisfaction of the farmer at Junrejo village. For that matter, the PF biological agent has to be able to satisfy consumer by considering product attributes.
According to the problem statement so the objectives of this research are: (1) to analyze the factors considered by the farmer as the consumer in using PF biological agent for red peppers commodity, and (2) to analyze the level of farmer satisfaction to use PF biological agent for red peppers commodity.
2. Methodology 2.1. Location
This study was undertaken at Junrejo village, Batu since it is a developed village producing and using PF biological agent resulted by one of their group of partner. In addition, Junrejo village is one of the villages included at the program of Batu Go Organic so the PF biological agent truly helps the program.
2.2. Sample Determination
The method used to choose the sample was purposive sampling by taking all population joined at Gawerejo Farmer Group by 19 members and Wanita Tani Sri Lestary by 18 members. This kind of technique was chosen since the information limitations required, the population was spread but there was information source where almost all members used Gawe Rejo and Tani Sri Lestari women farmer group as the object.
2.3. Data Collection Method
The method of collecting data used was primary and secondary data. Primary data collection was gotten from an interview by spreading questionnaire to respondents and documentation to complete data. Secondary data collection was gotten from book, journal, BPS and Junrejo Village Office. The research instrument was the questionnaire that had passed through test reliability with Cronbach's Alpha
value by 0.686 (performance at the stage of satisfaction variable), and 0.609 (importance at the stage of satisfaction variable). The instrument is reliable since according to (Janti, 2004) if the value of Cronbach's alpha is more than 0.60 can be said reliable. In addition, this is also said valid since observed from table r that instrument can be valid if the value is more than 0.3246 and from the calculation using SPSS 16.0, the value of each attribute is above r table value.
2.4. Satisfaction Analysis
An analysis used in this research is Importance Performance Analysis (IPA) and Customer Satisfaction Index (CSI) used to analyze consumer satisfaction.
2.4.1.Importance Performance Analysis (IPA) IPA is the model of analysis used to get information of the level of consumer satisfaction to the service by measuring the level of satisfaction and company performance (Supranto, 2001). This kind of method had been applied in several previous research like the one conducted by (Yola and Budianto, 2013). They used this method to compare how good the company performance felt by the consumer to the satisfaction level by conducting conformity score calculation and Cartesian diagram. In addition, this is also used by (Mustikarini and Simanjuntak, 2014) that IPA is used to find out what attribute required to be improved of held on by the factory so that able to refine the product performance. Below is the stage of IPA method:
a. Importance weighting and performance weighting of each attribute.
b. Calculating the level of compatibility to decide the priority scale by comparing the score of performance (X) and importance (Y) using a formula:
Tki = Xi
Yi x 100% ………(1)
At which,
Tki: Compatibility level of the i-attribute Xi: Assessment score of performance Yi: Importance score assessment
Available online at HABITAT website: http://www.habitat.ub.ac.id 𝑋̅
: The average score of product
performance variable
𝑌̅: Variable average score of farmer's importance to the product
n : the number of respondents who uses the product (n=37)
i : i-Variable
d. Categorizing every attribute at Cartesian diagram using the score of the average total of importance and performance. Below is the figure of a Cartesian diagram:
1) Quadrant I indicates factor or attribute perceived influence customer satisfaction, including service elements considered important, but the management has never performed it like what customer wants so resulting in an upset (customer is dissatisfied).
2) Quadrant II indicates the element of basic service that has been successfully performed by the company, it has to be maintained since it is considered essential and satisfies the consumer.
3) Quadrant III indicates several factors which have less influence to the customer and the implementation is average. Considered less important and satisfying. 4) Quadrant IV indicates factor which
influences customer is less important but the performance is over.
Figure 1. Cartesian Diagram (Supranto, 2011) 2.4.2. Customer Satisfaction Index (CSI)
CSI analysis is a new type of the customer-based measurement system to evaluate and elevate company performance, industry, economic sector, and social economy (Fornell et al., 1996). This kind of method is also applied by several previous researchers (Oktaviani and Suryana, 2006) to find out the level of consumer
satisfaction comprehensively by considering the level of importance of the attribute of product/service. (Swastika, Yanto and Hartati, 2013) used this kind of method to determine the quality of the product based on the costomer satisfication.
a. Calculating the value of Mean Importance Score (MIS) and Mean Satisfaction Score (MSS) from the importance average of every farmer with a formula:
MIS =∑ni=IYi
n ……..(4) MSS = ∑ni=IXi
n ……..(5)
At which,
Yi : i-attribute importance Xi : i-attribute performance n : the number of respondents
b. Calculating Weigh Factors (WF), with a formula:
WFI = MIS
∑pi−IMISi 100%...(6)
At which,
I = i-service attribute
p = The number of importance attribute (k=8)
c. Calculating Weight Score (WS), with a formula:
WSi = WFi x MSSi………...(7)
d. Calculating Weight Total (WT) by adding WS score of all attribute.
e. Calculating the score of Customer Satisfaction Index (CSI) with a formula:
CSI = ∑ WSi
p i=I
5 100%...(8)
3. Results and Discussion 3.1. Field Condition
Junrejo is the village which successfully produces post-harvest well, at which most of the villagers are a farmer, craftsman, trader, entrepreneur, etc. This is proven by the existence of small and medium home industry. Those which are categorized as a medium home industry are a souvenir, household equipment, and gamelan industry, while those joined in the small home industry is plastic woven, ceramic, a snack made of sweet potato and agriculture tool processing. That business field actually brings a great result, this can be seen from the number of goods sent to other cities or island. Having been seen from the diversity of the livelihoods of Junrejo's community, it can be concluded that Junrejo's community is truly heterogeneous. That diversity leads Junrejo community to live a 𝑋̅ (performance/satisfaction)
𝑌̅
𝑋̅ 𝑌̅ Importance
Quadrant II Maintaining Achievement
Quadrant III Low Priority Quadrant III
Priority
Available online at HABITAT website: http://www.habitat.ub.ac.id harmonious life and is able to grow solidarity by
respecting each other without seeing race, ethnic group, religion, and group.
3.2. Consumer satisfaction Analysis 3.2.1. Importance Performance Analysis
IPA is conducted by calculating the total score of performance and customer interest. Furthermore, it is conducted a calculation of the average score of performance and importance used to decide the limit of the Cartesian diagram.
1) Relevance
Table 1 indicates that:
a. Odor Attribute
The result of calculation of the relevance is 91.30% or at the range of 80-100% which means highly suitable. If seen from the importance and performance, this attribute has an almost same value. The farmer considers this attribute is less important and company performance is average, so that performance and customer expectation is compliance. It is like a study conducted by (Fandos and Flavian, 2006) that product odor will influence customer reaction.
Table 1. Relevance Calculation
Name of
b. Pest Control Ability
Compliance calculation result of pest control ability is 55.26%, it includes in less appropriate category or performance is not according to consumer expectation. Average value of performance is 2.27, it includes in the attributes of pest control ability is very important in cultivation.
c. Ability to control disease attacks
The compliance of this attribute is 53.01% included in the less appropriate category. The average interest value of this attribute is 4.49 higher than the average performance of 2.38 which means this attribute is considered very important but the performance of the company is low. This is in accordance with Soenandar and Tjachjono's (2013) opinion that PF is very effective in suppressing Ralstonia solanacearium bacterial wilt on chili, so farmers are very hopeful that this product is able to control disease attacks. This means that the company's performance is in accordance with farmer's expectation but the performance should still be improved. This is in line with the benefits of biological agents according to BPTH (2009) that it is safe for humans, natural and environmental enemies as well as the products of plants produced is free from pesticide residues.
e. Ease of Application and Operation Skills These two attributes from the calculation result obtain a value of the suitability level by 100% so that the performance provided is in accordance with the expectations of farmers. Relevance average value of those two goes into the range of 4.20-5.00 which means these attributes are very important in influencing satisfaction. Performance average value of both also goes into the range of 4.20-5.00 which means the farmers strongly agree on the performance of this attribute. These two attributes greatly assist farmers in the application of PF biological agents because many farmers do not know how to use them.
f. Product packaging
Available online at HABITAT website: http://www.habitat.ub.ac.id manufacturer varies from 1L, 2L, and 5L
packaging sizes, while some consumers bring their own bottles that only fill up in production areas which are not far from where they live. Therefore, packaging performance exceeds the level of the farmer's interest.
g. Ease of acquiring
This attribute has a suitability rate of 98.74% included in the range of 80-100% that is very appropriate for the company's performance against this product is in accordance with the expectations of consumers but the performance must be improved. The results of interviews conducted with farmers are that PF biological agents are easy to obtain because the factory is next to their house and the product is always available.
The overall relevance average of consumer expectation and company performance is 94,24%. The score is seen from Table 2 included in the range of 80-100% or the level of suitability "strongly appropriate" so that the overall attributes of biological agents product are very appropriate with the one expected consumer but the company still has to improve its performance until the farmers really feel satisfied with the product.
Table 2. Category Level of Conformity Between Interest to Performance (Diyahya et al., 2016)
Relevance Range of Conformity (%)
Strongly Appropriate 80-100
Appropriate 70-79
Average 60-69
Less Appropriate 50-59
Not Appropriate 40-49
Performance and importance average score of each attribute is the basis to determine if the performance of PF biological agent is good or not, and is in accordance with the consumer's expectation or not. This is done by comparing performance and importance average score of each attribute. The result of the calculation reveals that the performance is 3.43 while the importance is 3.86. The value is used as a cutoff point or divisor in Cartesian diagram divided from four quadrants, i.e., quadrant I priority, quadrant II maintain performance, quadrant III less priority, and quadrant IV redundant (Supranto, 2011).
2) Cartesian Diagram
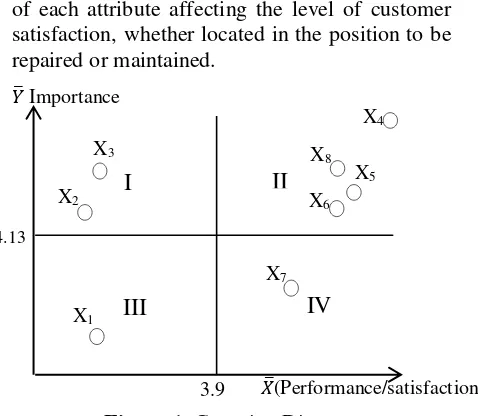
The result of IPA method got the average value of performance level for each attribute 3,43 while importance level is 3,86. This average score is used to divide the boundary between importance and performance on the Cartesian diagram. Based on Figure 1, it is known that Cartesian diagram is used to find out the position of each attribute affecting the level of customer satisfaction, whether located in the position to be repaired or maintained.
𝑌̅ Importance
Figure 1. Cartesian Diagram Quadrant I
Figure 1 indicates that quadrant I or the priority is the attribute which is considered affects consumer satisfaction and is considered important, but the company has not implemented it in accordance with the wishes of consumers so that they are not satisfied even disappointed with the product. The company should refine this quadrant. Attributes that goes into the quadrant I is the ability of pest control and disease attack. These two attributes are considered important by farmers in cultivation, but the performance is still low or not in accordance with consumer expectations. The performance of the attribute has not been able to control the disease attacks and to eradicate the pest well. This is why some farmers do not fully use biological agents or even they still use chemical pesticides as a whole. These two attributes are superior functions that farmers need in agricultural cultivation that affect the production results so the company must improve the performance well.
Quadrant II
Quadrant II indicates attributes that are considered important by consumers and the implementation has been in accordance with consumer expectations. Attributes included in this quadrant must be maintained because they
𝑋̅(Performance/satisfaction) 3.9
2
X4
4.13
X6
X5
X8
X7
X2
X1
X3
I
II
Available online at HABITAT website: http://www.habitat.ub.ac.id are very important and truly satisfy consumers.
Attributes that go into quadrant II are:
a. Eco-Friendly
Performance of eco-friendly attributes is considered good so it needs to be maintained. The farmers say that PF biological agents are very eco-friendly since it is made of materials that do not contain chemicals so biological agents are very eco-friendly.
b. Ease of application
Ease of application attribute of PF biological agent is perceived well by the consumer and must be maintained. According to the consumer, product application does not give any difficulty, because it only mixes a little biological agent with water and can be directly applied. Most of the people do not like the complicated things so that with ease will greatly affect consumer satisfaction.
c. Operation Skills
These attributes are considered important and the performance of operational skill is considered good. This is because the labeling of operation skills are very clear so that it helps customer a lot who do not yet know how to use it.
d. Ease of acquiring
This attribute is considered important because the biological agent is the only product available at Junrejo Village, therefore if the products are not available, the customer will use chemical pesticides again. But it has never happened, on the other hand, the production of biological agents is still at Junrejo village so it adds a plus value to influence consumer satisfaction.
Quadrant III
Quadrant III or low priority is a quadrant indicating that the attributes in this quadrant are less important for the consumer and the implementation is also mediocre, so it is considered less important and less satisfactory. The attributes included in this quadrant are the odor. This attribute is considered less important and the performance of the odor is also not very good. It can be seen that the biological agent is made from organic which is identical with the stinging smell. But the odor is not so questioned by farmers because farmers are more concerned with quality than the smell or it does not affect the goodness of the cultivation. This attribute is less important for farmers, but it would be better
if the producers are able to reduce the existing odor from PF Biological Agents.
Quadrant IV
Quadrant IV or redundant is a quadrant that indicates a factor in affecting customers is less important, but its implementation is excessive. The attributes included in this quadrant are packaging. It is considered less important by farmers but the performance is excessive or exceeds the level of the farmer's interest. This is in accordance with Tjiptono's (2008) opinion that packaging has a benefit to provide attractiveness and an identity. PF biological agent package is available at various size but the farmers are concerned with this because they usually bring their own bottles. This gives an advantage to the producers since they spend only a small amount of money to buy bottles. On the other hand, the use of bottles is also reduced so that giving a positive impact on the environment. The performance of these excessive attributes can be reduced and their power is given to the attributes perceived important by farmers but low performance.
According to the IPA result, farmers' satisfaction on PF biological agents is influenced by attributes located in quadrants I and II.
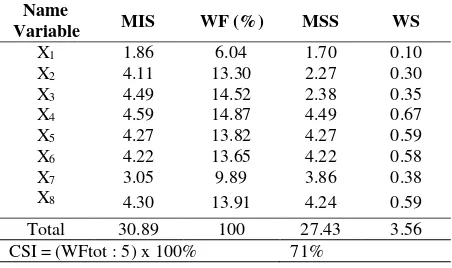
3.2.2. Customer Satisfaction Index (CSI)
Based on the calculation of Customer Satisfaction Index (CSI) presented in Table 3 by comparing WS with maximum scale (scale 5), the result of CSI obtained is 71%. That is close to 100%, which means 71% of respondents fall into the category of satisfaction to the 8 attributes studied, while the remaining 29% fall into another category with attributes that are not studied.
Table 3. Customer Satisfaction Index Calculation
Name
Variable MIS WF (%) MSS WS
X1 1.86 6.04 1.70 0.10
X2 4.11 13.30 2.27 0.30
X3 4.49 14.52 2.38 0.35
X4 4.59 14.87 4.49 0.67
X5 4.27 13.82 4.27 0.59
X6 4.22 13.65 4.22 0.58
X7 3.05 9.89 3.86 0.38
X8 4.30 13.91 4.24 0.59
Total 30.89 100 27.43 3.56 CSI = (WFtot : 5) x 100% 71%
Available online at HABITAT website: http://www.habitat.ub.ac.id but are considered important by farmers. This can
be an essential concern in improving the service for customer satisfaction.
According to (Diyahya et al., 2016), the enhancement of performance values will increase the value of WS (Weight Score) thereby increasing the CSI value by up to 100%. Table 3 indicates that WS value of the CSI calculation shows the contribution of the product attribute to the overall farmer satisfaction. The eco-friendly attribute has the highest WS value by 0.67, so this is the one that gives highest contribution satisfaction among the other. For that matter, the relationship between IPA and CSI is theoretically clear that the value of performance greatly affects consumer satisfaction comprehensively. This is because the performance value is a multiplier of the WF value (Weigh Factor).
4. Conclusion
As a result, it concludes that the attributes perceived by farmers as consumers of PF biological agents are attributes of pests and diseases control, eco-friendly, ease of application, operation skills and ease of obtaining. The results are obtained from the calculation of IPA.
In general, a consumer is satisfied with the quality of PF biological agent. It is proven by the results of CSI analysis with the value of 71% or listed in the range of 66% - 80.99%, which indicates that consumers are satisfied.
References
Badan Pusat Statistik. (2016). Konsumsi per Kapita dalam Rumah Tangga Setahun menurut Hasil Susenas (sayur-mayur). Retrieved Desember 19, 2016, from Kementrian Pertanian RI: www.pertanian.go.id.
Andayani, S. A. and Rusnadiatman, N. (2013) ‘Jurnal Ilmu Pertanian dan Peternakan Volume 1 Nomor 2 Desember 2013’, 1(1997), pp. 10–34.
Diyahya, I. et al. (2016) ‘Lubuk Pinang
Kabupaten Mukomuko Analysis of Satisfaction Level Corn Farmers to Their Marketing Institution Services in Subdistrict of Lubuk Pinang District of Mukomuko’, Agrisep, 16(1), pp. 45–58. Erna, F. (2005) ‘Atribut Produk Yang
Dipertimbangkan Dalam Pembelian
Kosmetik Dan Pengaruhnya Pada Kepuasan Konsumen Di Surabaya’, Jurnal Manajemen dan Kewirausahaan, 7, p. pp.139-151. Available at: http://puslit2.petra.ac.id/ejournal/index.php /man/article/view/16360.
Fandos, C. and Flavián, C. (2006) ‘Intrinsic and extrinsic quality attributes, loyalty and buying intention: an analysis for a PDO product’, British Food Journal, 108(8), pp.
646–662. doi:
10.1108/00070700610682337.
Fornell, C. et al.(1996) ‘The American Customer
Satisfaction Index : Nature , Purpose , and Findings The American Customer Satisfaction Index : Nature , Purpose , and’, Journal of Marketing, 60(4), pp. 7– 18.
Ganiyu, R. A., Uche, I. I. and Elizabeth, A. O. (2012) ‘Is Customer Satisfaction an
Indicator of Customer Loyalty ?’,
Australian Journal of Business and Management Research, 2(7), pp. 14–20.
Husnain, Dedi Nursyamsi, dan J. P. (2014) ‘Penggunaan Bahan Agrokimia Dan Dampaknya Terhadap Pertanian Ramah Lingkungan’, Pengelolaan Lahan Pada Berbagai Ekosistem Mendukung Pertanian Ramah Lingkungan., (January), pp. 7–45.
Janti, S. (2014) ‘Analisis Validitas Dan Reliabilitas Dengan Skala Likert Terhadap Pengembangan Si/Ti Dalam Penentuan Pengambilan Keputusan Penerapan Strategic Planning Pada Industri Garmen’, in Prosiding Seminar Nasional Aplikasi Sains & Teknologi (SNAST), pp. 155–160.
Mustikarini, F. and Simanjuntak, M. (2014) ‘Satisfaction and Loyalty to Pesticides among Paddy Farmers Abstract’, 7(2), pp. 93–102.
Oktaviani, R. W. and Suryana, R. N. (2006) ‘Analisis Kepuasan Pengunjung Dan Pengembangan Fasilitas Wisata Agro ( Studi Kasus di Kebun Wisata Pasirmukti , Bogor )’, Jurnal Argo Ekonomi, 24(1), pp. 41–59.
Available online at HABITAT website: http://www.habitat.ub.ac.id Supranto. 2001. Pengukuran Tingkat Kepuasan
Pelanggan untuk Menaikkan Pangsa Pasar. Jakarta: Rineka Cipta.
Supranto. 2011. Pengukuran Tingkat Kepuasan Pelanggan untuk Menaikkan Pangsa Pasar (Cetakan keempat). Jakarta: Rineka Cipta.
Swastika, N., Yanto, T. and Hartati, A. (2013) ‘Performasi Kualitas Atribut Beras Organik di Kabupaten Sragen’, Agrin, 17(2), pp. 103-112.
Tjiptono, F. 2008. Strategi Pemasaran. Yogyakarta: Andi.
Wiryanta, B. 2002. Bertanam Cabai Pada Musim Hujan. Jakarta: AgroMedia Pustaka. Yola, M. and Budianto, D. (2013) ‘Pelayanan