Table of Contents
• Introduction
• Reliability of Series Systems of “n” Identical and Independent Components
• Numerical Examples
• The Case of Different Component Reliabilities • Reliability of Parallel Systems
• Numerical Examples
• Reliability of “K out of N” Redundant Systems with “n” Identical Components
• Numerical Example
• Combinations of Configurations • Summary
• For Further Study • About the Author
• Other START Sheets Available
Introduction
Reliability engineers often need to work with systems having elements connected in parallel and series, and to calculate their reliability. To this end, when a system consists of a combination of series and parallel segments, engineers often apply very convoluted block reliability formulas and use software calculation packages. As the underlying statistical theory behind the formulas is not always well understood, errors or misapplications may occur.
The objective of this START sheet is to help the reader bet-ter understand the statistical reasoning behind reliability block formulas for series and parallel systems and provide examples of the practical ways of using them. This knowl-edge will allow engineers to more correctly use the software packages and interpret the results.
We start this START sheet by providing some notation and definitions that we will use in discussing non-repairable sys-tems integrated by series or parallel configurations:
1. All the “n” system component lives (X) are Exponentially distributed:
2. Therefore, every ith component 1 < i < n Failure Rate (FR) is constant (λi(t) = λi).
3. All “n” system components are identical; hence, FR are equal (λi= λ; 1 < i < n).
4. All “n” components (and their failure times) are statisti-cally independent:
5. Denote system mission time “T”. Hence, any ith compo-nent (1 < i < n) reliability “Ri(T)”:
Summarizing, in this START sheet we consider the case where life is exponentially distributed (i.e., component FR is time independent). First, examples will be given using iden-tical components, and then examples will be considered using components with different FR. Independent compo-nents are those whose failure does not affect the performance of any other system component. Reliability is the probabili-ty of a component (or system) of surviving its mission time “T.” This allows us to obtain both, component and system FR, from their reliability specification.
We will first discuss series systems, then parallel and redun-dant systems, and finally a combination of all these configu-rations, for non-repairable systems and the case of exponen-tially distributed lives. Examples of analyses and uses of reliability, FR, and survival functions, to illustrate the theory, are provided.
Reliability of Series Systems of “n” Identical
and Independent Components
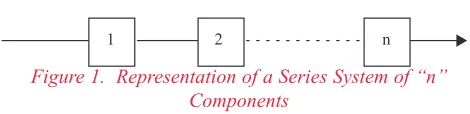
A series system is a configuration such that, if any one of the system components fails, the entire system fails. Conceptually, a series system is one that is as weak as its weakest link. A graphical description of a series system is shown in Figure 1.
START
Selected Topics in Assurance
Related Technologies
Volume 11, Number 5
Understanding Series and Parallel Systems Reliability
ST
AR
T 2004-5,
S&P SY
SREL
A publication of the Reliability Analysis Center
( ) {
}
- T( )
( )
- Te T F dt T f ; e -1 T X P T
F = ≤ = λ = δ =λ λ
{
X andX and...X T}
P 1 2 n>
{
X T} {
P X T} {
...PX T}
P 1> 2> n>
=
( ) (
)
(
( )
)
T T R ln -e
T X P T
Figure 1. Representation of a Series System of “n” Components
Engineers are trained to work with system reliability [RS]
con-cepts using “blocks” for each system element, each block hav-ing its own reliability for a given mission time T:
RS= R1 × R2× … Rn(if the component reliabilities differ, or)
RS= [Ri ] n
(if all i = 1, … , n components are identical)
However, behind the reliability block symbols lies a whole body of statistical knowledge. For, in a series system of “n” compo-nents, the following are two equivalent “events”:
“System Success” ≡“Success of every individual component”
Therefore, the probability of the two equivalent events, that define total system reliability for mission time T (denoted R(T)), must be the same:
The preceding assertion holds because Ri(T), the probability of
any component succeeding in mission time T, is its reliability. All system components are assumed identical with the same FR “λ” and independent. Hence, the product of all component reli-abilities Ri(T) yields the entire system reliability R(T). This
allows us to calculate R(T) using system FR (λs= n×λ), or the
“n×T” power of unit time component reliability [Ri (1)]nT, or the
“nth” power of component reliability [R
i(T)]n, for any mission
time T. We will discuss, later in this START sheet, the case where different components have different reliabilities or FR.
From all of the preceding considerations, we can summarize the following results when all elements, which are identical, of a system are connected in series:
1. The reliability of the entire system can be obtained in one of two ways:
• R(T) = [Ri(T)]n; i.e., the reliability (T) of any component
“i” to the power “n”
• R(T) = [Ri(1)]nT; unit reliability of any component “i” to
the power “nT”
2. System reliability can also be obtained by using system FR λs: R(T) = exp{-λσT}:
• Since λs= λ+λ+λ+ …+ λ= n × λ(all component FR λ
are identical)
• System FR λsis then, the sum (“n” times) of all
compo-nent failure rates (λ):
R(T) = Exp{-(λ+λ+λ+ …+ λ)×T} = Exp{-n×λ×T}) = Exp{-λsT} 3. Component FR (λ) can be obtained from system reliability
R(T):
• λ= [- ln (R(T))] / n×T (inverting the reliability results given in 1)
• Component FR λcan also be obtained from component reliability Ri(T):
λ= - ln [Ri(T)] n
/ n×T = - ln [Ri(T)] /T
• Previous expression is used for allocating system FR λs,
among the system components
4. Total system FR λscan also be obtained from 3:
• λs= [- ln (R(T))] / T = - ln [Ri(T)] n
/ T
• λs= n × λremains time-independent in series
configu-ration
5. Allocation of component reliability Ri(T) from systems
requirements is obtained by solving for Ri(T) in the
previ-ous R(T) equations.
6. System “unreliability” = U(T) = 1 - R(T) = 1 - reliability.
One can calculate the various reliability and FR values for the special case of unit mission time (T = 1) by letting “T” vanish from all the formulas (e.g., substituting T by 1). One can obtain reliability R(T) for any mission time T, from R(1), reliability for unit mission time:
Numerical Examples
The concepts discussed are best explained and understood by working out simple numerical examples. Let a computer system be composed of five identical terminals in series. Let the required system reliability, for unit mission time (T = 1) be R(1) = 0.999.
We will now calculate each component’s reliability, unreliabili-ty, and failure rate values.
From the data and formulas just given, each terminal reliability Ri(T) can be obtained by inverting the system reliability R(T)
equation for unit mission time (T = 1):
Component unreliability is: Ui(1) = 1 - Ri(1) = 1 - 0.9998 =
0.0002.
1 2 n
{
System Succeeds} {
PComp1andComp2...andCompn Succeed}
P
R(T)= ↔ = ↔
{
} {
}
n) T -(e T -...e T -e (T) n ...R (T) 1 R Suc n Comp ...P Suc Comp1
P ↔ ↔ = = λ λ = λ
=
[
] [
]
[ ] [
]
nTy(1) Reliabilit Comp nT ) 1 ( i R nT ) -e ( n y(T) Reliabilit Comp n ) T ( i
R = = λ = =
=
(
)
- sT - s T[ ]
Tn
1...,X T e (e ) R(1)
X P
R(T)= > = λ = λ =
[
R (1)]
0.999 )e ( ) (e e
R(1)= -λs = -5λ = -λ 5= i 5=
[ ]
R(1) (0.999) 0.9998 (1)Ri = 1/5= 1/5=
Component FR is obtained by solving for λin the equation for component reliability:
Now, assume, that component reliability for mission time T = 1 is given: Ri(1) = 0.999. Now, we are asked to obtain total
sys-tem reliability, unreliability, and FR, for the (computer) syssys-tem and mission time T = 10 hours. First, for unit time:
Hence, system FR is:
If we require system reliability for mission time T = 10 hours, R(10), and the unit time reliability is R(1) = 0.995, we can use either the 10thpower or the FR λ
s:
If mission time T is arbitrary, then R(T) is called “Survival Function” (of T). R(T) can then be used to find mission time “T” that accomplishes a pre-specified reliability. Assume that R(T) = 0.98 is required and we need to find out maximum time T:
Hence, a Mission Time of T = 4.03 hours (or less) meets the requirement of reliability 0.98 (or more).
Let’s now assume that a new system, a ship, will be propelled by five identical engines. The system must meet a reliability requirement R(T) = 0.9048 for a mission time T = 10. We need to allocate reliability by engine (component reliability), for the required mission time T. We invert the formula for system reli-ability R(10), expressed as a function of component relireli-ability. Then, we solve for component reliability Ri(10):
We now calculate system FR (λs) and MTTF (µ) for the
five-engine system. These are obtained for mission time T = 10 hours and required system reliability R(10) = 0.9048:
FR and MTTF values, equivalently, can be obtained using FR per component, yielding the same results:
Finally, assume that the required ship FR λs= 5 × λ= 0.010005
is given. We now need component reliability, Unreliability and FR, by unit mission time (T = 1):
The Case of Different Component Reliabilities
Now, assume that different system components have different reliabilities and FR. Then:Then system Mean Time To Failure, MTTF, = µ= 1/λs= 1/Σ λi
0.95, 0.93, and 0.9, respectively. Then, total system reliability R(T) for T = 10 and FR are:
Since the system FR is λs= 0.02697, then the system MTTF is
µ= 1/λσ= 1/Σ λi= 1/0.02697 = 37.077.
Reliability of Parallel Systems
A parallel system is a configuration such that, as long as not all of the system components fail, the entire system works. Conceptually, in a parallel configuration the total system relia-bility is higher than the reliarelia-bility of any single system compo-nent. A graphical description of a parallel system of “n” com-ponents is shown in Figure 2.
Figure 2. Representation of a Parallel System of “n” Components
Reliability engineers are trained to work with parallel systems using block concepts:
RS= 1 - Π(1 - Ri) = 1-(1 - R1) × (1 - R2) ×… (1 - Rn); if
the component reliabilities differ, or
RS= 1 - Π (1 - Ri) = 1-[1 - R] n
; if all “n” components are identical: [Ri = R; i = 1, …, n]
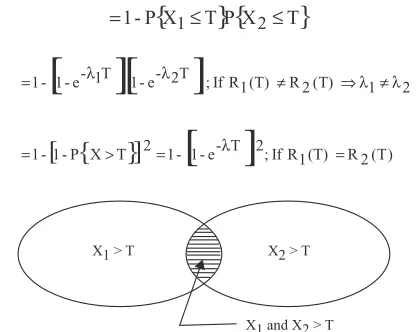
However, behind the reliability block symbols lies a whole body of statistical knowledge. To illustrate, we analyze a simple par-allel system composed of n = 2 identical components. The sys-tem can survive mission time T only if the first component, or the second component, or both components, survive mission time T (Figure 3). In the language of statistical “events”:
Figure 3. Venn Diagram Representing the “Event” of Either Device or Both Surviving Mission Time
This approach easily can be extended to an arbitrary number of “n” parallel components, identical or different. By expanding the formula RS= 1 -(1 - R1)×(1 - R2)×…(1 - Rn) into products,
the well-known reliability block formulas are obtained. For example, for n = 3 blocks, when only one is needed:
RS= 1 -(1 - R1)×(1 - R2)×(1 - R3) = R1 + R2 + R3- R1R2 - R1R3
- R2R3+ R1R2R3 or
RS= 1 -(1 - R)×(1 - R)×(1 - R) = 3R - 3R2+ R3 (if all
compo-nents are identical: Ri = R; i = 1, …, n
Using instead, the statistical formulation of the Survival Function R(T), we can obtain system MTTF (µ) for an arbitrary mission time T. For, say n = 2 arbitrary components:
Finally, one can calculate system FR λsfrom the theoretical
Notice from this derivation that, even when every component FR(λ) is constant, the resulting parallel system Hazard Rate λs(T) is time-dependent. This result is very important!
Numerical Examples
Let a parallel system be composed of n = 2 identical compo-nents, each with FR λ = 0.01 and mission time T = 10 hours, only one of which is needed for system success. Then, total sys-tem reliability, by both calculations, is:
Mean Time to Failure (in hours):
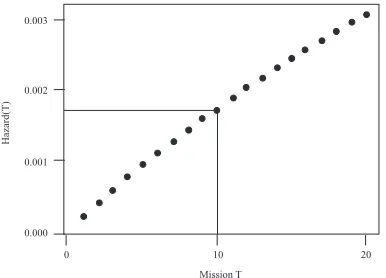
The failure (hazard) rate for the two-component parallel system is now a function of T:
This system hazard rate λs(T) can be calculated as a function of
any mission time T, as shown in Figure 4.
Figure 4. Plot of the Hazard λs(T) as a Function of Mission
Time T. Hazard Rate λs(T) increases as time T increases. This
plot can be used to find the λs(T) required to meet a Mission
Time of T. Say T = 10, then λs(T) about 0.0018
Reliability of “K out of N” Redundant Systems
with “n” Identical Components
A “k” out of “n” redundant system is a parallel configuration where “k” of the system components, as a minimum, are required to be fully operational at the completion time T of the mission, for the system to “succeed” (for k = 1 it reduces to a parallel system; for k = n, to a series one). We illustrate this using the example of a system operation depicted in Figure 5.
The Probability “p” for any system unit or component “i”, 1 < i < n, to survive mission time T is:
Figure 5. Units Either Fail/Survive Mission Time
All units are identical and “k” or more units, out of the “n” total, are required to be operational at mission time T, for the entire system to fulfill the mission. Therefore, the Probability of Mission Success (i.e., system reliability) is equivalent to the probability of obtaining “k” or more successes out of the possi-ble “n” trials, with success probability p.
This probability is described by the Binomial (n, p) Distribution. In our case, the probability of success “p” is just the reliability Ri(T) of any independent unit or component “i”, for the required
mission time “T”. Therefore, total system reliability R(T), for an arbitrary mission time T, is calculated by:
Sometimes the formula: is used instead. This holds true because:
The “summation” values are obtained using the Binomial Distribution tables or the corresponding Excel algorithm (for-mula).
Following the same approach of the series system case, we obtain the MTTF (µ).
We can obtain all parameters for an arbitrary T, by recalculating probability p = e-λTof a component surviving this new mission time “T”. In the special case of mission time T = 1, the “T” van-ishes from all these formulas (e.g., substituted T by 1).
Applying the immediately preceding assumptions and formu-las, we obtain the following results:
• The reliability R(T) of the entire system, for specified T, is obtained by:
- Providing the total number of system components (n) and required ones (k)
- Providing the reliability (for mission time T) of one component: Ri(T) = p
- Alternatively, providing the Failure Rate (FR) λof one unit or component
• System MTTF can be obtained from R(T) using the preced-ing inputs and:
-• The “Unreliability” = U(T) = 1 - Reliability = 1 - R(T)
Numerical Example
Let there be n = 5 identical components (computers) in a system (shuttle). Define system “success” if k = 2 or more components (computers) are running during re-entry. Let every component (computer) have a reliability Ri(1) = 0.9. Let mission “re-entry”
time be T = 1. If each component has a reliability Ri(T) = p =
0.9, then total system (shuttle) reliability R(T), the component FR (λ) and the MTTF (µ) are obtained as:
= 9.491 x 1.283 = 12.177
Now, assume that a less expensive design is being considered, consisting of n = 8 identical components in parallel. The new design requires that at least k = 5 units are working for a suc-cessful completion of the mission. Assume that mission time is T = 1 and the new component FR λ= 0.223144. Compare the two system reliabilities and MTTFs.
First, we need to obtain the new component reliability Ri (T) = p
for T = 1:
Proceeding as before, we obtain the new total system reliability for unit mission time:
= 4.481 x 1.283 = 5.7497
The cheaper (second) design is, therefore, less reliable (and has a lower MTTF) than the first design.
Combinations of Configurations
Some systems are made up of combinations of several series and parallel configurations. The way to obtain system reliability in such cases is to break the total system configuration down into homogeneous subsystems. Then, consider each of these subsys-tems separately as a unit, and calculate their reliabilities. Finally, put these simple units back (via series or parallel recombination) into a single system and obtain its reliability.
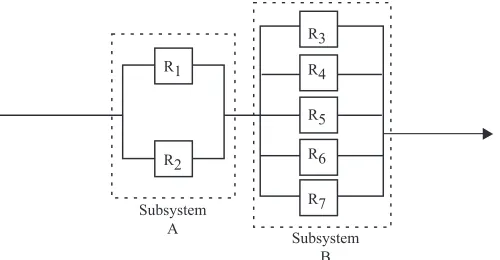
For example, assume that we have a system composed of the combination, in series, of the examples developed in the previ-ous two sections. The first subsystem, therefore, consists of two identical components in parallel. The second subsystem consists of a “2 out of 5” (parallel) redundant configuration, composed of also five identical components (Figure 6). Assume also that Mission Time is T = 10 hours.
Figure 6. A Combined Configuration of Two Parallel Subsystems in Series
Using the same values as before, for subsystem, A (two identical components in parallel, with FR λ= 0.01 and mission time T = 10 hours), we can calculate reliability as:
Similarly, subsystem B (“2 out of 5” redundant) has five identi-cal components, of which at least two are required for the sub-system mission success. R3(1) = R4 (1) = R5 (1) = R6 (1) = R7(1)
= 0.9, for T = 1. We first recalculate the component reliability for the new mission time T = 10 and then calculate subsystem B reliability as follows:
Recombining both subsystems, we get a series system, consist-ing of subsystems A and B. Therefore, the combined system reliability, for mission time T = 10, is:
This result immediately shows which subsystem is driving down the total system reliability and sheds light about possible meas-ures that can be taken to correct this situation.
Summary
The reliability analysis for the case of non-repairable systems, for configurations in series, in parallel, “k out of n” redundant and their combinations, has been reviewed for the case of expo-nentially-distributed lives. When component lives follow other distributions, we substitute the density function in the corre-sponding reliability formulas R(T) and redevelop the algebra. Of particular interest is the case when component lives have an underlying Weibull distribution:
Here, we substitute these values into equations 1 through 5 of the first section and 1 through 6 of the second section and rede-velop the algebra. Due to its complexity, this case will be the topic of a separate START sheet. Finally, for those readers inter-ested in pursuing these studies at a more advanced level, we pro-vide a useful bibliography For Further Study.
For Further Study
1. Kececioglu, D., Reliability and Life Testing Handbook, Prentice Hall, 1993.
2. Hoyland, A. and M. Rausand, System Reliability Theory: Models and Statistical Methods, Wiley, NY, 1994. 3. Nelson, W., Applied Life Data Analysis, Wiley, NY,
1982.
4. Mann, N., R. Schafer, and N. Singpurwalla, Methods for Statistical Analysis of Reliability and Life Data, John Wiley, NY, 1974.
5. O’Connor, P., P ractical Reliability Engineering, Wiley, NY, 2003.
6. Romeu, J.L. Reliability Estimations for Exponential Life, RAC START, Volume 10, Number 7. <http://rac. alionscience.com/pdf/R_EXP.pdf>.
About the Author
Dr. Jorge Luis Romeu has over thirty years of statistical and operations research experience in consulting, research, and teaching. He was a consultant for the petrochemical, construc-tion, and agricultural industries. Dr. Romeu has also worked in statistical and simulation modeling and in data analysis of soft-ware and hardsoft-ware reliability, softsoft-ware engineering, and ecolog-ical problems.
Subsystem
A Subsystem
B R1
R7 R6 R5 R4 R3
R2
[
1-R (10)][
1-R (10)]
-1 10) (
RA = 1 2
[
1-R (10)]
1-(1-0.9048) 0.9909-1 i 2= 2=
=
{ }
X 1 e 0.9 P1) (
Ri = > = -λ=
{
R (1)}
-ln(0.9) 0.105361 ln- i = =
= λ ⇒
{
X 10}
e p P(10)
Ri = > = -λT =
p 0.3487 e
e-0.105361x10= -1.05361= =
=
0.3487) p
5; Tot. j; Succ. ( P
(10)
RB =∑5j=2 = = =
j -5 1
-2
0 j
j n
j0.3487 (1-0.3487)
C -1 ∑
= =
s -10
e 0.5691 0.4309
-1 = = λ
=
0.5639 0.5691 x 0.9909
10) ( R x (10) R
R(10) = A B = =
( ) {
}
β α
= ≤ =
T
-e -1 T X P T F
( )
( )
β α β β
α β = δ =
T -1 -e
Dr. Romeu has taught undergraduate and graduate statistics, operations research, and computer science in several American and foreign universities. He teaches short, intensive profession-al training courses. He is currently an Adjunct Professor of Statistics and Operations Research for Syracuse University and a Practicing Faculty of that school’s Institute for Manufacturing Enterprises.
For his work in education and research and for his publications and presentations, Dr. Romeu has been elected Chartered Statistician Fellow of the Royal Statistical Society, Full Member of the Operations Research Society of America, and Fellow of the Institute of Statisticians.
Romeu has received several international grants and awards, including a Fulbright Senior Lectureship and a Speaker Specialist Grant from the Department of State, in Mexico. He has extensive experience in international assignments in Spain and Latin America and is fluent in Spanish, English, and French.
Romeu is a senior technical advisor for reliability and advanced information technology research with Alion Science and Technology previously IIT Research Institute (IITRI). Since rejoining Alion in 1998, Romeu has provided consulting for several statistical and operations research projects. He has writ-ten a State of the Art Report on Statistical Analysis of Materials
Data, designed and taught a three-day intensive statistics course for practicing engineers, and written a series of articles on sta-tistics and data analysis for the AMPTIAC Newsletter and RAC Journal.
Other START Sheets Available
Many Selected Topics in Assurance Related Technologies (START) sheets have been published on subjects of interest in reliability, maintainability, quality, and supportability. START sheets are available on-line in their entirety at <http://rac. alionscience.com/rac/jsp/start/startsheet.jsp>.
For further information on RAC START Sheets contact the:
Reliability Analysis Center 201 Mill Street
Rome, NY 13440-6916 Toll Free: (888) RAC-USER Fax: (315) 337-9932
or visit our web site at:
<http://rac.alionscience.com>