1 | Jurnal Integrasi | 2012 Vol. 4(1) 1-15 | ISSN: 2085-3858
THE AUDIT EXPECTATION GAP IN INDONESIAN
PUBLIC SECTOR
Rambak Pongsapan University of Cenderawasih
ABSTRACT
The purposes of this study are to tests the existence of the audit expectation gap between financial statement users and the auditors in Financial Auditing Board (BPK) as well as to identify the underlying components. The study is also to examine the difference in perception on the performance of the auditors in Financial Auditing Board (BPK) between financial statement users with basic accounting education and those without that of accounting. There are two hypotheses, as the writer wants them to test. First, there is an audit expectation gap between the financial statement users and the auditors in Financial Auditing Board (BPK), and second, there is the difference in perception on the performance of the auditors in the Financial Auditing Board (BPK) (deficient performance gap) between the financial statement users with basic accounting education and those without that of accounting. The collected data of the study gained through a survey method. They are primary data obtained from respondents as users of the financial statement of local government such as civil servants in local government, members of the House of Representatives at local levels, academics, credit analysts, and the auditors of Financial Auditing Board (BPK) in Yogyakarta. The hypotheses examined by using the Chi Square, Mann-Whitney U test and the T-Test Independent Sample. Result of the hypotheses examination indicates that the financial statement users had understanding more than the auditors did and difference in perception was significant. The financial statement users understand that the auditors have duties ideally more than their actual ones. The examination of the second hypothesis shows that there was a significant difference in perception on the performance of the auditors of Financial Auditing Board (BPK). The perception of financial statement users without that of accounting on the performance of the auditors in the Financial Auditing Board (BPK) tended to be “good”, while
those with that of accounting tended to be “poor”. This research concluded as follows: first, there was audit
expectation gap between the financial statement users and the auditors of Financial Auditing Board (BPK); second, there was the difference in perception on the performance of the auditors of Financial Auditing Board (BPK) between the financial statement users with that of accounting and those without that of accounting
Keywords: Audit Expectation Gap, Deficient Performance Gap, Deficient Performance, Unreasonable Expectation, Deficient Standard, Existing Duties, Non-existing Duties, Auditors of BPK, Users of the Government Financial Statement
I. INTRODUCTION
The raise of criticism on accounting profession regarding the quality and auditor’s performance considered by Liggio (1974) not as a new fact but it has been persisted since the end of 1960. Boyle and Canning (2005) propose that it happened around the world and has put some effect to the weakness attenuate of the audit profession credibility. Porter (1993) states that audit environment fully consisted
by criticism on auditor’s performance are characteristic of audit surroundings at present days, similar to the firm statement suggest by Lee (2007) concerning audit surroundings that still suffered from criticism. The possible causes of this criticism, as firmly stated by Maccarone (1993), are numbers of corporate failure, occurrence of financial scandal, and the failure of audit.
The term of audit expectation gap, first introduce in audit literature by Liggio in the year of
1974 and later followed by lots of researches that has many efforts in order to definitively ensure the existence of audit expectation gap in some countries. Those researches are research by Beck (1974) in England, Gay and Sullivan (1988), Humprey et al. (1993) in England, Pany (1993), Porter (1993) in New Zealand. In Malaysia, it often observed as researches by Chowdhury et al. (2005), Epstein & Greiger (1994), Gloeck & De Jager (1993), Humphrey et al. (1993), Lin & Chin (2004), Fadzly & Ahmad (2004), Dixon et al. (2006), and Lee (2007). The results of those studies support the theoretical literature regarding the existence of audit expectation gap.
The audit environment in Indonesia, particularly
on public sector’s audit at present time, still colored with criticisms on auditor’s performance. In
accordance with the statement addressed by Porter (1993) and Lee (2007), the occurrence of criticisms
Article History
Received 13 February 2012
Accepted 16 March 2012
Jurnal Integrasi
vol. 4, no. 1, 2012, 1-15
2 |
Jurnal Integrasi | 2012 Vol. 4(1) 1-15 | ISSN: 2085-3858 demonstrated by public indicates the existence of audit expectation gap. Some researches observation in public sector at several regions has extended a full theoretical supports, such as researches conducted by Nugroho (2004), Yulianti (2007), and Rulisyawati (2007).Porter (1993) and Deflies et al. (1988) claimed that in order to narrow the expectation gap effectively, the components of gap needs to be ensure as the different components of gap which required differed methods to narrow them. If the results presents the existence of audit expectation gap, the nature of the gap will considered as using three components of audit expectation performance gap presented in the frame work found by Porter (1993), i.e.: i) unreasonable expectation; ii) deficient standard; and iii) deficient performance.
There are limited researches concerning audit expectation gap in Indonesia, particularly on public sectors that specifically test the audit expectation gap as well as to identify its causal components, and observe the impact of accounting education that possibly causes the difference in perception on
auditors’ deficient performance. This research will tests the existence of audit expectation gap on the tasks of Financial Auditing Board (BPK) auditors, the difference in perception of the financial statement users on deficient performance auditor, and identifies its causal components of the audit expectation gap.
II. THEORY BASE AND HYPOTHESIS BUILDING
2.1 Public Sector Auditing
The purpose of this audit is to guarantee the application of public responsibility operated by central or local governments, similar to private sectors audit. According to Jones & Bates (1990), there is a difference on the implementation of both audits, underlies on the base of necessity orientation to report political influence and regulation of related country.
Bastian (2006) states that auditing is an independently investigation to several specific activities. The mechanism of auditing is a mechanism that activates the meaning of accountability on the management of governmental sectors, State-Owned Company (BUMN), or other activa institutions. Meanwhile, the purposes of the tests on financial statement by independent auditors are to state a truthful opinion in regards to the financial position, operation results, and state its cash flow in adequate to accounting principal in general.
2.2 Governmental Financial Statement Users In regards to the issuance of Governmental Accounting Standards (SAP: Standar Akuntansi Pemerintahan) year 2005, there are some primary groups of governmental financial statement users but not as limited as, (1) Society; (2) Representative board, and controlling and auditing agency; (3) Sides who gives or related to the donation, investment, and loan process; and (4) Government.
Halim (2004) specifically states the external parties of Municipal Government as the financial statement users of the Municipal Government. They are: (1) Municipal House of Representatives, (2) Financial Auditing Board (BPK), (3) Investors, Creditors, and Donators, (4) Economic Analyst and Local Government observer, (5) Society of citizenry, (6) State Government, and (7) Other Local Government.
2.3 Research on Expectation Gap
The research by Porter (1993) has put a basic concept that important for academicians in discovering and considering a structural concept to narrow the existence of audit expectation gap, which is seemingly threatening the audit environment. He intends to ensure the existence of audit expectation gap between independent auditors and society of those financial users regarding the auditor’s performance as well as to determine the causal components of expectation gap, and later found an audit expectation gap between auditors and society.
3 |
Jurnal Integrasi | 2012 Vol. 4(1) 1-15 | ISSN: 2085-3858 The research conducted by Lee (2007) found the existence of audit expectation gap that firmly emphasizes previous study observed by Fadzly and Ahmad (2004). It shows the existence of expectation gap between auditor and the position donor regarding the obligation assignment that presented. Hence, this finding is consistent with the explanation given in the framework by Porter (1993) concerning the possible causal of an audit expectation gap.2.4 Audit Expectation Gap at Public Sector in Indonesia
IAI (2004) quotes an opinion suggested by Leman Adi Pranoto that revealed four factors faced by public accountant that is, the development of business environment, expectation gap, negative and positive considering of practices as opportunities, and the high strictness of regulations. The research regarding the existence of expectation gap in Indonesia has often observed by some researchers, either private or public sectors.
Nugroho (2004) found that there is a difference in perception between government auditors and financial statement users on governmental auditing (members of the Municipal House of Representatives). He also found two other facts that there is a difference in perception between financial statement users on private sector auditing and governmental financial statement users, and there is no difference in perception between one financial statement users of municipal government to another. This is because the education level of the members of the Municipal House of Representatives is relatively similar to one another.
Yulianti et al. (2007) conducted a research to tests the existence of audit expectation gap on public sectors. The observed variables are the perception of governmental financial statement users and government auditors regarding the role and responsibility of auditors. Instrument used in that research is questionnaire developed by Gramling et al. (1996). The result distributes empirical evidence concerning the existence of audit expectation gap between government auditors and financial statement users on the role and responsibility of the auditors.
Rulisyawati (2007) conducted a research on audit expectations gap at public sectors between the Financial Auditing Board (BPK) auditors and municipal financial statement users. It concluded that there is a difference in perception between the auditors and the users, which is members of House of Representatives, municipal government, and society.
The differences in perception are financial statement, accountability, and auditing concepts, show the existence of audit expectation gap between the auditors and the users.
2.5 Frame of Idea and Hypothesis Building Some supporting theoretical literatures regarding the audit expectations gap revealed in the researches conducted by Beck (174) & Humprey et al. (1993) in England, Gay & Sullivan (1988), and Pany (1993). They carried out significant discoveries that there is an existence of audit expectation gap on
auditor’s responsibility and that position donor or sides having interests on audit reports possess higher expectation rather than the actual obligatory duties of the auditor.
Porter (1993) & Deflies et al. (1988) claim that components of gap must be confirm in order to narrow the expectation gap effectively. This is because the differed components of gap required different methods to narrow. If the result shows the existence of audit expectation gap, the nature of the gap will definite into three components of expectation performance gap audit in the framework by Porter (1993), i.e.: 1) unreasonable expectation; 2) deficient performance ; and 3) unreasonable expectation. The researches by Fadzly & Ahmad (2004), Porter et al. (2005), and Lee (2007) own positive view on the existence of expectation gap, which adopted and developed the framework by Porter (1993) and intended to firm the existence of audit expectation gap and to seek for problem solution.
Those researches specifically contributing empirical evidence regarding the existence of audit expectation gap between auditors, audited, and audit beneficiaries’ concerning the presented auditors’ duties. The results state that the existence of audit expectation gap caused by two factors: 1) the lack of awareness from auditors to recognize their actual duties that can causes them to operate bellow existed standards; 2) the users’ higher expectation on
auditors’ duties than the existed duties determined by law and professionals, rationally or irrationally.
4 |
Jurnal Integrasi | 2012 Vol. 4(1) 1-15 | ISSN: 2085-3858regulation maker’s competency and political factors
that strongly reiterate so that they can cause the duties mandated in audit regulation assume as inappropriate to the expectation of the governmental financial statement users.
The low level of knowledge possessed by the society or the users of financial statement stimulates different interpretations on the duties of Financial Auditing Board (BPK) auditors, even further stimulates irrational expectations on the
auditors’ duties that impossible to conduct. Besides that, the competency of the auditors, lack of personals, limited budget, and the strong political pressure can cause the auditors to operate in under-standard performance (deficient performance auditors). Finally, it will trigger higher increasing on the problems of audit expectation gap at Indonesia’s public sectors.
In accordance with the frame of theoretical base explained above, thus the first Hypothesis proposed in this research stated as follows.
H1: There is an audit expectation gap between the Financial Auditing Board (BPK) auditor and the governmental financial statement users on auditor’s duties presented
Since the causal components of audit expectation gap has successfully classified by Porter, the topic regarding accounting education function and its impact on audit expectation gap have been discussed in some literatures by years. Experts begin to carry out suggestions on accounting education in narrowing the extended problems on audit expectation gap. According to Monroe and Woodliff (1993), education has positive influence in cutting out expectation gap.
In Indonesia, the finding on the research conducted by Nugroho (2004) contributes important recommendation that the difference in perception between Financial Auditing Board (BPK) auditors and public and members of legislative are higher than the difference in perception between the auditors and credit analyst that caused by the different level of education. This is consistent to previous researches by Sikka et al. (1992), Monreo & Woodliff (1993), and Ferguson et al. (2000) which state that accounting education may narrow the expectation gap, particularly on the unreasonable expectation components.
The framework developed by Porter (1993) addressed that one of the components of audit
expectation gap is gap between the existed auditor’s
duties and auditor’s performance experienced by a group of society (gap performance deficient). Boyle & Canning (2005) state that education has function of conflicts, reducing unreasonable expectation component on one side, but increasing bad perception on deficient performance auditor on other side at specific condition. Boyle & Canning (2005) found that there is a difference in perception on deficient performance auditors between respondents’ causes by the different level of auditing. Based on that reason, thus second Hypothesis proposed as follows. H2: There is a difference in perception (deficient performance gap) between financial statement users with accounting education and those without that of accounting on auditors’ performance
III. RESEARCH METHODOLOGY 3.1 Population and Research Sampling
The population includes a group of Financial Auditing Board (BPK) auditors and a group of governmental financial statement users in the municipal government of Yogyakarta. The detail of respondents involved in this research is orderly pile as follows.
3.1.1 The official auditor assigned from the governmental institution, which is Representation III of Financial Auditing Board (BPK) in Yogyakarta.
3.1.2 Financial statement audit users at governmental sectors, that is:
1. Members of The Municipal House of Representatives consist of Provincial Government of Yogyakarta, Municipal Government of Yogyakarta, Municipal House of Representatives at Sleman Regency, and Municipal House of Representatives at Batul Regency. 2. Members of the Municipal Government
that is echelon 2, echelon 3, and echelon 4 functionaries, and members of Bawasda and BPKD.
3. Members of the society consist of academician, university students, and credit analyst.
3.2 Data Collecting Method
5 |
Jurnal Integrasi | 2012 Vol. 4(1) 1-15 | ISSN: 2085-3858 gained through a direct questionnaire spread to the Financial Auditing Board (BPK) auditors, members of the Municipal House of Representatives, government employees, and to the members of society.The questionnaire designed to tests two questions revealed. First, is there audit expectation gap between Financial Auditing Board (BPK) auditors and financial statement users, existed or non-existed? Second, is there a difference in perception between users with accounting education and those without that of accounting on the deficient performance auditors? Moreover, the questionnaire intends to identify auditor deficient performance in implementing the existed duties and identify
auditor’s duties that expected to exist. Thus, the questionnaire design in this research divided into two main parts, described as follows.
a. The first part questioned for personal identity including sex, age, and level of education, study program, and audit comprehension and experience.
b. The second part consists of auditor’s duties statements including 20 auditors’ existed duties and 12 auditors’ non-existed duties. This questionnaire later orderly stack in three sections, listed as follows.
1. First section is asking if the presented auditor’s duties represent the existed duties of the auditors. The estimation scale used in this section is nominal scale. The questions given to the respondents are multiple choices as answers of yes and no questions, with estimation values of two and one. 2. Second part is asking if the presented duties
expected to be an obligatory mandates for the auditor’s duties. The estimation scale used in this section is similar to the asked questions in the first section (nominal scale). The questions given to the respondents are multiple choices as answers of yes and no questions, with estimation values of two and one.
3. Third section is correlating in regards to the
respondents’ evaluation on auditors’
performance in performing the existed duties. The estimation scale used in this section is ordinal scale. At this section, respondents proposed five choices in evaluating the auditors’ performance in operating the existed duties, that is: 1) very good; 2) good; 3) sufficient; 4) bad; and 5)
very bad. Each of this answer estimated as values of 5, 4, 3, 2 and 1.
3.3 Operational Definition
a. Audit expectation gap is the difference in perception between auditors and governmental financial statement users on the auditors’ duties. b. Deficient Performance Gap is the difference in
perception enhanced by the governmental financial statement users on auditors’ performance.
c. Deficient Performance is the difference in working performance experienced by a group of societies on the auditors’ duties within the audit regulation.
d. Deficient standard is the gap occurred between rational expectations from the group of societies (gained benefits if implemented) and the existed
auditor’s responsibility, that defined by law and professionals’ decree.
e. Unreasonable Expectation is the irrational expectations to be implementing, viewed from financial aspect (gained less benefits duties if implemented).
f. The existed auditors’ duties are mandate duties reiterate to the auditors’ responsibility based on
the Indonesia’s governmental audit regulation.
g. Non-existed duties are duties that are neither not yet exist or not yet assessed within the auditing regulation in Indonesia as mandated duties of auditors.
h. Financial statement users are a group that owns interests on the governmental financial statement that consists of Municipal Government, Credit
Analysts, Regional Government, and
Academicians.
3.4 Research Variables
Two variables that observed in this research are first, audit expectation gap estimated based on the perception comprehension on the Financial Auditing Board (BPK) auditors’ duties, and the second is deficient performance gap estimated in accordance with the perception of the governmental financial statement users on the Financial Auditing Board
(BPK) auditors’ performance. The questionnaire
instrument used in this research divided into two categorizes.
1. The questionnaire instrument regarding the
existed auditors’ duties carried out from the mandated Financial Auditing Board (BPK)
6 |
Jurnal Integrasi | 2012 Vol. 4(1) 1-15 | ISSN: 2085-3858 regulations in public sectors in Indonesia. Those regulations are order as follows. First, Constitution 1945 Chapter VIII A in regards to the Financial Auditing Board (BPK). Second, the State Law No.17 year 2003 regarding State Financial, the State Law No. 15 year 2004 concerning the Auditing ofFinancial State Management and
Responsibility, and the State Law No. 15 year 2006 about Financial Auditing Board (BPK); and third, the Technical Auditing Instruction of the State Financial Auditing Board (BPK).
2. The questionnaire instrument regarding the non-existed auditors’ duties carried out using the questionnaires presented by Lee (2007), Dixon and Woodhead (2006), Hudaib (2003), McEnroe and Martens (2001), and Monroe & Woodcliff (1994), and later appropriated in congruity as adequate as the context of public sectors in Indonesia.
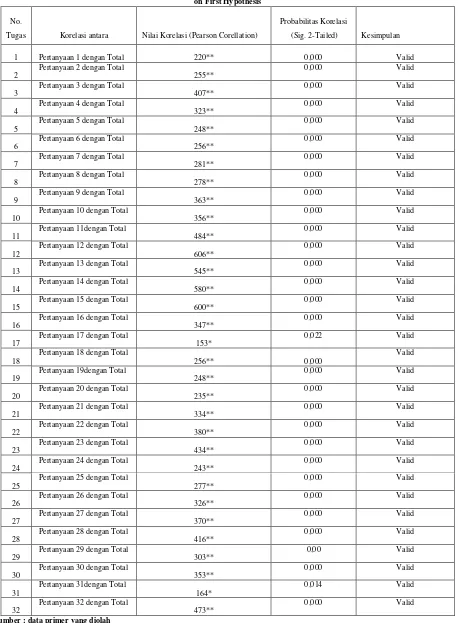
3.5 The Technique of Data Examination Validity test shows the capability level of an instrument in uttering something that used as estimation object conducted by that of instrument. The approaching method used in this research is validity construct that is by correlating scores on each item with total score. The reliability test is use in order to find out by means of estimation instrument unhampered from bias, so that it can provides consistently estimation result between inter-times and items within an instrument. The reliability test in this research conducted using internal consistency method with Cronbach’s Alpha.
The test of Hypothesis in this research is using Chi-Square Test, Mann-Whitney U Test, and T-Test Independent Sample while the technique of data analysis conducted using the support assistance of computer software program that is SPSS Version 1.5 for Windows. In regards to identifying the components of audit expectation gap particularly on
auditors’ performance that formed as deficient performance or even further on the existed auditors’ duties expectation, this research refers to the research conducted by Lee (2007).
In order to find out deficient performance, we may look at the mean value that is bellow than three, and later investigates exploration of the
number of respondents’ answers that 25% of them
consider it as bad. Hence, it categorized as elements
of deficient performance. At the same time, the existed auditors’ duties expectation identified based on the proportion of respondents’ answers. If there are 25% of respondents consider that the non-existed
auditors’ duties should be present as existed auditors’ duties, thus it consider as auditors’ duties that
expected to be exist.
IV. ANALYSIS AND DISCUSSION
The data collecting carried out through the distribution of questionnaire lists to the respondents. Total questionnaires that distributed to the respondents are 350 exemplars. From those 350 exemplars, there are 264 exemplars returned by respondents that are 145 exemplars of financial statement users and 119 exemplars of the Financial Auditing Board (BPK) auditors. Nevertheless, the possible use exemplars are only 225 exemplars consists of 120 financial statement users and 105 Financial Auditing Board (BPK).
4.1 Discussion of the First Hypothesis
In accordance to the test result on the first Hypothesis, it concluded that there is an audit expectation gap between the group of financial statement users and the Financial Auditing Board
(BPK) auditors on auditors’ duties. Both results, either under the Chi Square or under T-Test, support the first Hypothesis that there is an audit expectation gap between the Financial Auditing Board (BPK) auditors and the financial statement users.
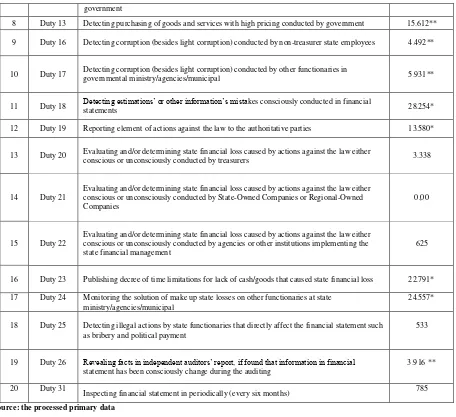
From the result of the Chi Square test on 32 duties of auditors, it demonstrates that there are 23 duties or as big as 72% that significantly different. The numbers of 23 different duties explained above divided into 11 existed duties as shown in Table 5, and 12 non-existed duties as presented in Table 6. The Chi Square test also shows that the perception of
the financial statement users on auditors’ duties is
over exceeding the actual duties that assumed to be the mandated responsibility of the Financial Auditing Board (BPK) auditors. Thus, 11 duties assumed as existed duties from those 12 non-existed duties. This difference is significant on the 0.01 significant levels.
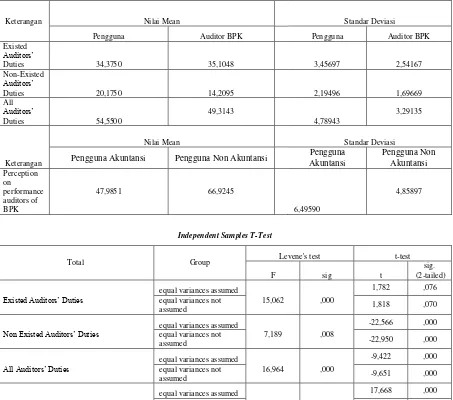
The T-Test result on all of the 32 auditors’ duties shows that there is a significant difference in perception and that the mean value of the financial statement users is 54.5500 bigger than the mean value of the Financial Auditing Board (BPK) auditors that is 49.3143 (Table 8). It summarize that the
financial statement users’ perception is over
exceeding the perception of the Financial Auditing
7 |
Jurnal Integrasi | 2012 Vol. 4(1) 1-15 | ISSN: 2085-3858 and Kilcommins (1996) distinctly resolute their statement that audit expectation gap happens by the time when there is a difference occurrence between an external auditors’ perception regarding their roles and tasks and groups of users and public.After conducting analysis on the tests that applied separately between existed and non-existed duties, found that the main cause of the difference in perception between financial statement users and Financial Auditing Board (BPK) auditors is that the financial statement users understand the non-existed duties as the tasks of the Financial Auditing Board (BPK) auditors. This findings supported by the T-Test result on non-existed duties that significantly different. Moreover, the perceptions of both groups of respondents for existed duties show that there is no significant difference as figured in Table 8.
Although the T-test result on existed duties (Table 8) shows that there is no significant difference
between financial statement users’ perception and the Financial Auditing Board (BPK) auditors’
perception, the identification result on every existed duty demonstrates that there are 4 duties (8, 13, 18, and 25) that failed to be recognize by Financial Auditing Board (BPK) auditors as their duties.
There are three of the 4 duties that directly
affect the Financial Auditing Board (BPK) auditors’
performance that is the 13th, 18th, and 25th duties.
Those three duties are the duties that available for auditing investigation. The writer assumes there is a strong possibility that respondents of the Financial Auditing Board (BPK) auditors have neither experiencing nor mastering formal education regarding the investigation audits. This assumption
stated based on the most 75% respondents’ working
experience of the Financial Auditing Board (BPK) auditors that had just one to five year experience.
A disclosure revealed that the cause of the non-satisfaction’s users on the Financial Auditing Board (BPK) auditors’ performance is not only cause by auditors’ failure to recognize their duties. There are 16 duties considered by financial statement users as bad (Table 9). There are only four of those 16 duties (22.2%) that failed to be recognize (more than 30% auditors assumed those duties as not their obligatory duties), and 77.8% recognized by auditors as their mandated duties.
The result have gave an important understanding that in addition to the auditors’ knowledge factor, there are still other existed factors
that can affect the auditors’ performance which may not comply with the request of the financial statement
users’ expectation (deficient performance). Hence, those factors may be more dominant as shown with the percentage value of 77.8% than or as equal as 12 duties (5, 6, 9, 16, 17, 19, 20, 21, 22, 24, 26, and 31) of the total duties considered as deficient.
There are some factors that compatible for conditions in Indonesia, which is may be negatively affecting the auditors’ performance. One of them is
auditors’ independency factor. The low level of the Financial Auditing Board (BPK) auditors may caused by the occurrence of internal interference departed from auditors such as familial atmosphere consideration as the impact of Indonesia’s culture. The other causal factor is the external interferences, that is the limitation process of inspection scope, external parties interfering on assignments, and even further the political threats. In addition to the
auditors’ independencies, underlies other factors such as the lack of the Financial Auditing Board (BPK) auditors, budget limitation, and limited time span of auditing.
There are 11 duties expected to exist by financial statement users (Tabel 10). The writer suggests several duties to be consider in order to the issuance of the Financial Auditing Board (BPK)
auditors’ duties. Some of them are duties 3, 4, 11, 12, 14, and 15. Based on the number of duties, the financial statement users expect the Financial Auditing Board (BPK) auditors to perform transactions verification, deviation detection, failure, and deceitful revealing, or preventive actions on overall transactions, material or immaterial on every financial statement.
Corruption conducted by governmental apparatus at highest to lowest level is one reason, which the writer suggested that financial statement auditing to focus not only on material transactions. This material element consideration can also stipulates bad habits in short-term and negatively affecting apparatus’ behavior in long-term period. The small but high frequencies of deviations may cause big deficits or financial loss to the country.
Increasing criticism on auditors’
8 |
Jurnal Integrasi | 2012 Vol. 4(1) 1-15 | ISSN: 2085-3858 The other important discovery in this research is that the accounting education is capable of lowering the audit expectation gap. The difference in perception between auditors and the financial statement users with accounting education are smaller than the difference in perception on those without that of accounting education. This results presented by additional test using the One Way Anova that shows the difference in perception between those three groups existed significantly in the significant level of 1%. The mean value for those with accounting education and auditors has smaller difference as comparison to the difference among those without that of accounting education and the Financial Auditing Board (BPK) auditors. This findings is consistent with Sikka et al. (1992); Porter (1993); Monreo and Woodliff (1993); (2000); Nogroho (2004); and Lee (2007).4.2 Discussion of Second Hypothesis
Based on the test result of the second Hypothesis concluded that there is a difference in perception between the financial statement users group with accounting education and those without that of accounting education on the Financial Auditing Board (BPK) auditors’ performance (deficient performance gap). According to the Uji T-Test (Table 8), gained a result that both group’s perceptions are significantly different in significant level of 0.01. The users group without accounting
education tends to evaluate auditors’ performance as
satisfying, while those with that of accounting education evaluate as less satisfying.
The low understanding of the financial statement users without accounting education affects the lack of skepticism on the Financial Auditing Board (BPK) auditors’ performance that may become bad. It caused those without that of accounting tend
to evaluate auditors’ performance as better. The other
possibility that affects users without accounting
education in evaluating auditors’ performance as
good is because the respondents without that of accounting dominated by respondents involved in the government that is Municipal employees and members of the House of Representatives. This finding consistent to Yulianti et al. (2007) which is also using respondents of financial statement users consist of Municipal employees and members of Municipal House of Representatives. Their
perceptions are better than public’s perception.
The Hypothesis result will offers important understanding to the problem solving of the audit
expectation gap in public sectors. This is consistent with Boyle and Canning (2005) that education owns function of conflicts, that is reducing unreasonable expectation components, but increasing bad
perception on auditors’ deficient performance. Limperg (1933) which is quoted by Porter & Gowthorpe (2001) suggests that in order to reduced criticism on the Financial Auditing Board (BPK)
auditors’ performance, thus the auditors should be able in recognizing levels that they have to reach in fulfilling expectations. Porter (1993) expressed more to recognizing the satisfaction level of society that is rational to be satisfied.
V. CONCLUSIONS AND IN CLOSING 5.1 Conclusions
Based on the data analysis and discussion presented in Chapter IV, thus the conclusion of this research explained as follows.
1. There is an audit expectation gap between financial statement users and the Financial Auditing Board (BPK) auditors in public sectors. This is in accordance to the result of T-Test on
overall auditors’ duties that there is a difference in perception between the auditors and the financial statement users at significance level of 1%. The result of Chi-Square test on overall
auditors’ duties (32 duties) there are 32 duties that significantly different. The difference in perception between the Financial Auditing Board (BPK) auditors and the financial statement users is because the users own an over exceeding
understanding on actual auditors’ duties, supported by the T-Test result of non-existed duties that has difference significant level at 1%, while for existed duties are not significant. 2. There is a difference in perception on auditors’
9 |
Jurnal Integrasi | 2012 Vol. 4(1) 1-15 | ISSN: 2085-3858 3. This research found that the causal componentsof audit expectation gap are first, components of deficient performance, viewed that there are 16 duties or 80% from 20 existed duties were identified as the components of deficient performance. The second causal component of audit expectation gap is that the financial statement users expected the Financial Auditing Board (BPK) auditors to perform duties exceeding their actual duties that mandated as their duties as the Financial Auditing Board (BPK) auditors (components of deficient standard and unreasonable expectation). This is a conclusion based from the finding that there are 11 of 12 non-existed duties that expected by auditors to be the duties of the Financial Auditing Board (BPK) auditors.
5.2 Suggestions
1. In order to narrow the problem of audit expectation gap in public sectors in Indonesia, it is better that audit regulations extended the
auditors’ duties with consideration of the rational
expectations come from the financial statement users and society. Socialization and publication of information on the detailed duties of the Financial Auditing Board (BPK) auditors, including duties limitation, must be conducted in order to cut the over exceeding expectation. 2. It is better that the research area can be extend so
that the result may have higher generalization capacity and adding up respondents group for the governmental financial statement users group, particularly those who contribute many efforts on audit expectation gap problem in public sectors in Indonesia.
BIBLIOGRAPHY
BPK Republik Indonesia, 2007, ”Standar
Pemeriksaan Keuangan Negara”.
Bastian, 2007, ”Audit Sektor Publik”, Penerbit
Salemba Empat. Yogyakarta.
Beck, G. 1974, “Public Accountants in Australia
-Their Social Role”, Melbourne; Australian
Accounting Research Foundation
Boyle, D., and Canning, M., 2005, “The Impact of Education on Perceptions of Deficient
Auditor Performance” The Irish Accounting
Review , Vol. 12, No. 1, 15-37.
Chowdhury, R., Innes, J. Kouhy, R., 2005, “The
public sector audit expectation gap in
Bangladesh” Managerial Auditing Journal.
Vol 20. No 8. pp 893-905.
Cohen Commission, “Commission on Auditors’ Responsibilities”,1978, Report, Conclusions
and Recommendations. New York, AICPA. Deflies, P. Jaenicke, U. & Hirch, M., 1998,
“Auditing”, Eleventh Edition, John
Willey & Son.
Dixon, R. and Woodhead, A., 2006, “An investigation of the expectation gap in
Egypt”, Managerial Auditing Journal, Vol
21. No 3. pp 293-302.
Epstein, M. & Geiger, M., 1994, “Investor views of
audit assurance: Recent evidence of the
expectation gap”, Journal of Accountancy,
Vol 177. No 1. pp 60-66.
Fazdly, M. and Ahmad, Z., 2004, “Audit expectation gap: The case of Malaysia” Managerial
Auditing Journal, Vol 19. pp 897-915.
Gloeck, J.D & De Jager, H., 1993, “The audit expectation gap in South Africa. School of Accountancy Research Series. Research
Report”, University of Pretoria.
Guy, D. M and J. D., Sullivan, 1988, “The
Expectation Gap Auditing Standards”, The journal of accountancy, 165, 36-46.
Halim, Abdul, 2004, “Akuntansi Keuangan Daerah”,
Salemba Empat, Jakarta.
Hudaib , M., Haniffa , R., 2002, “An Empirical Investigation of Audit Perceptions Gap in
Saudi Arabia”, Working Paper no. 02/03,
University of Exeter, ISSN 1473 2904.
Humphrey, C. Moizer, P. & Turley, W., 1993, “The
audit expectation gap in Britain: an empirical investigation. Accounting and
Business Research”, Vol 23. pp 395-411.
IAI, 2001,”Standar Profesional Akuntan Publik”,
Salemba Empat, Jakarta.
Jones & Bates, 1990. Publik Sektor Auditing: Practical Techniques for An Integrated Approach, Chapmen and Hall, London.
Lee, T. H., 2007, “The Audit Expectation Gap: An Empirical Study In Malaysia”, University
10 |
Jurnal Integrasi | 2012 Vol. 4(1) 1-15 | ISSN: 2085-3858Liggio, C. 1974, “The expectation gap: the accountant’s Waterloo”, Journal of
Contemporary Business, Vol 3. pp 27-44. Lin, Z. dan Chen, F., 2004, “An empirical study of
audit expectation gap in
China”,International Journal of Auditing”
Vol 8. pp 93-115.
Maccarrone, E. 1993, “Using the expectation gap to close the legal gap”, CPA Journal. Vol 63. pp 10-16.
McEnroe, J.E.,& S.C., Martens, S.C., 2001,
“Auditors' and investors' perceptions of the expectation gap”, Accounting Horizons (December), 345-358.
Monroe, G.S. and Woodliff, D.R., 1994, “An
empirical investigation of the audit
expectation gap: Australian evidence”,
Accounting and Finance 34, 47-74.
Nugroho, K. A., 2004, “Analisis atas Expectation
Gap pada Profesi Pengauditan
Pemerintahan”, Thesis program pasca sarjana tidak dipublikasikan, Universitas Gajah Mada, Yogyakarta.
Pany, K. 1993, “Expectation of the Audit function”, “Auditing”, The CPA Journal [On-line] Available http://www.nysscpa.org.
PP No. 24/2004. SAP (Standar Akuntansi Pemerintahan). Jakarta, Pustaka Pergaulan.
Pierce, B. & Kilcommins, M., 1996, “The Audit Expectation Gap: The Role of Auditing
Education”, DCUBS research papers 1995-1996, No. 13.
Porter, B. 1993, “An empirical study of the audit
expectation-performance gap”, Accounting and Business Research. Vol 24. pp 49-68.
Porter, B. and Gowthorpe, C., 2001, “The audit expectation-performance gap: Some new evidence from the United Kingdom”, Paper presented at the National Auditing Conference, Leicester, March 2001. [Online accessed 16 August 2005]
Rulisyawati, 2007, “Peninvestigasaian Audit
Expectation Gap pada Sektor Publik. Thesis
program pasca sarjana tidak
dipublikasikan”, Universitas Gajah Mada, Yogyakarta.
Yulianti, R., Winarna, J., Setiawan, D., 2007,
“Expectation Gap Antara Pemakai Laporan Keuangan Pemerintah Dan Auditor
Pemerintah”, Simposium Nasional
11 |
Jurnal Integrasi | 2012 Vol. 4(1) 1-15 | ISSN: 2085-3858Table 1: The Result of Validity Test on First Hypothesis
No.
Tugas Korelasi antara Nilai Korelasi (Pearson Corellation)
Probabilitas Korelasi
(Sig. 2-Tailed) Kesimpulan
1 Pertanyaan 1 dengan Total 220** 0,000 Valid
2 Pertanyaan 2 dengan Total 255** 0,000 Valid
3
Pertanyaan 3 dengan Total
407**
0,000 Valid
4 Pertanyaan 4 dengan Total 323** 0,000 Valid
5 Pertanyaan 5 dengan Total 248** 0,000 Valid
6 Pertanyaan 6 dengan Total 256** 0,000 Valid
7 Pertanyaan 7 dengan Total 281** 0,000 Valid
8
Pertanyaan 8 dengan Total
278**
0,000 Valid
9 Pertanyaan 9 dengan Total 363** 0,000 Valid
10 Pertanyaan 10 dengan Total 356** 0,000 Valid
11 Pertanyaan 11dengan Total 484** 0,000 Valid
12
Pertanyaan 12 dengan Total
606**
0,000 Valid
13 Pertanyaan 13 dengan Total 545** 0,000 Valid
14 Pertanyaan 14 dengan Total 580** 0,000 Valid
15 Pertanyaan 15 dengan Total 600** 0,000 Valid
16 Pertanyaan 16 dengan Total 347** 0,000 Valid
17 Pertanyaan 17 dengan Total 153* 0,022 Valid
18 Pertanyaan 18 dengan Total 256** 0,000 Valid
19 Pertanyaan 19dengan Total 248** 0,000 Valid
20 Pertanyaan 20 dengan Total 235** 0,000 Valid
21
Pertanyaan 21 dengan Total
334**
0,000 Valid
22 Pertanyaan 22 dengan Total 380** 0,000 Valid
23 Pertanyaan 23 dengan Total 434** 0,000 Valid
24 Pertanyaan 24 dengan Total 243** 0,000 Valid
25
Pertanyaan 25 dengan Total
277**
0,000 Valid
26
Pertanyaan 26 dengan Total
326**
0,000 Valid
27 Pertanyaan 27 dengan Total 370** 0,000 Valid
28 Pertanyaan 28 dengan Total 416** 0,000 Valid
29 Pertanyaan 29 dengan Total 303** 0,00 Valid
30
Pertanyaan 30 dengan Total
353**
0,000 Valid
31 Pertanyaan 31dengan Total 164* 0,014 Valid
32 Pertanyaan 32 dengan Total 473** 0,000 Valid
12 |
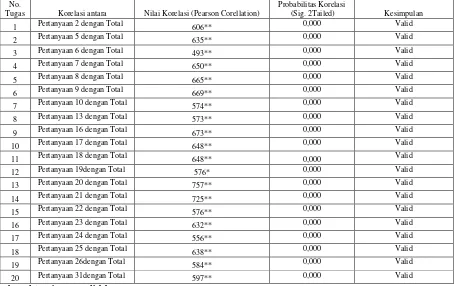
Jurnal Integrasi | 2012 Vol. 4(1) 1-15 | ISSN: 2085-3858Table 2: The Result of Validity Test on Second Hypothesis No.
Tugas Korelasi antara Nilai Korelasi (Pearson Corellation)
Probabilitas Korelasi
(Sig. 2Tailed) Kesimpulan
1 Pertanyaan 2 dengan Total 606** 0,000 Valid
2 Pertanyaan 5 dengan Total 635** 0,000 Valid
3 Pertanyaan 6 dengan Total 493** 0,000 Valid
4 Pertanyaan 7 dengan Total 650** 0,000 Valid
5 Pertanyaan 8 dengan Total 665** 0,000 Valid
6 Pertanyaan 9 dengan Total 669** 0,000 Valid
7 Pertanyaan 10 dengan Total 574** 0,000 Valid
8 Pertanyaan 13 dengan Total 573** 0,000 Valid
9 Pertanyaan 16 dengan Total 673** 0,000 Valid
10 Pertanyaan 17 dengan Total 648** 0,000 Valid
11 Pertanyaan 18 dengan Total 648** 0,000 Valid
12 Pertanyaan 19dengan Total 576* 0,000 Valid
13 Pertanyaan 20 dengan Total 757** 0,000 Valid
14 Pertanyaan 21 dengan Total 725** 0,000 Valid
15 Pertanyaan 22 dengan Total 576** 0,000 Valid
16 Pertanyaan 23 dengan Total 632** 0,000 Valid
17 Pertanyaan 24 dengan Total 556** 0,000 Valid
18 Pertanyaan 25 dengan Total 638** 0,000 Valid
19 Pertanyaan 26dengan Total 584** 0,000 Valid
20 Pertanyaan 31dengan Total 597** 0,000 Valid
Sumber : data primer yang diolah
Table 3: The Result of Reliability Test on First Hypothesis
Reliability Statistics
Cronbach's Alpha N of Items
,779 36
Table 4: The Result of Reliability Test on First Hypothesis
Reliability Statistics
Cronbach's Alpha N of Items
,934 24
Table 5: The Result of Chi-Square Test on the Existed Auditors’ Duties
No No. of
Duties Statement of Auditors’ Duties
Chi-Square
Test
1 Duty 2 Evaluating internal government’s controlling system 16.497*
2 Duty 5 Discussing findings as appropriate as the Inspection Standard 3.563
3 Duty 6 Arranging the reported auditing consists of opinions, recommendation, and findings 1.226
4 Duty 7 Carry out the findings to the DPR, DPD, and DPRD 56.001*
5 Duty 8 Carry out the findings to the President, Governor, Regent/Mayor 11.285**
6 Duty 9 Monitoring the next action on the results towards recommendation of findings 668
13 |
Jurnal Integrasi | 2012 Vol. 4(1) 1-15 | ISSN: 2085-3858 government8 Duty 13 Detecting purchasing of goods and services with high pricing conducted by government 15.612**
9 Duty 16 Detecting corruption (besides light corruption) conducted by non-treasurer state employees 4.492**
10 Duty 17 Detecting corruption (besides light corruption) conducted by other functionaries in
governmental ministry/agencies/municipal 5.931**
11 Duty 18 Detecting estimations’ or other information’s mistakes consciously conducted in financial
statements 28.254*
12 Duty 19 Reporting element of actions against the law to the authoritative parties 13.580*
13 Duty 20 Evaluating and/or determining state financial loss caused by actions against the law either conscious or unconsciously conducted by treasurers 3.338
14 Duty 21
Evaluating and/or determining state financial loss caused by actions against the law either conscious or unconsciously conducted by State-Owned Companies or Regional-Owned Companies
0,00
15 Duty 22
Evaluating and/or determining state financial loss caused by actions against the law either conscious or unconsciously conducted by agencies or other institutions implementing the state financial management
625
16 Duty 23 Publishing decree of time limitations for lack of cash/goods that caused state financial loss 22.791*
17 Duty 24 Monitoring the solution of make up state losses on other functionaries at state ministry/agencies/municipal
24.557*
18 Duty 25 Detecting illegal actions by state functionaries that directly affect the financial statement such as bribery and political payment
533
19 Duty 26 Revealing facts in independent auditors’ report, if found that information in financial statement has been consciously change during the auditing
3.916 **
20 Duty 31
Inspecting financial statement in periodically (every six months) 785
Source: the processed primary data
Table 6: The Result of Chi-Square
Test on Non-Existed Auditors’ Duties
No No. of Duties Statement of Auditors’ Duties Chi-Square Test
1 Duty 1 Preparing governmental financial statement 23.507*
2 Duty 3 Verified every transaction estimation 64.726*
3 Duty 4 Auditing all of governmental cash flow 64.726*
4 Duty 11 Preventing deviations and falls in governmental institutions 47.301*
5 Duty 12 Detecting all deviations in Governmental institutions 37.948*
6 Duty 14
Revealing every mistake in managing nation’s assets on the
auditors’ reports 54.939*
7
Duty 15
Detecting light corruption conducted by non-treasurer state employees or other functionaries in governmental ministry/agencies/municipal
63.777*
8 Duty 27
Guarantee that financial statement audited (clean) and
financially responsible 25,893*
9
Duty 28
Report privately specific to the authoritative parties (State Police Department and KPK) if suspicion occurs during auditing
116.680*
10 Duty 29
Designing accounting system and internal controlling
system 50.235*
11 Duty 30 Implementing public controlling 106.311*
14 |
Jurnal Integrasi | 2012 Vol. 4(1) 1-15 | ISSN: 2085-3858 APBN and APBDSource: the processed primary data
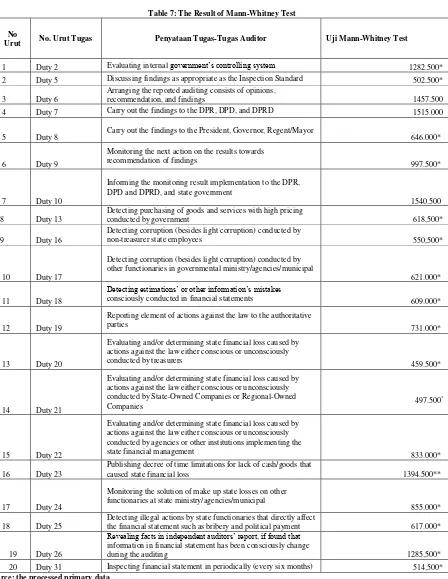
Table 7: The Result of Mann-Whitney Test
No
Urut No. Urut Tugas Penyataan Tugas-Tugas Auditor Uji Mann-Whitney Test
1 Duty 2 Evaluating internal government’s controlling system 1282.500*
2 Duty 5 Discussing findings as appropriate as the Inspection Standard 502.500*
3 Duty 6
Arranging the reported auditing consists of opinions,
recommendation, and findings 1457.500
4 Duty 7 Carry out the findings to the DPR, DPD, and DPRD 1515.000
5 Duty 8 Carry out the findings to the President, Governor, Regent/Mayor 646.000*
6 Duty 9
Monitoring the next action on the results towards
recommendation of findings 997.500*
7 Duty 10
Informing the monitoring result implementation to the DPR, DPD and DPRD, and state government
1540.500
8 Duty 13
Detecting purchasing of goods and services with high pricing
conducted by government 618,500*
9 Duty 16
Detecting corruption (besides light corruption) conducted by
non-treasurer state employees 550,500*
10 Duty 17
Detecting corruption (besides light corruption) conducted by other functionaries in governmental ministry/agencies/municipal
621.000*
11 Duty 18
Detecting estimations’ or other information’s mistakes
consciously conducted in financial statements 609.000*
12 Duty 19
Reporting element of actions against the law to the authoritative
parties 731.000*
13 Duty 20
Evaluating and/or determining state financial loss caused by actions against the law either conscious or unconsciously conducted by treasurers
459.500*
14 Duty 21
Evaluating and/or determining state financial loss caused by actions against the law either conscious or unconsciously conducted by State-Owned Companies or Regional-Owned
Companies 497.500
*
15 Duty 22
Evaluating and/or determining state financial loss caused by actions against the law either conscious or unconsciously conducted by agencies or other institutions implementing the
state financial management 833.000*
16 Duty 23
Publishing decree of time limitations for lack of cash/goods that
caused state financial loss 1394.500**
17 Duty 24
Monitoring the solution of make up state losses on other functionaries at state ministry/agencies/municipal
855.000*
18 Duty 25
Detecting illegal actions by state functionaries that directly affect
the financial statement such as bribery and political payment 617.000*
19 Duty 26
Revealing facts in independent auditors’ report, if found that information in financial statement has been consciously change
during the auditing 1285,500*
20 Duty 31 Inspecting financial statement in periodically (every six months) 514,500*
Source: the processed primary data
15 |
Jurnal Integrasi | 2012 Vol. 4(1) 1-15 | ISSN: 2085-3858 Group StatisticsKeterangan Nilai Mean Standar Deviasi
Pengguna Auditor BPK Pengguna Auditor BPK
Existed Auditors’
Duties 34,3750 35,1048 3,45697 2,54167
Non-Existed Auditors’
Duties 20,1750 14,2095 2,19496 1,69669
All Auditors’
Duties 54,5500
49,3143
4,78943
3,29135
Keterangan
Nilai Mean Standar Deviasi
Pengguna Akuntansi Pengguna Non Akuntansi Pengguna Akuntansi
Pengguna Non Akuntansi Perception
on performance auditors of BPK
47,9851 66,9245
6,49590
4,85897
Independent Samples T-Test
Total Group Levene's test t-test
F sig t
sig. (2-tailed)
Existed Auditors’ Duties
equal variances assumed
15,062 ,000
1,782 ,076
equal variances not
assumed 1,818 ,070
Non Existed Auditors’ Duties equal variances assumed 7,189 ,008
-22,566 ,000
equal variances not
assumed -22,950 ,000
All Auditors’ Duties equal variances assumed 16,964 ,000
-9,422 ,000
equal variances not
assumed -9,651 ,000
Perception on performance auditors of BPK
equal variances assumed
7,051 ,009
17,668 ,000
equal variances not
assumed 18,265 ,000
Source: the processed primary data
Table 9: Identification Result of the Component Expectation Gap Audit
Group Tasks Amount Detailed Tasks Criterion
Deficent performance 16 of 20 existed duties
5,6,8,9,13,16,17, 18,19,20,21,22,
24,25,26,31
Owns the mean value of less than 3 and over than 25% respondents of accounting consider those duties as badly performed
Deficient Standard/Unreasonable expectation
11 of 12 non-existed duties
3,4,11,12, 14,15, 27,28,29,30,32
There are 25% or more accounting respondents expecting those duties to exist