Feasibility Analysis of LTE 1.8 GHz for Mobile Operators in Indonesia
Analisis Kelayakan Implementasi LTE 1.8 GHz Bagi Operator Seluler di
Indonesia
Sri Ariyanti1, Doan Perdana2
1
Pusat Penelitian dan Pengembangan Sumber Daya dan Perangkat Pos dan Informatika 1
Jl. Medan Merdeka Barat No.9 Jakarta 10110, Indonesia 2
Electrical Engineering Department, Telkom University 2
Jl. Telekomunikasi, Terusan Buah Batu, Bandung 40257, Indonesia 1
e-mail : [email protected], 2[email protected]
I N F O R M A T I O N A R T I C L E A B S T R A K
Manuscript received January 3, 2015 Revised January 25, 2015
Approved February 25, 2015
Kata kunci : LTE
Analis Kelayakan 1,8 GHz
Peningkatan kebutuhan layanan data mendorong operator telekomunikasi berusaha mengimplementasikan jaringan akses broadband yang lebih handal. Teknologi LTE merupakan salah satu teknologi dengan kecepatan mencapai tiga kali dibanding teknologi HSDPA, sehingga diharapkan dapat memenuhi kebutuhan pelanggan data mobile. Refarming frekuensi 1.8 GHz untuk penerapan teknologi LTE memberikan efisiensi karena tidak perlu membayar BHP lagi untuk menyewa frekuensi baru. Teknologi 2G GSM selama ini juga semakin ditinggalkan. Masyarakat di daerah perkotaan cenderung lebih banyak menggunakan layanan data. Sebelum diterapkannya teknologi LTE pada frekuensi 1.8 GHz perlu adanya kajian untuk mengetahui kelayakan teknologi LTE pada frekuensi 1.8 GHz. Penelitian ini bertujuan untuk melakukan cost-benefit analysis implementasi LTE pada frekuensi 1.8 GHz. Penelitian ini menggunakan pendekatan kualitataif yang didukung dengan data kuantitatif. Hasil penelitian menunjukkan bahwa minimal bandiwdth yang diperlukan agar implementasi LTE layak digunakan adalah 15 MHz. Meskipun tanpa Global Frequency Returning, penggunaan bandwidth 10 MHz tidak layak digunakan untuk implementasi LTE.
The incresing of data demand drives mobile operators to implement more reliable broadband access network. LTE technology has downlink peak rate up to three times than HSDPA, hence it may fulfill the mobile data user requirement. Frequency 1.8 GHz refarming can be implemented to provide efficiency because They do not need to pay licence fee for leasing new frequency. GSM technology will be abandoned since it is not growing anymore. Besides that, dense urban users tend to use data mobile. Before implementing LTE technology on 1.8 GHz frequency, It is necessary to analysis the feasibility such technology. This research used qualitative method supported by quantitative approach. The result of this research showed that minimum bandwidth to implement 1.8 GHz LTE is 15 MHz. Even without Global Frequency Returning, using bandwidth 10 MHz is not feasible.
1. Introduction
The pattern of the current communication needs can be met with unlimited resources via the Internet and also communications mobility anywhere via wireless communication technology which is called mobile broadband. But along with these developments, experiences and satisfaction of users of telecommunications services are still not fulfilled as expected due to the speed and services that are still limited. In addition, the number of users of mobile data services has increased since the launch of 3G technology. It is a challenge for operators to always be able to meet the expectations of the customers and ensure that business operations can continue. Thus, the telecomunication operators are trying to implement a more reliable broadband access networks so as to keep pace with the customer demand and needs.
terms of speed, capacity and coverage in order to face these challenges. Efforts to increase the service is done by implementing a more reliable technology in terms of access speed and network capacity and coverage.
Long Term Evolution (LTE) technology may be the answer to these needs. LTE 1.8 GHz is a standard all-IP based mobile broadband technology issued by 3GPP. LTE is designed as a 4G technology that provides multi-megabit bandwidth, efficient in the use of the radio network, the latency reduction and increased mobility and capability in terms of interpolation ability and implemented on 2G/3G network. Thus, the implementation of LTE technology is low cost. Various advantages aims to improve telecommunication services user interaction with the network that can ultimately meet the needs of mobile broadband (MBB) such as broadband internet access, on-line TV, blogging, social networks and interactive gaming.
Before the application of 4G LTE technology, the frequencies used need to be identified. Frequency is a limited resource, so its use must be as efficient as possible. In order for an efficient implementation of LTE technology, it can be done by implementing it at a frequency that is already used today is the 1800 MHz frequency which has already been used for GSM technology. Frequency refarming between 2G and 4G technologies provides efficiencies for operators, which do not need to pay User Rights Fee (BHP) of new frequency.
Merger between XL and Axis provide the advantage of wide bandwidth at a frequency of 1.8 GHz which becomes 22.5 MHz, which consists of a frequency which is owned XL Axiata Axis of 7.5 MHz and 15 MHz. XL Axiata has plans to use the 1.8 GHz frequency as the frequency for LTE technology. In addition, PT. Telkomsel, Indosat and H3I also has made a trial of LTE technology at that frequency.
Although the trial of LTE technology has been done by the four mobile operators, it is necessary to analyze the economic feasibility of LTE technology at a frequency of 1800 MHz. Therefore, this research conducted a study on the economic analysis of the implementation of LTE technology at a frequency of 1800 MHz.
The purpose of this research is the study of the Cost Benefit Analysis of frequency refarming scheme implementation for telecommunication operators in Indonesia. The benefits of this research is to be used as a reference for policy making related to the use of the 1.8 GHz frequency allocation for frequency refarming scheme for telecommunication operators in Indonesia.
2. Desktop Study
2.1. Desktop Study
Anang Prasetyo (Prasetyo, 2011) in 2011 made a study titled Techno-Economic Analysis of LTE Release 8 Implementation with the Using Capacity and Coverage Estimation Method and the DCF Method in Jabodetabek. The study contains an analysis both technically and economically to the implementation of LTE release 8 on the operator's network by using co-existence scenario. Analysis model used is based on techno economic principles using the capacity and coverage estimation method to determine the design of LTE technology and DCF method to analyze economically and measure the feasibility of the costs incurred for the implementation of LTE. Of the simulated scenarios conducted, the conclusion is that the greatest NPV obtained under the first scenario that achieved NPV of Rp. 45,897,032,000, IRR of 18.095% and a turnover in the year 7 and month 10. From a sensitivity analysis conducted, it is showed that rate factor and number of subscribers greatly affected the attainment of a risk analysis on the worst conditions against number of subscribers factor, it is obtained that possible NPV valuewill remain positive by 83.27%, thus it can be concluded that the LTE release 8 is feasible to be implemented in Jabodetabek area.
P˚ al Grønsund, Ole Grøndalen dan Markku L¨ahteenoja (Grønsund, Grøndalen, & Lähteenoja, 2013)
analyze the business aspects of the mobile operator using LTE network by implementing cognitive femtocell. The addition of network cognitive femtocells sensor will allow the use of frequency other than the mobile network, therefore it is necessary to increase the power to cover the outdoor area and the next building. Femtocell cognitive strategy will be compared with alternative strategies where operators build conventional femtocel and should build additional base stations to offset the traffic demand. Business analysis indicates that there is potential for cost savings when using cognitive femtocells compared to alternative strategies. Results of sensitivity analysis showed that the backhaul price is the most important parameter in the development of cognitive femtocell network. Whereas the costs associated with fixed sensor network is the least significant effect. Sensitivity analysis in this study also shows the parameters for spectral efficiency, cognitive and conventional femtocell offloading gain, sensor density and price, customer density and site development.
Vladimir Nikolikj and Toni Jnevski develop a "state-of-the-art" heterogeneous wireless network cost model to determine the cost of construction the most effective of radio networks with demand usage per customer of more than 100 GB per month. The research also compares the LTE-Advanced technology and standard Wi-Fi IEEE 802.11ac. The analysis in this research contributed to the assessment of the advantages of the operation of LTE-Advanced technology in the band digital dividend. Outcome model of funding provide a proper assessment on the total investment required to serve a particular area, using a band from 700 MHz to 5 GHz. Research findings show that small cell solutions such as femto cell and WiFi are more efficient when the new macro base stations need to be built or when a high increase in traffic have to be serviced. In the case of other evaluation, it shows the importance of the spectrum size in determining the cost-capacity performance. By evaluating the economic value of the joint development of small and macro cell, it can be determined that additional spectrum investment or developing more networks, mobile operators can compensate penetration losses indoor through the site femto or Wi-Fi (Nikolikj & Janevski, 2014)
2.2. Theoritical Base
Long Term Evolution (LTE) is a long-term evolution radio access network output of the 3rd Generation Partnership Project (3GPP). LTE is a continuation of the third generation technology (3G) WCDMA-UMTS (Lingga Wardhana, 2014). 3GPP Organization formulate LTE technology to the following criteria (Lingga Wardhana, 2014):
1) Peak rate downlink up to 100 Mbps when users move quickly and 1 Gbps when moving slowly or stationary, while the peak rate for uplink is 50 Mbps
2) System delay is reduced to 140 ms
3) Increased spectrum efficiency two to four fold of technology 3.5G High Speed Packet Access (HSPA) Release-6
4) cost-effective sistem migration from HSPA Release-6to LTE 5) Increase the broadcast service
6) Using the Packet Switch (PS) connection so as to allow the system adopts the IP as a whole 7) Flexible bandwidth ranging from 1.4 MHz, 3 MHz, 5 MHz, 10 MHz, 15 MHz to 20 MHz 8) Can work in a wide range of frequencies spectrum both paired and unpaired
9) Inter-working with the existing 3GPP system and non-3GPP system
2.2.1. Long Term Evolution (LTE) Network Architecture
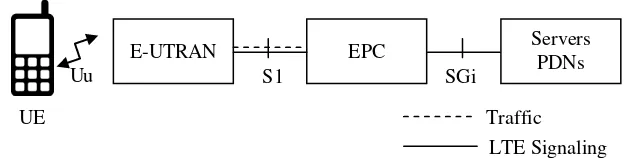
Figure 1. Long Term Evolution (LTE) Network Architecture (Cox, 2012)
User equipment (UE) or mobile equipment (ME) is a means of communication such as voice mobile or smartphone. Mobile equipment devided into two components, namely mobile termination (MT), which handles all the functions of communication and terminal equipment (TE) that serves to end the data flow.
Evolved UMTS Terrestrial Radio Access Network (E-UTRAN) which function is to handle radio communication between the mobile equipment (ME) and evolved packet core (EPC) and has only one component, namely evolved Node B (eNB). eNode B is a base station that controls the mobile equipment (ME) at one or more cells. eNB has two functions, the first is to send radio transmissions to ME both uplink and downlink using the analog and digital signals process function of LTE air interface. The second function controls the low-level operation of all mobile equipment (ME), by sending a signal message as handover commands associated with radio transmissions. In carrying out its functions, eNodeB combines the first functions and radio network controller (Cox, 2012). The E-UTRAN architecture can be seen in Figure 2.
Figure 2. Evolved UMTS terrestrial radio access network (E-UTRAN) Architecture
One component of the EPC namely home subscriber server (HSS), is a central database containing all the information about the customer. HSS is a small component of the LTE carried by UMTS and GSM. Packet data network (PDN) gateway (P-GW) is the point that connects the outside world. Through the SGI interface, each PDN gateway exchange data with one or more external devices or a packet data networks, such as operator network servers, Internet or multimedia IP subsystem. Each packet data network identified by the access point name (APN). Network operators specifically use less APN, for example, one for its server and one for the Internet. Serving Gateway (S-GW) serves as a router, and forwards data between the base station and the PDN gateway. Mobility management entity (MME) functioned to controll the operation of high levels of the mobile by sending signalling such as security and management of data streams that are unrelated to radio communication (Cox, 2012).
2.2.2. Structuring the Frequency Spectrum Allocation in Indonesia
Based on statistical data of the Ministry of Communications and Informatics of the Republic of Indonesia in 2011, the Indonesian Radio Frequency Spectrum Allocation derived from Radio Regulations Frequency Allocation 2008 edition (Radio Regulations, 2008 edition) and the Final Act-World Radio communication Conference (WRC 2007) with regard to Indonesian Radio Frequency Spectrum Allocation Table and the use of frequency spectrum in Indonesia, as well as new plans are designed to be more efficient by observing the world and national technological development. Under Ministerial Regulation No.
E-UTRAN EPC
S1 SGi
UE Uu
Servers PDNs
Traffic LTE Signaling
EPC S1
UE Uu
Traffic Signaling
X2
eNB Othere
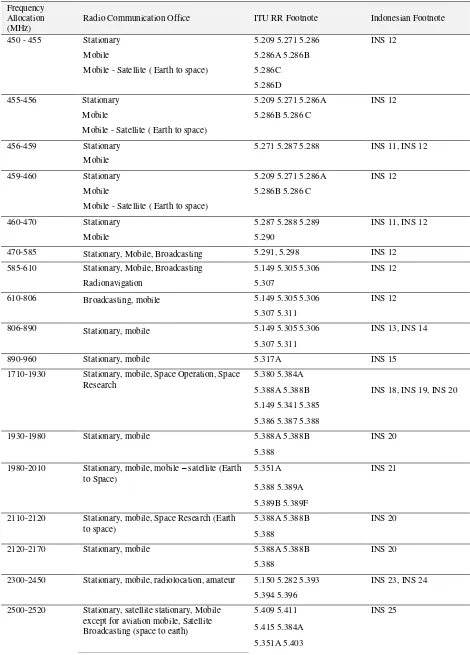
29 of 2009 on Radio Frequency Spectrum Allocation Table in Indonesia, which refers to the ITU Radio Regulations, 2008 edition, the allocation of radio frequency spectrum in Indonesia are shown in Table 1.
Table 1. The allocation of radio frequency spectrum in Indonesia
Frequency Allocation (MHz)
Radio Communication Office ITU RR Footnote Indonesian Footnote
450 - 455 Stationary 5.209 5.271 5.286 INS 12
Mobile 5.286A 5.286B
Mobile - Satellite ( Earth to space) 5.286C
5.286D
455-456 Stationary 5.209 5.271 5.286A INS 12
Mobile 5.286B 5.286 C
Mobile - Satellite ( Earth to space)
456-459 Stationary 5.271 5.287 5.288 INS 11, INS 12
Mobile
459-460 Stationary 5.209 5.271 5.286A INS 12
Mobile 5.286B 5.286 C
Mobile - Satellite ( Earth to space)
460-470 Stationary 5.287 5.288 5.289 INS 11, INS 12
Mobile 5.290
470-585 Stationary, Mobile, Broadcasting 5.291, 5.298 INS 12
585-610 Stationary, Mobile, Broadcasting 5.149 5.305 5.306 INS 12
Radionavigation 5.307
610-806 Broadcasting, mobile 5.149 5.305 5.306 INS 12
5.307 5.311
806-890 Stationary, mobile 5.149 5.305 5.306 INS 13, INS 14
5.307 5.311
890-960 Stationary, mobile 5.317A INS 15
1710-1930 Stationary, mobile, Space Operation, Space
Research
5.380 5.384A
5.388A 5.388B INS 18, INS 19, INS 20
5.149 5.341 5.385
5.386 5.387 5.388
1930-1980 Stationary, mobile 5.388A 5.388B INS 20
5.388
1980-2010 Stationary, mobile, mobile – satellite (Earth
to Space)
5.351A INS 21
5.388 5.389A
5.389B 5.389F
2110-2120 Stationary, mobile, Space Research (Earth
to space)
5.388A 5.388B INS 20
5.388
2120-2170 Stationary, mobile 5.388A 5.388B INS 20
5.388
2300-2450 Stationary, mobile, radiolocation, amateur 5.150 5.282 5.393 INS 23, INS 24
5.394 5.396
2500-2520 Stationary, satellite stationary, Mobile
except for aviation mobile, Satellite Broadcasting (space to earth)
5.409 5.411 INS 25
5.415 5.384A
Frequency Allocation (MHz)
Radio Communication Office ITU RR Footnote Indonesian Footnote
5.403 5.404 5.407
5.414
2520-2535 Stationary, satellite stationary, Mobile
except for aviation mobile, Satellite Broadcasting
5.409 INS 26
5.411 5.415
5.384A 5.413
5.416
5.403 5.415A
2535-2655 Stationary, Mobile except for Aviation
mobile, Boradcasting
4.409 5.411 INS 26
5.384A 5.413
Source: (Ministerial Regulation of MCIT,2009)
1800 MHz frequency spectrum usage in Indonesia is allocated to the 1710-1785 MHz band paired with 1805-1880 MHz allocated to cellular mobile telecommunications operations and identified for IMT (WRC results of 2003) respectively for the uplink and downlink.
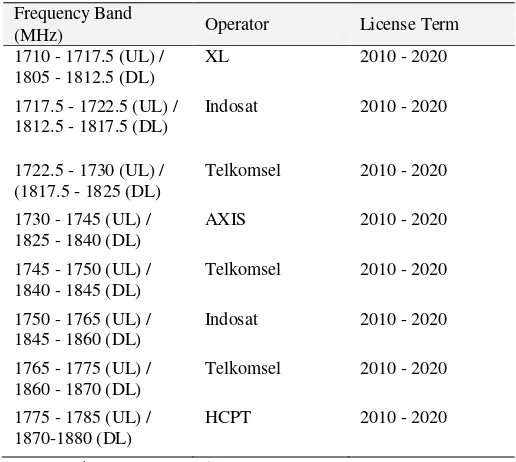
In addition, INS20 footnote also stated that the 1710-1885 MHz frequency band is allocated for cellular mobile telecommunications operations and identified for IMT (WRC results of 2003). The division of the allocation for the 1800 MHz frequency spectrum according to the ownership and use are presented in Table 2. Of the frequency band allocation ownership in band range of 1710 MHz up to 1885 MHz is occupied by the four mobile operators, namely PT XL-Axis, PT Indosat, PT Telkomsel and PT Hutchinson 3 Indonesia..
Table 2. Ownership and Term of 1800 MHz Frequency spectrum
Frequency Band
(MHz) Operator License Term
1710 - 1717.5 (UL) / 1805 - 1812.5 (DL)
XL 2010 - 2020
1717.5 - 1722.5 (UL) / 1812.5 - 1817.5 (DL)
Indosat 2010 - 2020
1722.5 - 1730 (UL) / (1817.5 - 1825 (DL)
Telkomsel 2010 - 2020
1730 - 1745 (UL) / 1825 - 1840 (DL)
AXIS 2010 - 2020
1745 - 1750 (UL) / 1840 - 1845 (DL)
Telkomsel 2010 - 2020
1750 - 1765 (UL) / 1845 - 1860 (DL)
Indosat 2010 - 2020
1765 - 1775 (UL) / 1860 - 1870 (DL)
Telkomsel 2010 - 2020
1775 - 1785 (UL) / 1870-1880 (DL)
HCPT 2010 - 2020
Source: ( Directorate General SDPPI, 2013)
Of the distribution of occupation and use of the frequency band as presented in Table 2, it appears there is a lag between the highest uplink and the lowest downlink by 20 MHz. If we refer to INS 20 footnote above which states that the 1710-1885 MHz frequency band is allocated for cellular mobile telecommunications operation, there are the remaining band of 5 MHz width above the highest downlink already owned by operator (1880). The pause between them is used for frequencies separation or for guard band.
2.2.3. LTE Network Planning
a. Coverage Planning
Coverage planning process used to obtain the number of eNodeB needed to build LTE. The first stage in making coverage planning namely to create link budget by entering the required parameters. Furthermore, determining the cell radius to determine the propagation used. In addition, calculate the cell area, which is then used to obtain the number of eNodeB used (Asp, Training, & Broadband, 2013)
b. Link Budget
Link budget consist of two: uplink (UE to eNodeB) and downlink (enodeB to the EU). The parameters used for uplink includes transmit power of User Equipment (UE), the antenna gain, body loss, receiver Noise Figure (eNodeB), Receiver Noise, SINR, Fade Margin, Interference Margin, receiving antenna gain and feeder loss. Whereas in the downlink direction, the parameters used include transmit power (eNodeB), gain antenna eNodeB, cable loss, receiver Noise Figure (UE), receiver noise, SINR, Fade Margin, Interference Margin, Rx Antenna gain (dB) and Body Loss. Link budget process both for uplin and downlink are used to obtain the value of Maximum Allowable Pathloss (MAPL). MAPL is the maximum path loss (attenuation) allowed between the transmitter to the receiver.
c. Cell radius
Having obtained the MAPL, the cell radius could be obtained by entering the appropriate frequency propagation models used. Frequencies used in this study is 1800 MHz. Appropriate propagation models are 231 because it is suitable for the frequency of 1500 MHz -2000 MHz. The propagation models cost-231 is formulated in equation 1-5 (Molisch, 2011).
Lp(dB)=A+B log10 (d) + C ………....(1)
d. eNodeB Coverage Area
Cell area or eNodeB coverage obtained after getting cell radius value. Antennas used in this research is using three sectors, so the equation to obtain the cell area is by equation 6. Total eNodeB is obtained by dividing the area to be served to the cell area, or equation 7.
L=1,95x2,6xd2………...(6) where d is cell radius.
NeNB = A/Asite ………..………(7)
where A is total area to be served. e. Capacity Dimensioning
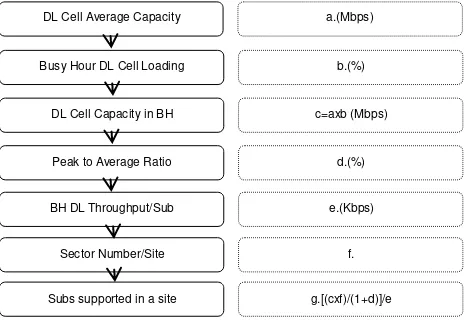
LTE Capacity dimensioning used to obtain number of eNodeB needed to build the LTE network. Capacity dimensioning process flowchart can be seen in Figure 3.
LTE capacity dimensioning process includes;
1). Calculation of average cell throughput by the following equation:
Cell average Throughput = cell bandwidth x spectral efficient ...(8) 2). Subscriber supported per cell
To determine the number of subsciber that can accommodated in one cell, it must first define the traffic models used. Having determined the traffic model, it will obtain a single user throughput that will then obtained the number of subscribers per cell.
Figure 3. Capacity Dimensioning Flowchart
f. Number of eNodeB
Number of eNodeB obtained by dividing the estimated number of subscribers to be served against the number of subscribers per cell.
2.2.4. Cost Benefit Analysis
The project defined the operation that consists of a series of jobs, activities or services that aim to resolve the separate tasks that are economically or technically appropriate; having a good goal (Hubner, 2008). Assessment requirements focuses on the entire project as separate units and not fragments or parts of the project. Separation of project is only because of administrative reasons, not the object according to the assessment. To find out a project the feasibility of a project feasibility analysis needs to be done, one of them is using a cost-benefit analysis (CBA). Cost-benefit analysis is a method for organizing information to obtain decisions about resource allocation. Strength as an analytical tool has two main features, namely: (Group 2006)
a. Costs and benefits are presented as far as possible in the form of money as compared to one another b. Costs and benefits worth is assessed in terms of the claims they make and the benefits they provide to
society as a whole
The basic concept of cost benefit analysis include:
a. Opportunity cost: the resource is considered to be the best alternative use above or below the production price. Opportunity cost may also means the costs incurred when choosing an activity
b. Willingness to pay: Output assessed on whether consumers are willing to buy it
c. Rules of costs and benefits: subject to budget and other constraints as well as considerations of fairness 3. Methods
3.1. Reserach Approach
To describe how to use 1.8 GHz frequency, this research used a qualitative approach. Whereas to figure out how the feasibility of LTE technology at 1.8 GHz frequency we are using a quantitative approach.
3.2. Research Techniques
Research carried out by research technique with qualitative methods supported by quantitative data. Qualitative data obtained from focus group discussions and in depth interviews to mobile operators while quantitative data obtained from the distribution of questionnaires to mobile operators and literature studies. 3.3. Respondents
Primary data in this research were obtained from informants, namely mobile operators using 1.8 GHz frequency, the regulator namely Directorate of Planning of the Directorate General of SDPP and telecommunications equipment vendors.
DL Cell Average Capacity
Busy Hour DL Cell Loading
DL Cell Capacity in BH
Peak to Average Ratio
BH DL Throughput/Sub
Sector Number/Site
Subs supported in a site
a.(Mbps)
b.(%)
c=axb (Mbps)
d.(%)
e.(Kbps)
f.
3.4. Location and Time Research
The location of the research was in Jakarta with the consideration that the informants that consists of mobile operators, vendors, regulators are mostly located in Jakarta. We also do research in Singapore to obtain data both primary and secondary from the mobile operator and literature at the University of Telkom Bandung.
3.5. Data Collection Technique
The data obtained in this study are primary and secondary data. Primary data obtained from focus group discussions with mobile operators which use the 1.8 GHz frequency namely PT.Telkomsel, PT. Indosat, PT.XL Axiata and PT. Hutchison 3 Indonesia. Also invited are informants from one of the telecommunications equipment vendors, namely PT. Huawei Technical Investment and regulator representatives of the Directorate of Planning SDPPI, the Ministry Communication and Informatics. In addition to using FGD, interview was also conducted with mobile operators to gain a more comprehensive secondary data. Secondary data were also obtained from literature.
3.6. Analysis Techniques
Data analysis techniques in this study is using techno-economic analysis. Technically, the calculation of link budget was carried out to subsequently find out the number of sites needed to implement a Long Term Evolution technology. Having done that, economic analysis namely cost-benefit analysis was carried out to determine whether LTE technology is viable or not.
4. Results and Discussion
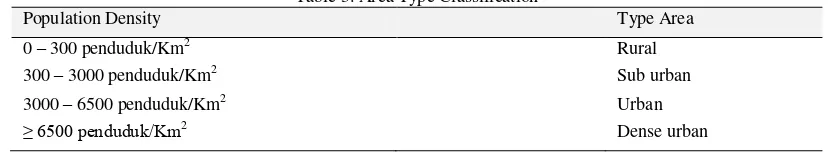
The area of LTE development plan in this research are Jakarta, Bogor, Depok, Tangerang, Bekasi and Bandung. Selection of the region takes into account that those are big cities, havaing a dense population, and a considerable amount of mobile user data. Thus, with the application of LTE technology, it is possible that Jabodetabek residents are more interested compared to residents of other regions. Area type classification can be seen in Table 3.
Table 3. Area Type Classification
Population Density Type Area
0 – 300 penduduk/Km2 Rural
300 – 3000 penduduk/Km2 Sub urban
3000 – 6500 penduduk/Km2 Urban
≥ 6500 penduduk/Km2 Dense urban
Source : (Marcus et al., 2010)
Based on the calculations that as many as 61.24% of the Jabodetabek are in dense urban areas. While the remaining 38.76% are in sub-urban areas (Table 4). Whereas in Table 5 shows the majority of the population for Bandung area are in sub-urban areas, amounting to 67.4%. While the rest, amounting to 32.6% are in dense urban areas.
Table 4. Type of area, area, population, population density and the percentage of the population for Jabodetabek area
Jabodetabek Area (Km2) Population Population
Density
Dense Urban 1119,73 13196497 11785,42774
Sub Urban 1224,88 2377209 1940,768892
Total 2344,61 15573706 6642,343929
Table 5. Type of area, area, population, population density and the percentage of the population for Bandung area
Bandung Area (Km2) Population Population Density
Dense Urban 167,67 2182661 13017,60005
Sub Urban 1767,96 3064366 1733,277902
In accordance with the flow of research, prior to Cost-benefit Analysis calculation of eNodeB amount was carried out to build the Long Term Evolution network at 1800 MHz frequency. To determine the number of eNodeB required to build the LTE network, LTE Network Planning was carried out includes planning coverage and capacity dimensioning.
4.1. LTE Network Planning
LTE Network Planning include coverage planning and capacity dimensioning. This research uses several scenarios that use 10 MHz and 15 MHz bandwidth. These scenarios were considered because the 1800 MHz band is currently used by GSM so that not all of the bandwidth can be used.
4.2.LTE Coverage Planning
The parameters used for the calculation of the coverage budget link planning refers to ETSI TS 136 104 V10.1.0 (2011-01), ECC report (ECC, 2013) and Huawei (Huawei Technologies co.LTD, 2014). The scenario used in the LTE network planning can be seen in Table 6. After the link budget process, the MAPL was obtained for the downlink and uplink shown in Table 7. Based on the results of Maximum Allowable Pathloss (MAPL), the distance from enodeB to Mobile Station (MS) was obtained with each area type of dense urban and sub urban shown in Table 8.
Table 6. LTE Network Planning Scenario
Morphology Uplink Downlink
Antenna Configuration 1 x 2 2 x 2
Data Rate at cell edge 500 kbps 1000 kbps
MCS at Cell Edge QPSK, 1/3 QPSK, 2/5
Table 7. The amount of MAPL for uplink and downlink direction in 10 MHz and 15 MHz bandwidth
Bandwidth MAPL
Uplink Downlink
10 MHz 127,88753 139,2875291
15 MHz 128,28753 138,8875291
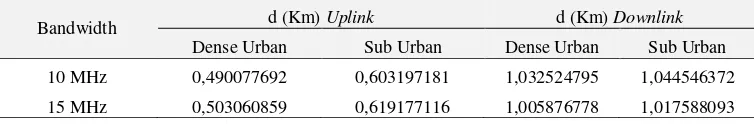
Table 8. The amount of Distance of eNodeB to MS for the type of dense urban and sub urban
Bandwidth d (Km) Uplink d (Km) Downlink
Dense Urban Sub Urban Dense Urban Sub Urban
10 MHz 0,490077692 0,603197181 1,032524795 1,044546372
15 MHz 0,503060859 0,619177116 1,005876778 1,017588093
Based on Table 8, it is shown that the distance from eNodeB to MS for uplink and downlink both on 10 MHz and 15 MHz bandwidth, the dense urban type is smaller than the sub-urban type. This is due to the influence of attentuation in dense urban areas which is greater than in sub-urban. Attenuation in dense urban areas is due to among others reflections from buildings or high-rise buildings as well as interference from other users. The distance between the eNodeB and MS in the downlink direction is greater than in the uplink direction. This is due to transmit power of eNodeB which is greater than the transmit power of the Mobile Station (MS).
To determine the required number of eNodeB, least distance is used namely on the uplink direction. Therefore, for Jabodetabek and Bandung directions, the required number of eNodeB obtained can be shown in Table 9.
Table 9. Total eNodeB equired for Jabodetabek and Bandung
Tipe Dense Urban Sub urban
Bandwidth 10 MHz 15 MHz 10 MHz 15 MHz
Jabodetabek 920 873 664 631
4.3. LTE Capacity Dimensioning
Capacity dimensioning is a process to determine the scale of the network based on their capacity needs. Capacity dimensioning is done for each region characteristics and different bandwidth. Characteristics of the region covers dense urban and sub urban areas. While the used bandwidth is 10 MHz and 15 MHz. Traffic parameter refers to the LTE Radio Network Planning, Huawei (Huawei Technologies Co.LTD, nd).
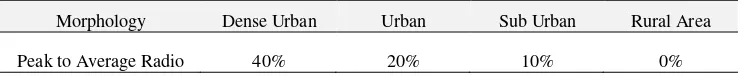
The amount of Peak to Average Ratio to calculate the single user throughput for each type of area is shown in Table 10.
Table 10. Peak to Average Ratio of each type of area (Huawei Technologies co.LTD, n.d.)
Morphology Dense Urban Urban Sub Urban Rural Area
Peak to Average Radio 40% 20% 10% 0%
Based on the parameters that have been assumed in this research, single user throughput was obtained for each type as shown in Table 11.
Table 11. Single user throughput for each type of area
Dense Urban Urban Sub Urban Rural
Single User
Throughput UL (Kbit) DL (Kbit) UL (Kbit) DL (Kbit) UL (Kbit) DL (Kbit) UL (Kbit) DL (Kbit)
in Busy Hour
(IP) (Kbps) 10,8018 44,77238 9,50888 36,3788 5,5415 19,6750 1,2174 5,7052
Other parameters used for the calculation of capacity planning are as follows: a. The number of sectors per site = 3
b. Spectral efficiency = 1.74 bps/Hz/cell (Huawei Technologies co.LTD, nd) c. Design Donwlink Cell loading of 50% (Huawei Technologies co.LTD, nd) d. Antennas used is MIMO 2 x 2
e. Downlink cell average capacity can be seen in Table 12..
Table 12. Downlink cell average capacity (Mbps)
Bandwidth Dense Urban Urban Sub Urban Rural
10 MHz 17,4399724 17,43997 17,1999736 17,19997
15 MHz 26,1599724 26,15997 25,7999736 25,79997
ENodeB amount needed to build LTE in Jabodetabek and Bandung area is determined by the target number of subscribers to be served. Estimates of the number of LTE subscribers in this research refers to the estimated number of XL-Axiata operator LTE subscribers, as shown in Figure 4.
Figure 4. Estimated Number of LTE Subscribers, XL-Axiata (XL-Axiata, 2014) 2018
Estimasi Jumlah PelangganEstimated number of subscribbers
Based on data of the population of Jabodetabek and Bandung from the Interior Ministry in 2012, the percentage of the population of Jabodetabek is 76.26%, while the number of residents in Bandung area is 23.4%. Assuming in the first year the number of LTE subscribers for Jabodetabek and Bandung are 500,000. So that the proportion of the number of subscribers in the first year for Jabodetabek area 381,300 subscribers, and the Bandung area amounted to 117,000 subscribers. Estimates of the number of customers for Jabodetabek and Bandung can be seen in Figure 5. In Figure 5, it is shown that the estimated increase in Jabodetabek subscribers is rising year over year, but not too significant. It is estimated that due to the number of competitors of LTE operators in Indonesia. So customers have more options for using a service provider that suits their interests.
Estimasi 1 2 3 4 5 6 7 8 9 10 11 12 13 14 15 16 3000000
2500000
2000000
1500000
1000000
500000
0
Ju
m
la
h
P
el
an
g
g
an
Bandung Jabodetabek Variable
Figure 5. Estimated Total Subscribers for Jabodetabek and Bandung Area (Source: Processed data)
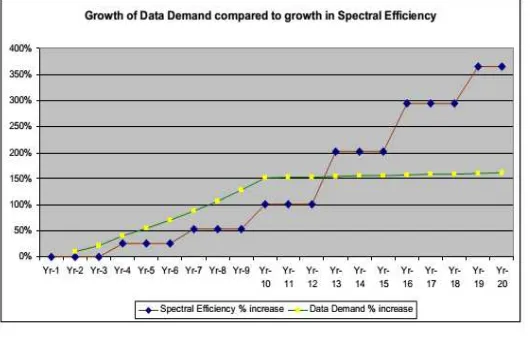
Spectral efficiency in this study are assumed to rise every three years. The increase can be seen in Figure 6. Thus in a given year when the number of subscribers rises, no additional eNodeB will be required.
Figure 6. Spectral Efficiency Assumption
4.4. Number of eNodeB after calculation of the coverage planning and capacity dimensioning
Having obtained the results of the calculation of the number of eNodeB from coverage planning as well as capacity dimensioning, the number of eNodeB that needs to be constructed is the greatest amount of the calculation results of coverage planning and capacity dimensioning. So the number of eNodeB needed in the first five years to build LTE technology network in Jabodetabek and Bandung area can be seen in Figure 7. Figure 7 shows that number of eNodeB needed to build LTE network in Jabodetabek area is greater than those for Bandung area. In the first year as many as 1584 eNodeB are needed to build LTE for Jabodetabek area. Whereas Bandung required lower number of 1097. The biggest number of eNode is in year 9 in both Jabodetabek and Bandung. But decreased for year 10 since it is the year where technology upgrades were carried out that increase the spectral efficiency by 100%. Then in year 13, it spectral
N
u
m
b
er
o
f
S
u
b
sc
ri
b
ers
efficiency was also increased by 200% so that the amount of eNodeB used were less and less even though the number of subscribers rose.
Tahun Ke- 1 2 3 4 5 6 7 8 9 10 11 12 13 14 15
Gambar 7. Jumlah eNodeB setelah coverage planning dan capacity dimensioning (sumber: Data diolah)
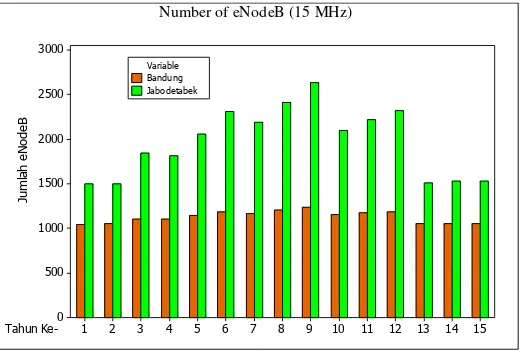
Number of eNodeB for Jabodetabek and Bandung area using 15 MHz bandwidth are shown in Figure 8. In the figure, it is shown that in the first year the number of eNodeB needed for Jabodetabek area as much as 1504. As for the Bandung area less that 1041. In comparison, the number of eNodeB to build LTE in 15 MHz bandwidth is less compared when using 10 MHz bandwidth. For more details, it can be seen in Figure 9. In the figure, it can be seen that in the first year, the use of 15 MHz bandwidth provide an efficiency of 13.93% of the number of eNodeB when compared to 10 MHz bandwidth usage. In the next year, its efficiency increased with the greatest value of 25.76% in the year 9. However, in year 14 and 15 it was only 0.03% due to the number of subscribers that has been stagnant, so it does not need the addition of eNodeB both using 10 MHz bandwidth and 15 MHz bandwidth.
Tahun Ke- 1 2 3 4 5 6 7 8 9 10 11 12 13 14 15
Figure 8. Number of eNodeB after coverage planning dan capacity dimensioning (source: processed data) Number of eNodeB
Tahun Ke- 1 2 3 4 5 6 7 8 9 10 11 12 13 14 15
Figure 9. Comparison of Number of eNodeB using 10 MHz bandwidth and 15 MHz bandwidth..
4.5.Cost Benefit Analysis 1.8 GHz LTE Networks Operation by Mobile Operator
Cost-benefit analysis in this section to see how feasible the implementation of the LTE 1.8 GHz by the mobile operator. Cost-benefit analysis is using four scenarios:
Scenario I, using 10 MHz bandwidth with financing (Service Charge) Global Frequency Returning (GFR)
Scenario II, using 15 MHz bandwidth with financing (Service Charge) Global Frequency Returning (GFR)
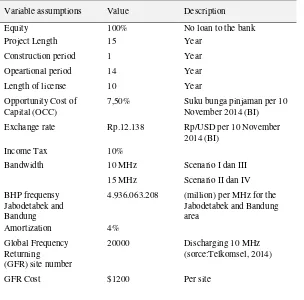
Variables assumtion used to calculate the cost-benefit analysis can seen in Table 13 below.
Table 13. Variable assumptions of cost-benefit analysis calculation
Variable assumptions Value Description
Equity 100% No loan to the bank
Project Length 15 Year
Construction period 1 Year
Opeartional period 14 Year
Length of license 10 Year
Opportunity Cost of Capital (OCC)
7,50% Suku bunga pinjaman per 10
November 2014 (BI)
Exchange rate Rp.12.138 Rp/USD per 10 November
2014 (BI)
4.936.063.208 (million) per MHz for the
Jabodetabek and Bandung
20000 Discharging 10 MHz
Variable assumptions Value Description
ARPU Rp.100.000 Per Month (Setiawan, 2013)
Marketing and administrative costs
10% of ARPU(Setiawan, 2013)
A salary increase 5% Per Year(Azmi, 2013)
increase in operating costs
5% Per Year(Azmi, 2013)
b) Asumsi Biaya Pra-Operasi
Penerapan teknologi LTE pada frekuensi 1,8 GHz diasumsikan tidak ada biaya perijinan karena sudah dilakukan perijinan pada penerapan teknologi GSM. Sebelum menerapkan teknologi LTE pada frekuensi 1,8 GHz perlu adanya penataan frekuensi tersebut agar contiguous. Biaya penataan tesebut cukup besar yaitu mencapai USD1000 – 1200 per site (Setiawan, 2014). Pada penelitian ini diasumsikan sebanyak 2000 site dengan biaya Global Frequency Returning (GFR) sebesar USD1200 per site.
c) Asumsi Capital Expenditure (Capex)
Capex merupakan biaya yang harus dikeluarkan untuk memperoleh ataupun meng-upgrade aset tetap seperti tanah, bangunan, dan mesin produksi. Asumsi capex dalam penelitian meliputi biaya perangkat BTS (hardware dan software), rectifier dan baterai, serta jaringan lainya. Besarnya capital expenditure
(capex) untuk skenario I dan III (bandwidth 10 MHz), skenario II dan IV (bandwidth 15 MHz) dapat dilihat pada gambar 10 dan 11.
d) Asumsi Operational Expenditure (Opex)
Opex assumtions estimate the operational costs of the entire back-office of LTE operators. Opex Cost in this study consisted of employee costs, Technical Support Scope, Service Levels and Service Credit (TSA), maintenance, frequency Implementation Rights Fee, USO Implementation Rights Fee, Telecommunications Implementation Rights Fee, tower rental, electricity, backhaul rent, interconnection costs, marketing costs and administrative and license fee per 10 years.
The amount of operational expenditure (opex) for the use of LTE in 10 MHz bandwidth is greater than 15 MHz bandwidth usage. Operating costs (opex) in 14 years of operation at 15 MHz bandwidth is 25% more efficient than the use of 10 MHz bandwidth.
15
Gambar 10. Figure 10. Amount of capex for 10 MHz bandwidth usage
Figure 11. Amount of capex for 15 MHz bandwidth usage
e) Amortisasi
Amortization assumptions in this research is 4% of capital expenditure (capex). Amortization amount varies each year depending on the amount of eNodeB that has been built. In the figure 39 and 40 it can be seen that amortization fluctuated depending on the number eNodeB of the existing LTE in previous year. The amount of amortization of usage when using 10 MHz bandwidth is greater than 15 MHz. This is due to the number of eNodeB used for 10 MHz bandwidth usage which is greater than 15 MHz. Therefore, equipment depreciation is also larger, proportional to the number of devices or eNodeB used.
f) Revenue
Revenues are derived from the Average Revenue Per Unit (ARPU). In this study, it is assumed on the amount of 100,000 per month flat for 15 years with 5 Gbps service pack (Setiawan, 2013). Earned income per year is shown in Figure 14. It shows that revenues has increased year over year although there was no increase in ARPU per year for inflation. This is due to predictions of the number of LTE subscribers that has increased.
Figure 14. Revenue Assumptions (million)
g) Profit and loss estimates
Profit and loss is determined by variables of income, operating expenses, operational profit/loss, amortization, profit/loss before tax and tax/Income tax (10%). Profit and loss estimates in this reseracg can be seen in Figure 15. In this figure, it appears that the application of LTE FDD using 10 MHz bandwidth will make a profit in year 8 (eight). However, the 15 MHz bandwidth experience gains in year 4 (four). Thus, the use of 15 MHz bandwidth will experience gains faster 4 years than the use 10 MHz band.
14
Figure 12. Operational Cost Assumtions over 14 years for 10 Mhz bandwidht
Tahun Ke- 1 2 3 4 5 6 7 8 9 10 11 12 13 14 15
Figure 15. The amount of profit/loss after tax on the use of 10 MHz and 15 MHz bandwidth (Source: Processed data)
h) Net Present Value (NPV) dan Internal Rate of Return (IRR)
NPV is the difference between expenditure and income that has been discounted using the social opportunity cost of capital as discount factor. If NPV> 0 the project is feasible, NPV = 0 means that the company did not have profits nor losses NPV <0 then the company is not viable.
IRR is an indicator of the efficiency of an investment. A project is feasible if the rate of return is greater than the rate of return if invested elsewhere (interest on bank deposits, mutual funds, etc.). In this research, it is assumed that the magnitude of investment interest elsewhere = 7.5% (the lending rate per 10 November 2014 at BI).
Research result showed that the project for scenarios II and IV are feasible. As for scenario I and III of the project is not feasible. More detail can be seen in Table 14. From the table it appears that the project would benefit if the bandwidth used is 15 MHz, either using GFR cost or without GFR. But when a project is using 10 MHz bandwidth, the project is not feasible to use even without any pre-operating costs namely the GFR cost. Projects without GFR at 15 MHz bandwidth usage gives a gain of 1.33% when compared to using the GFR.
Table 14. NPV and IRR of each scenario
Scenario NPV IRR
Application of 1800 MHz frequency LTE technology using 15 MHz bandwidth is more feasible than 10 MHz bandwidth usage. Even without Global Frequency Returning, Application of 1800 MHz LTE technology in 10 MHz bandwidth still suffered losses in 15 years of operation. Minimum bandwidth used at 1800 MHz LTE technologies in order to make a profit is 15 MHz.
5.2. Suggestion
The need for government subsidies for the cost of Global Frequency Returning or BHP reduction to relieve the burden of the operational cost of LTE implementation. Need to analyze the feasibility of using 10 MHz bandwidth in the first 5 years, 15 MHz in the second 5 years, and 20 MHz at the third 5 years.
6. Acknowledgements
The author would like to thank all those who have helped, both in terms of research and writing papers, especially Puslitbang SDPPI as funders.
Bibliography
Asp, I. T. U., Training, C. O. E., & Broadband, W. (2013). Long Term Evolution : Radio Network Planning ITU ASP COE Training on, 1–35.
Cox, C. (2012). An Introduction to LTE: LTE, LTE-Advanced, SAE and 4G Mobile Communications (pp. 21–44). John Wilwy & Sons.
Direktorat Jenderal SDPPI. (2013). Data Statistik Semester 2 2013. Jakarta.
Grønsund, P., Grøndalen, O., & Lähteenoja, M. (2013). Business case evaluations for LTE network offloading with cognitive femtocells. Telecommunications Policy, 37(2-3), 140–153. doi:10.1016/j.telpol.2012.07.006
Group, D. of F. and A. F. M. (2006). Handbook of Cost-Benefi t Analysis January 2006. Canberra.
Huawei Technologies co.LTD. (n.d.). LTE Radio Network Planning Introduction.
Lingga Wardhana, D. (2014). 4G Handbook Bahasa Indonesia. Jakarta.
Marcus, J. S., Burns, J., Jervis, V., Wahlen, R., Carter, K. R., Philbeck, I., & Vary, P. (2010). PPDR Spectrum Harmonisation in Germany , Europe and Globally. Bad Honnef.
Molisch, A. F. (2011). 7 . 6 . 1 Appendix 7 . A : The Okumura – Hata Model. In Wireleless Communications, Second Edition.
Nikolikj, V., & Janevski, T. (2014). A Cost Modeling of High-capacity LTE-advanced and IEEE 802.11ac based Heterogeneous Networks, Deployed in the 700MHz, 2.6GHz and 5GHz Bands. Procedia Computer Science, 40, 49–56. doi:10.1016/j.procs.2014.10.030
Prasetyo, A. (2011). Techno-Economic Analysis of LTE Release8 Implementation with Using Capacity and Coverage Estimation Method and DCF Methode in Jabodetabekf. Institut Teknologi Telkom.