AIC Colour 05 - 10th Congress of the International Colour Association
1175
The 3D Color Printer Explorer
C. Cusano, R. Schettini, S. Zuffi* DISCo, Università degli Studi di Milano Bicocca, Via Bicocca degli Arcimboldi 8, 20136 Milano (ITALY)
*ITC, Consiglio Nazionale delle Ricerche, Via Bassini 15, 20131 Milano (ITALY) Corresponding author: R. Schettini ([email protected])
ABSTRACT
The 3D Color Printer Explorer is an interactive tool for the computation and visualization of scalar measurements on interactively defined samplings of the device’s color space. It supports the user in the discovery and analysis of the conceptual linking between color statistics in different ranges of the printer gamut. The system allows the measurement and definition of different color quality features, including color resolution and graininess.
1. INTRODUCTION
The problem of assessing the characteristics of color printers has been addressed in many scientific and technical papers, but very few systems are available to date to support the user in this assessment, e.g. [1,2]. In general tools for the evaluation of printers are based on fixed targets and do not allow interactive visualization of the ongoing assessment. The variety of color print technologies available nowadays, together with the increasing number of inks in color printers, require instead more general tools for printer evaluation, with enough flexibility to adapt to the different devices. We describe here the main features of the 3D Color Printer Explorer, an interactive visual evaluation system we have developed in order to quantify and interactively visualize some of the color rendering properties of printers. The system we propose allows a global view throughout the whole printer’s color space of the various properties of printed colors. Moreover, it permits the progressive detailing of the analysis in specific portions of the color space until a very fine resolution is reached. The local analysis is conducted according to the property under investigation, instead of being a simple subsampling of a fixed data set.
Our underlying assumption is that all activities that involve generating, reading and comparing numerical data for analysis and interpretation can be greatly facilitated by the use of 3D visual interfaces that make it possible to convey information at both local and global levels.
2. SYSTEM DESCRIPTION
AIC Colour 05 - 10th Congress of the International Colour Association
1176
in the 3D environment for very effective visualization. In the present release of the system, we have focused on color resolution and graininess.
Part of the system is a high quality scanner colorimetrically characterized. Given a printout; the system can digitalize at the chosen resolution and convert scanner RGB values into CIE-Lab coordinates.
The characterization function is based on specifically designed software that uses up to a 3rd order polynomial with mixed terms to define the best non-linear transform relating the RGB of the scanner to CIE-Lab data for a set of training colors [3]. To prevent (or limit) scanner metamerism our characterization procedure exploits as training set a subset of the 4096 colors printed with the printer concerned, and measured with a Gretag Spectrolino spectrophotometer, specifying a D50 illuminant. For even more precise results in color resolution analysis, sample colors could be also measured with a spectrophotometer and fed to the system for data processing and visualization.
Color resolution
Color resolution is an acknowledge aspect of print quality. In general it refers to the spatial resolution when printing in color. More accurately, it is the number of bits used to specify colors, and, consequently, it indicates the number of distinct colors the printer can manage. The printer color space can usually be a 256 levels RGB or CMYK. Clearly, the color resolution in input does not map to an equivalent color resolution in output, especially considering the capability of the human visual system to distinguish very similar colors. Color management strategies and technological reasons may also compress the printer gamut in specific areas, determining a local reduction of color resolution. If the merging of similar colors is pronounced enough, this may produce unpleasant effects in the printing of smooth color transitions. As a measure of the contrast between printed colors, we have taken the average CIELAB ∆E between adjacent samples in the printer color space. More specifically, for each sample, we have considered the six neighbors obtained by positive and negative variations in one of the sample’s RGB components. Each neighbor was then printed and measured. The average CIELAB
∆E between a sample and its neighbors gives an indication of the capabilities of the printer to effectively separate colors in that neighborhood. When the values of this measure are too low, the samples are cluttered, and the local dynamic of the printer is insufficient. When the values of the measures are too high, there will be “holes” in the printer space (that is, there are significant color ranges that cannot be reproduced by the printer).
Color graininess
Graininess is a measure of small-scale non-uniformity in large areas of color. According to the standard ISO/IEC 13660 [4], graininess is defined as: "Aperiodic fluctuations of density at a spatial frequency greater than 0,4 cycles per millimeter in all directions.” The ISO-13660 metric of graininess is the standard deviation of density of a number of small areas of 42µm2. This definition, however, refers to grayscale prints, and would have to be properly applied and/or extended in order to deal with color images. The S-CIELAB, a spatial extension of the color metric CIELAB, has proved particularly useful in quantifying the graininess of color halftones [5,6]. In our system, the S-CIELAB color space is used to compute the errors in terms of color and spatial fidelity between an ideal printout and the actual printout. The interactively designed color target is printed and acquired by a colorimetrically characterized scanner. The color target XYZ image is converted into an opponent color space. Each opponent color channel image is filtered with a two-dimensional kernel the shape of which is related to the human visual spatial sensitivity for that color dimension. The filtered images are converted back into the XYZ color space, and then into the CIELAB color space. The difference between the processed color target and the ideal printout is computed, statistically analyzed, and visualized.
Data visualization
AIC Colour 05 - 10th Congress of the International Colour Association
1177
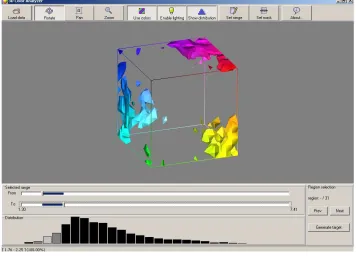
by the user (for example, it is possible to show the colors having an index of graininess between 0.2 and 0.8). To display the regions the software computes the isosurfaces (i.e. surfaces where the property to analyze exactly assumes a given value) corresponding to the bounds of the selected range. Since only discrete samples are available, the isosurfaces are linearly interpolated.
Figure 1. Snap shot of the 3D Color Printer Explorer. Visualization.
In order to analyze the behavior of a printer, a sample of the printer space is needed. On a coarse scale, some (possibly relevant) properties are missed, while on a finer scale requires more work to produce the targets and measure them. The 3D Color Printer Explorer allows the user to perform an adaptive analysis of the printer capabilities. The analysis begins with a low frequency sample of the full RGB cube. A first step suggests the critical regions of RGB color space, with respect to some kind of measure (e.g. smoothness, graininess …), the tool then has the user confirm the selection of these regions, which it employs to produce new targets which cover a smaller part of the RGB space but at a higher sampling rate. The process can be repeated until the analysis is focused on very small regions, that can be exhaustively investigated. Thus the Explorer provides means for an accurate analysis, without a waste of time or effort, focusing the investigation on critical regions only.
AIC Colour 05 - 10th Congress of the International Colour Association
1178
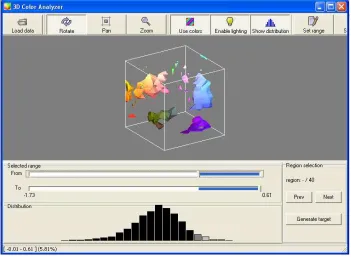
Figure 2. Snap shot of 3D Color Printer Explorer. Comparison of graininessmaps.
3. CONCLUSIONS
Unsatisfactory color reproduction in prints may be determined by an inappropriate use of color management tools, gamut mapping issues (specifically, gamut size and the criteria for mapping out-of-gamut colors), limited spatial resolution, or practical limitations in print technology related to color rendering. The 3D Color Printer Explorer has been specifically designed to support color engineers in media and component validation, and in the final tuning of color separation and dithering algorithms. The system could be easily extended to include a multitude of metrics related to the color gamut and to printed elements such as dots, lines, area, mottle...
However, our perspective in the design of any new features will remain unchanged, because we believe that to be truly useful the system should support the user in the discovery and analysis of the conceptual linking between the selected color statistics in different ranges of the printer gamut.
References
1. N. Otaki, Color image evaluation systems, OKI Technical Journal, Vol. 70, N. 2, pp. 68-73, 2003. 2. QEA, Image Quality Analysis Systems, http://www.qea.com/products_e.html
3. Stephen Westland and Caterina Ripamonti, Computational Colour Science using MATLAB, Wiley, 2004
4. ISO/IEC 13660, Information Technology- Office equipment - Measurement of image quality attributes for hardcopy output- Binary monochrome text and graphic. ISO/IEC 13660:2001.
5. X. Zhang, D.A. Silverstein, J.E. Farrell, and B.A. Wandell, “Color image quality metric S-CIELAB and its application on halftone texture visibility,” in Proceedings of IEEE COMPCON '97, pp. 44-48, 1997.