Is UK Vice Chancellor Pay Justified by
University Performance?
*R
AYB
ACHAN†
and
B
ARRYR
EILLY‡
†University of Brighton ([email protected]) ‡University of Sussex ([email protected])
Abstract
The pay of university managers (vice chancellors, VCs) in the UK has risen sharply in recent years. This paper considers the extent to which VC pay awards are related to university performance measures based around institution mission and financial probity using an individual fixed effects strategy based on data covering academic years 1998–99 to 2008–09. In contrast to earlier studies on this theme, we find evidence that VCs are rewarded for observable mission-based performance measures. Specifically, our results suggest that success in widening participation for students from comprehensive schools and those from areas with low university participation exerts a positive effect on VCs’ pay. Securing income flows from university funding council grants also impacts positively on their remuneration. However, even after controlling for a rich array of observable and unobservable factors, there have been sizeable increases in real pay in recent years that cannot be readily explained.
*Submitted September 2012.
The authors acknowledge the constructive comments and helpful advice provided by the journal’s editor and an anonymous referee that have enhanced this paper. They would also like to thank Mike Barrow, Geraint Johnes, Maura Sheehan and participants at the 2008 annual conference of the European Association of Labour Economists (EALE) in Amsterdam and of the Work, Pensions and Labour Economics Study Group (WPEG) in Sheffield for constructive comments on earlier drafts of this paper. However, the usual disclaimer applies.
Keywords: vice chancellors, CEO pay–performance, public sector, higher education. JEL classification numbers: J45, M5, M12.
© 2015 Institute for Fiscal Studies
Policy points
• The remuneration packages awarded to top executives from both the public and private sector have risen sharply in recent years. Amongst those who have benefited from such increases are university managers (vice chancellors, VCs) in the UK. This paper considers the extent to which VC pay awards are related to university performance measures, including those based around institution mission and financial probity. • The evidence reveals that VC pay is linked to widely-published
performance indicators, including those related to widening participation, suggesting that there may be scope in setting VC pay to introduce incentive pay schemes aligned to these indicators.
• However, even after controlling for a rich array of observable and unobservable factors, there have been sizeable increases in real VC pay in recent years that cannot be readily explained.
I. Introduction
The size of and increase in the remuneration packages awarded to top executives have often encountered adverse public reaction in both the UK and the US. Critics of such high pay awards often perceive them as either undeserved or unjust. For example, in his address to the Association of British Insurers in June 2011, the Business Secretary, Vince Cable, stated: ‘I want to see progress ... in bringing excessive, unjustified, executive pay under control. ... Ridiculous levels of remuneration are going unchallenged as the norm, when there is no clear evidence of a correlation with performance’.1 Such concern is often focused on the pay of heads of large private sector organisations, but concern has also been expressed in the UK regarding the pay awards granted to senior executives in major public sector organisations. For instance, in July 2003, the then deputy prime minister, John Prescott, criticised the £200,000 annual salary offered by Bradford Metropolitan Borough Council to fill its chief executive officer (CEO) position, pointing out that it exceeded the salary of the then Prime Minister.2 More recently, the Communities and Local Government Secretary, Eric Pickles, criticised the ‘bloated salaries’ paid to senior town hall officials, emphasising that some pay packages would ‘make a football manager blush’.3
The growth in public sector executive pay led to the recommendation that the pay of senior and the most highly remunerated public officials should be
1Cable’s address is available at
https://www.gov.uk/government/speeches/association-of-british-insurers-conference.
2‘Prescott lashes out at £200,000 council job’, Yorkshire Post, 5 July 2003. 3‘Eric Pickles pledges to cut “bloated” council pay’, The Telegraph, 10 July 2010.
publicly disclosed.4 In 2011, the government published a list containing the names of 258 public servants (including the heads of quangos) earning in excess of £150,000 per annum, seven of whom earned in excess of £250,000, with the highest-paid receiving an annual salary of £379,999 plus allowances.5
The pay awards of UK vice chancellors (VCs)6 has also been the subject of public scrutiny since 1994 when UK higher education institutions (HEIs) were required to publicly disclose the annual pay of the head of their institution. It was reported that, in 2010–11, 12 VCs received annual pay in excess of £300,000 excluding pension contributions and 33 earned over £250,000.7 The rate of increase in VC pay has also been of particular concern. The Business Secretary, Vince Cable, was reported as being ‘taken aback’ by the 10 per cent rise in VC pay in the academic year 2008–09 and urged ‘restraint’ in the pay awards granted to top university officers.8
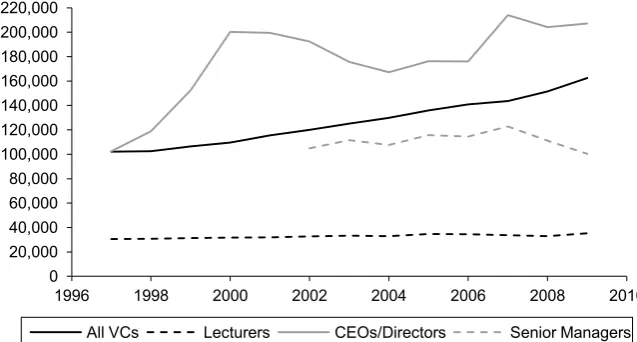
Figure 1 presents the plot of VC pay between 1997 and 2009, showing that it increased by 59 per cent in real terms over this period. In contrast,
FIGURE 1
Average annual real pay at 1998 prices:
all VCs, CEOs/directors, senior executives and university lecturers
Note: The VC pay used here includes all HEIs.
Source:Times Higher Education Supplement; Annual Survey of Hours and Earnings, various years.
4Hutton, 2011. 5Data.Gov.UK.
6The abbreviation ‘VC’ will be used in this paper as a generic term to describe all heads of UK higher
education institutions and covers the various titles of vice chancellor, principal, rector, director, provost etc.
7See accompanying tables to ‘Executive overdrive’, Times Higher Education (THE), 10 May 2012. 8The Telegraph, 26 May 2010.
0 20,000 40,000 60,000 80,000 100,000 120,000 140,000 160,000 180,000 200,000 220,000
1996 1998 2000 2002 2004 2006 2008 2010 All VCs Lecturers CEOs/Directors Senior Managers
full-time lecturers in higher education received a pay increase of about 16 per cent over the same period. The data suggest that, on average, VCs received pay awards that were close to four times those of lecturers over this period and a widening of this differential over time is also detected. These differences have been a major focus of criticism vented in the media and by lecturer unions, with assertions that the pay awards granted to VCs have been ‘outrageous’, ‘shameless’, ‘despicable’ and ‘unjust’.9
It is argued that the leadership and managerial skills needed to lead and administer large complex HEIs are similar to the executive skills required to manage comparably large private sector companies.10 In this sense, the pay awards granted to VCs in the UK higher education sector may be seen as merited and not excessive given that we might think remuneration should be broadly comparable to that received by private sector CEOs with similar executive responsibilities. As depicted in Figure 1, the average level of pay received by VCs was well below the pay of CEOs/directors of large private sector firms.11
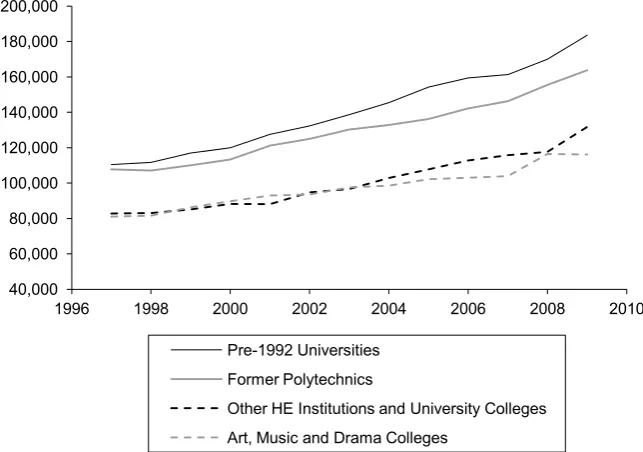
However, UK HEIs differ markedly in terms of their history, size, organisational structure and the markets for which they cater,12 which might be expected to affect VC pay. Figure 2 illustrates the trends in real pay of VCs who headed different types of HEIs between 1997 and 2009.13 It is clear that VCs of the pre-1992 or ‘old’ universities received higher average pay in all years. Their real average pay increased by 66 per cent over the period, compared with 53 per cent for VCs in the former polytechnics or ‘new’ universities and 43 per cent for those who headed art, music and drama colleges. It is also evident that the pay of VCs of both ‘old’ and ‘new’ universities is significantly more than the pay received by those who head other HEIs.
Despite a high level of public interest in the pay of VCs, only a few studies have been conducted on the pay determination process. The primary aim of this paper is to examine the relationship between VC pay and performance and, in so doing, shed light on whether or not VCs’ headline pay awards are justified. We examine VC performance across two
9See, for example, the following articles published in THE: ‘The annual pay review: are VCs worth
every penny?’ (28 March 2013), ‘Identity check: vice-chancellors’ education and pay revealed’ (24 March 2011) and ‘It was fun while it lasted’ (1 April 2010); and in the Times Higher Education Supplement: ‘Large rises at top as pay dispute grips sector’ (10 March 2006), ‘25% wage hike for V-Cs’ (10 March 2006), ‘Heads enjoy 100% rise in pay over ten years’ (25 February 2005), ‘V-C pay survey: thriving V-Cs net 6.1% rise in wages’ (20 February 2004), ‘Disparity is a disgrace’ (1 March 2002), ‘Union fury at “shameless” V-C pay rises’ (26 January 2001) and ‘Pay rises for university chiefs more than double increases given to their staff’ (26 January 2001).
10Farnham and Jones, 1998; Smith et al.,1999; Shattock, 1999; Bargh et al., 2000; Whitchurch, 2006. 11These are defined here as organisations employing 500+ workers in a single site or on multiple sites. 12Dolton and Makepeace, 1982; Parry, 2006.
13Postgraduate institutions and medical schools are excluded.
FIGURE 2
VCs’ average annual real pay by institution type at 1998 prices
Note: The econometric analysis reported in this paper only uses data from 1999 to 2009 and does not include data drawn from art, music and drama colleges and from other HEIs (see text).
Source:Times Higher Education Supplement; institutions’ annual financial statements, various years.
dimensions: first, in terms of the financial performance of the university and, second, in terms of furthering the institution’s ‘mission’ or strategic plan. The latter typically includes statements on ‘widening participation’,14 excellence in teaching and research, and growth. In this particular respect, our research makes a novel contribution to the existing literature.
We also consider whether remuneration committees set VC pay with equity considerations in mind. They may not want to grant huge pay awards that may appear unjustified, in order to mitigate public outrage. On the other hand, the committee may determine to award a pay increase that would be commensurate with the earnings of other VCs, who run comparable institutions in terms of their size or nature of student intake. We explore this issue using a suitably-defined external pay ‘benchmark’, which remuneration committees are assumed to use when setting VC pay.15 Further, we also consider whether internal pay structures influence the pay-determining process and infer from this whether remuneration committees seek to preserve pay differentials within their institutions. These considerations have
14See Department for Education & Skills (2003). 15See Committee of University Chairs (2009, p. 27).
40,000 60,000 80,000 100,000 120,000 140,000 160,000 180,000 200,000
1996 1998 2000 2002 2004 2006 2008 2010 Pre-1992 Universities
Former Polytechnics
Other HE Institutions and University Colleges Art, Music and Drama Colleges
been explored before but exploited different methodologies and used more restricted data than the current study.
The data set we use covers 1999 to 2009, a period of considerable change in the funding and nature of the UK higher education sector. It should be noted that it is not our intention to explore the relationship between the personal characteristics of VCs and their pay given that most of these attributes are immutable across time. Our major focus is on the pay– performance relationship. Thus, at a more general level, this paper also contributes to the relatively small body of research on the determinants of CEO pay in the public sector with particular reference to this relationship.
The paper is arranged as follows. Section II provides a brief review of the relevant literature. Section III describes the methodology employed and Section IV presents the key features of the data. The results are presented in Section V and a summary of the conclusions is contained in Section VI.
II. Literature review
The relationship between executive pay and factors assumed, a priori, to influence such rewards has received substantial attention in the academic literature and this interest has grown considerably over the last two decades. This research is, however, almost entirely concerned with executive pay in the private sector.16 In addition to human capital theory,17 three general approaches to explain the relatively high levels of pay for CEOs can be identified in the literature: the principal–agent approach, tournament theory and the theory of managerial power.
In certain respects, VC pay in the UK can be viewed as a principal–agent problem where it is necessary to motivate the agent to act in the principal’s best interest by designing ‘optimal contracts’ where executive effort is unobserved.18 This theoretical framework points to a link between executive pay and the ‘size’ and ‘performance’ of the firm.19 In particular, within the public sector, agents may have vaguely-defined tasks and face multiple principals who may have to compete for the agent’s effort. These characteristics of public sector organisations result in agents facing several incentive structures that may offset one another, making the overall
16For comprehensive reviews of the literature, see Murphy (1999), Prendergast (1999) and Jensen,
Murphy and Wruck (2004).
17Mincer, 1974; Becker, 1993.
18See Mirrlees (1976) and Holmstrom (1979).
19See Jensen and Zimmerman (1985), Murphy (1985 and 1986), Jensen and Murphy (1990), Gregg,
Machin and Szymanski (1993), Conyon, Gregg and Machin(1995), Conyon and Murphy (2000), Conyon et al. (2000), Girma, Thompson and Wright (2007), Gabaix and Landier (2008), Frydman and Jenter (2010), Gregg, Jewell and Tonks (2010) and Bell and Van Reenen (2011).
incentive weak.20 Marsden (2010) discusses the problems of introducing performance-related schemes in the UK public sector.
A second strand uses tournament theory to explain the high level of executive pay.21 The basic framework assumes that promotion lotteries provide the necessary incentives for high-ranking executives where executive effort is again unobservable. Firms and organisations are prepared to spend large sums of money on CEO salaries and benefits to reward capability because it also serves to motivate workers at all levels in the firm to work hard for promotion. Workers are ranked according to their relative performance and winners secure the ‘prize’ (known in advance) in terms of higher pay and the opportunity to participate in subsequent promotional tournaments. The ultimate prize is the promotion to the rank of CEO. Employees are assumed to exert effort to increase the likelihood of securing the ‘prize’, and the effort expended depends on the differential in pay between a high-ranked position and a lower-ranked one, the number of competitors in the lottery and the likelihood of winning.22 It is possible that the pay package awarded to high-ranking university officers (for example, a VC) is influenced by the pay packages received by those in lower-ranked positions (for example, a pro-VC) or simply by the presence of highly-paid academics and/or administrative staff. Moreover, we may expect that a vacant VC position in a prestigious institution, noted for its quality in research and teaching, will attract more candidates for the post than a similar vacancy in a lower-ranked institution on the basis of these attributes. Thus, the likelihood of winning the ‘tournament’ and securing the post in a highly-ranked institution is lower in comparison, and pay will be higher in these institutions than in a lower-ranked one.
A third approach – the theory of managerial power – focuses on the influence CEOs exert over their own pay package. The strength of this influence will depend on their relationship with the board of directors and/or the remuneration committee.23
The determination of VC pay in UK higher education
Research into the determination of VC pay in UK higher education is limited, not least because it is often difficult to determine what exactly
20See Tirole (1994) and Dixit (2002).
21See Lazear and Rosen (1981) and Rosen (1986).
22See O’Reilly, Main and Crystal (1988), Main, O’Reilly and Wade (1993), Knoeber and Thurman
(1994), Bognanno (2001), Audas, Barmby and Treble (2004), DeVaro (2006), Clark, Kristensen and Westergard-Nielsen (2009) and Chen, Ezzamel and Cai (2011).
23Main and Johnston, 1993; Blanchard, Lopez-de-Silanes and Shleifer, 1994; Main, O’Reilly and
Wade, 1995; Conyon, 1997 and 2006; Newman and Mozes, 1999; Bertrand and Mullainathan, 2001; Bebchuk and Fried, 2003 and 2006; Acharya and Volpin, 2010; Frydman and Jenter, 2010; Morse, Nanda and Seru, 2011.
constitutes ‘performance’ in higher education (for example, income generation, research/teaching quality, student enrolment), and indeed what elements of performance are legitimately ascribed to VC effort alone.24 An early study by Baimbridge and Simpson (1996), using a cross-section of 64 VCs for the academic year 1993–94, found some evidence that pay is influenced by university income largely based on research grants and fees. Dolton and Ma (2003), using a similar specification to Baimbridge and Simpson, estimated the earnings relationship for VCs in UK HEIs using panel data covering the nine academic years from 1993–94 to 2001–02. They found some evidence that institutional characteristics such as type, size, internal pay structures, income and research performance25 exerted a positive and significant effect on VC pay.
In a more recent study, Tarbert, Tee and Watson (2008), using VC salary data for the period 1997 to 2002, modelled the relationship between pay and university performance employing dynamic pay change models. They also included controls for internal and external pay benchmarks. In contrast to Dolton and Ma (2003), they found no evidence that VC pay is influenced by observable performance measures such as university income and student recruitment. This may be unsurprising given the poor explanatory power of first-difference pay change models regardless of the definition of pay and the performance measures employed.26 However, they did find a positive and significant relationship between VC pay and the presence of ‘highly’-paid staff in the institution27 and between VC pay and the pay of VCs leading comparable HEIs. Moreover, when their sample was split between pre-1992 (‘old’) universities and post-1992 (‘new’) universities, they found evidence that changes in VC pay were related to changes in both research income and the number of postgraduate students for pre-1992 universities and to changes in the total number of students for post-1992 universities.
The foregoing review suggests that VC remuneration may be partly related to performance and not simply bureaucratically determined as predicted by agency theory. In the current paper, we investigate this
24There has been some empirical research on the determinants of the pay of college presidents in the
US. For example, Ehrenberg, Cheslock and Epifantseva (2001) found a weak link between pay and institution performance (i.e. the president’s success in securing private donations). However, they did find some evidence linking the president’s tenure and experience to pay and further evidence linking pay to institution size, type and income, though these effects are not robust across the specifications reported. Cornell (2004) found that elite US universities do not find it difficult to recruit suitable candidates for the position of president even though they are paid significantly less than and have similar skills and abilities to top corporate CEOs in the US.
25They used the scores from the Research Assessment Exercise (RAE), which inform the allocation of
government research funds to UK universities.
26See Conyon,Gregg and Machin (1995).
27‘Highly paid’ was defined as earning over £50,000. Whether this is indeed ‘high pay’ is debatable, as
mean academic pay over the sample period covered was about £33,000 (Annual Survey of Hours and Earnings, various years).
relationship using various measures of university performance including the income a university attracts from UK funding councils and other non-governmental sources and variables that can capture VC success in furthering the university’s mission or strategic plan. Therefore, we include in our analysis variables that explicitly capture certain dimensions of the university’s mission statement such as those relating to ‘widening participation’ and institution expansion. There is also evidence that internal pay structures influence VC pay, as predicted by tournament theory. Thus, as with previous studies, we include the proportion of highly-paid staff within the institution to investigate this issue. We also assess whether remuneration committees rely on external pay benchmarks in determining VC pay, using a suitably-constructed benchmark for each VC based on VC pay in similar institutions.
III. Methodology
The primary objective of this paper is to investigate the relationship between VC pay and an array of observable performance indicators, including variables that capture mission-based and financial-based performance. We do not report results for pay change models, due to their poor explanatory power,28,29 and instead model the relationship of interest by employing a VC fixed effects methodology.30 The regression model is expressed as
(1) 1 1
at time t and Xijt is a vector of time-varying VC- and institution-specific
pay-determining variables excluding those that are mission and financial performance relevant. A location-specific variable for the jth institution is
28See Tarbert, Tee and Watson (2008).
29Pay change models were also estimated. The annual difference in the log of CEO pay was used as the
regressand and the annual difference in the performance measures were used as regressors. The specifications were very poorly determined and no inference could be drawn from the estimated parameters. Conyon, Gregg and Machin (1995) discuss the problems associated with models of this kind.
30We favour the use of individual VC rather than institution fixed effects in this application because we
believe the remuneration package offered is more strongly influenced by the attributes the individual brings to the job than by the characteristics of the institution. In addition, we believe the assumption of invariant individual attributes is more persuasive in the current context than the assumption of time-invariant institutional characteristics, given the rapidly changing nature of the university landscape in the UK over the period covered by our analysis. However, the robustness of our results is investigated using an alternative model containing institutional fixed effects also (see Table A2 of the online appendix, available at http://www.ifs.org.uk/docs/fsmar15_bachan&reilly_appendix.pdf).
also included in X to capture local economic conditionsthat may influence VC pay (here captured using the log of average county-level house prices).
The vector Xijt also includes an external benchmark pay variable
reflecting the pay awarded to VCs of comparable universities. This variable is constructed for each year in the data set according to the type of university (‘old’ or ‘new’) and the institution size determined by the total number of full-time-equivalent (FTE) students (undergraduate and postgraduate). By university type, each university is arranged in ascending order according to the total number of FTE students. The universities are then grouped into fives, starting from the smallest institution. Within each group and for each VC, the average group pay is calculated excluding the pay of the VC who is subjected to the benchmark. This variable is calculated for all VCs and its natural log is used to define the external benchmark pay that remuneration committees potentially use to inform their pay awards.31 It enters the regression model (1) lagged by one year. We expect VC pay to be positively related to this variable, indicating that as the pay of comparable VCs increases, so too does the pay of the VC under consideration.
Zijt–1 is a vector of lagged-one-year mission-based performance measures
and Vijt–1 is a vector of lagged-one-year financial performance variables. A
set of year-specific dummies, Dt, is also included, to capture exogenous
events that are taken to commonly affect all VCs over time. Finally, the unknown parameters αi (the intercepts) are the VC fixed effects assumed to
capture differences across VCs in terms of their unobservable characteristics.
IV
. Data
The data employed in this paper were collected from a variety of sources listed in the online data appendix.32 The data include information on the 193 VCs who led 95 UK universities between 1998–99 and 2008–09 (inclusive). Once allowance is made for missing values, these data represent an unbalanced panel comprising 1,045 observations.33 As described in the previous section, we use information on VC pay, individual characteristics and variables that capture mission-based and financial-based performance. It should be noted that the mission-based performance data used in this study are only available for all institutions from 1997–98. The pay and all other
31This was confirmed by interviews with the VCs’ personal assistants (PAs) in a number of
universities. It would appear that in setting VC pay, one important source of information available to remuneration committees is the pay of VCs (assumed to be the previous year’s pay) in ‘comparable’ institutions. In the interviews, PAs also indicated that university type and size of institution by number of students were important considerations in framing VC pay.
32http://www.ifs.org.uk/docs/fsmar15_bachan&reilly_appendix.pdf.
33There were 125 exits in the data, including 90 retirements and 13 others appointed VC at universities
not included in our sample.
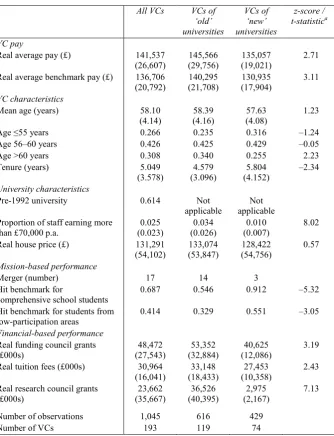
TABLE 1
Summary statistics at vice-chancellor level
All VCs VCs of
Real average benchmark pay (£) 136,706 (20,792)
Pre-1992 university 0.614 Not applicable
Not applicable Proportion of staff earning more
than £70,000 p.a.
Hit benchmark for students from low-participation areas
Real tuition fees (£000s) 30,964 (16,041)
Number of observations 1,045 616 429
Number of VCs 193 119 74
az-scores are used to test differences in proportions between the characteristics of VCs of ‘old’ and ‘new’
universities; t-statistics are used to test differences in means. The critical value at the 0.05 level using a two-tailed test is ±1.96. The null of no association between university type and the VC age categories is upheld by the data using a χ2
test with two degrees of freedom. The test value is 3.172 and the corresponding p-value is 0.205.
Note: Standard deviations are reported in parentheses beneath the means for continuous variables only.
financial data used are expressed in real terms and adjusted to reflect 1998 prices.34 The associated summary statistics computed at the level of the VC are reported in Table 1 and are the focus of the discussion below.35
We exclude from our analysis postgraduate institutions, medical schools, university colleges and other HEIs including art, drama and music colleges, as relevant performance data are unavailable for these institutions for our time period. Moreover, these institutions differ from ‘old’ and ‘new’ universities in terms of their size and the nature of the programmes of study offered. We thus focus our analysis on the pay–performance relationship for VCs of ‘new’ and ‘old’ universities, which we argue represent a more homogeneous group and for which performance data are readily available for the period under review here. Furthermore, it is the pay of these VCs that attracts most public attention and criticism. The set of ‘old’ universities accounts for about 59 per cent of the sample (see Table A1 of the online appendix). The institutions that are included in the analysis are detailed in Table A3 of the appendix.36
The annual data on VC pay were obtained from the Times Higher
Education Supplement (THES), and university financial accounts for the
period covering 1998–99 to 2008–09 were also used. The pay data used include any performance-related pay and an estimated value of benefits in kind but exclude pension contributions made by the institution. It is not possible to distinguish between the elements that comprise the final pay from information provided. The mean pay over the sample period is £141,537 at 1998 prices. The sample data also reveal that VCs of ‘old’ universities were paid, on average, close to 8 per cent more than their counterparts in ‘new’ universities.
Human capital variables such as age, tenure and experience are expected to enhance VC pay. Thus, we include the time-varying covariates of age and tenure of the VC in our analysis. Age enters the analysis as a set of mutually exclusive dummy variables reflecting the VC’s age at time t. These data reveal that the average age is just over 58 years and there is no significant difference in mean age between those VCs heading the two types of institution. We note that ‘old’ universities employ proportionately more VCs who are sexagenarians (34 per cent versus 25 per cent). The average length of tenure (years in post) is just over five years, but VCs in ‘new’ universities, on average, have been in post for just over a year longer than their counterparts in ‘old’ universities (5.8 years versus 4.6 years). Of course, it is
34We use the RPI (all items) available at http://www.ons.gov.uk/ons/rel/cpi/consumer-price-indices/
december-2013/cpi-time-series-data.html (accessed June 2010).
35Summary statistics at the university level, which are broadly similar to those reported in Table 1, are
reported in Table A1 of the online appendix for comparison.
36http://www.ifs.org.uk/docs/fsmar15_bachan&reilly_appendix.pdf.
readily acknowledged that these comparisons may be misleading as they are based on incomplete tenure durations in some cases.
As noted in Section II, tournament theory suggests that the presence of highly-paid staff in an institution drives up the pay of CEOs or other senior directors. In the context of a university, such highly-paid staff generally comprise senior executives and professors. Data on the pay of senior executives and professors are not publicly available but we do have information on the number and proportion of academic and non-academic staff earning in excess of £70,000 for each year.37 On average, about 2.5 per cent of university staff earn over £70,000, but the proportion is higher for the ‘old’ universities.
There has been considerable growth in student enrolments in UK higher education over the 11-year period spanning these data. Institutions have also invested heavily in developing and expanding their teaching and learning environments. Such expansion can reflect investment in new facilities both in the UK and abroad or can be brought about through merging with other institutions. These developments can be seen as part of the university’s mission and successful expansion through a merger or acquisition may be attributed to successful leadership and good strategic management. We would expect VC pay to reflect such outcomes. In these data, we note that there have been 17 episodes of major mergers over the period. It is clear that in most cases VCs in ‘old’ universities were more active in this regard.
Many universities have missions to ‘widen participation’ by attracting students from socially disadvantaged groups and from areas where university participation is low. We use two measures to capture institutional performance along this dimension. These are the percentage of students that universities enrol from areas where traditionally there has been low participation in higher education (i.e. areas where participation rates are less than two-thirds of the national figure) and the percentage of young students enrolled from state comprehensive schools. Each university is given a ‘benchmark’ intake for students from state comprehensive schools and under-represented areas, which is expressed as a percentage of its first-year intake number. The ‘benchmark’ used is calculated as a sector average, which is adjusted for the university’s subject mix, student qualifications and age on entry. The data reveal that just under 69 per cent of all VCs achieve their benchmark figure in attracting students from comprehensive schools, but they do less well in attracting students from traditionally
low-37Although universities reported the number of staff earning over £100,000 over the sample period,
many did not or reported a zero figure in their annual financial statements. This was generally the case with many ‘new’ universities. The number/proportion of staff earning over £100,000 was very small – in many cases less than 1 per cent – except for a few large civic universities. The estimated effect for the variable proved insignificant in the regressions undertaken and the variable was omitted from subsequent analysis. Most universities registered some staff earning over £70,000 over the period and this variable was thus used in the analysis reported.
participation areas, with less than half achieving the benchmark figure. Moreover, it appears, perhaps unsurprisingly, that VCs in ‘new’ universities have been more successful in widening participation for these particular groups of students.
We expect VC pay to be positively related to university income, as a reward for sound financial management and leadership. We employ three income variables to test this proposition: income in the form of UK funding council block grants for general teaching and research and capital expenditure; tuition fees and educational grants; and income from externally-sponsored sources (i.e. research grants and contracts from UK research councils and other UK and non-UK funding sources). The sample mean incomes from these sources are about £48.5 million, £31.0 million and £23.7 million respectively. It is clear that the VCs of ‘old’ universities attracted significantly more income from these sources than those in ‘new’ universities.
We do not, however, include other putative measures of institution performance, such as the outcomes from various rounds of the Research Assessment Exercise (RAE; a measure of university research performance used to allocate government research funds) and the Teaching Quality Assessment (TQA; an assessment of teaching quality across a selection of subjects). This is because there have been major changes over time in the methods used to calculate the RAE scores, rendering the published figures difficult to compare and interpret. Also, in many cases, we are unable to attribute RAE scores to the effort of a single VC. The TQA was not repeated for most subjects and, in any event, scores are not available for many institutions.38
V. Empirical results
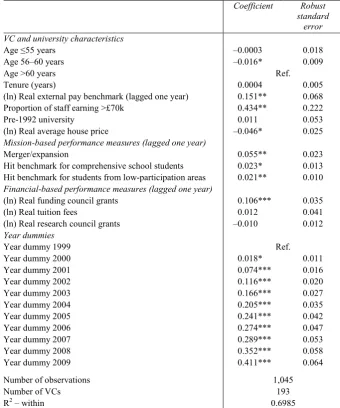
The regression estimates based on equation (1) using VC fixed effects are reported in Table 2.39 On the basis of the goodness-of-fit measure reported, the specification fits the data well by the standards of broadly comparable fixed effects applications.40 We also note that the estimated coefficients for the academic year dummies are jointly well determined at a conventional level and suggest ceteris paribus a steady monotonic increase in VC pay over time. In general, the point estimates suggest substantial pay inflation since the academic year 1998–99 once we control for individual fixed effects
38See Higher Education Funding Council for England for a description of the methods used to calculate
the RAE score: http://www.hefce.ac.uk/research/ref/reform/.
39A Hausman test was conducted to test whether a random effects model was preferable to the VC
fixed effects specification expression (1). The resultant χ2 statistic with 23 degrees of freedom = 33.65
(p = 0.0704) favours the fixed over a random effects parameterisation in the current application.
40For example, see Gregg, Jewell and Tonks (2010) and Fabbri and Marin (2012).
TABLE 2
Vice-chancellor pay and performance: VC fixed effects estimator
Coefficient Robust standard
error VC and university characteristics
Age ≤55 years –0.0003 0.018
Age 56–60 years –0.016* 0.009
Age >60 years Ref.
Tenure (years) 0.0004 0.005
(ln) Real external pay benchmark (lagged one year) 0.151** 0.068 Proportion of staff earning >£70k 0.434** 0.222
Pre-1992 university 0.011 0.053
(ln) Real average house price –0.046* 0.025 Mission-based performance measures (lagged one year)
Merger/expansion 0.055** 0.023
Hit benchmark for comprehensive school students 0.023* 0.013 Hit benchmark for students from low-participation areas 0.021** 0.010 Financial-based performance measures (lagged one year)
(ln) Real funding council grants 0.106*** 0.035
(ln) Real tuition fees 0.012 0.041
(ln) Real research council grants –0.010 0.012 Year dummies
Year dummy 1999 Ref.
Year dummy 2000 0.018* 0.011
Year dummy 2001 0.074*** 0.016
Year dummy 2002 0.116*** 0.020
Year dummy 2003 0.166*** 0.027
Year dummy 2004 0.205*** 0.035
Year dummy 2005 0.241*** 0.042
Year dummy 2006 0.274*** 0.047
Year dummy 2007 0.289*** 0.053
Year dummy 2008 0.352*** 0.058
Year dummy 2009 0.411*** 0.064
Number of observations 1,045
Number of VCs 193
R2 – within 0.6985
Note: The robust standard errors are corrected for clustering at the level of the VC. * denotes significant at 10 per cent, ** denotes significant at 5 per cent and *** denotes significant at 1 per cent, all using two-tailed tests. ‘Ref.’ denotes base category in estimation.
and other pay-determining characteristics.41 The estimated coefficient on the university type dummy is not significantly different from zero in our specification, suggesting no ceteris paribus differential in pay across ‘old’ and ‘new’ universities. It is readily acknowledged that this may be explained by the fact that the VC fixed effects absorb most of its variation such that the estimated effect is identified through the small number of VCs who switch between these two types of universities, so some interpretational caution is required here.
Age enters as a set of dummy variables corresponding to the age group to which the VC belongs at time t. Those VCs in the 56–60 age group are paid less on average than those aged over 60. The point estimate suggests that a VC in the younger of these two age groups is paid, on average and ceteris
paribus, about 1.6 per cent less. There also appear to be no significant
differences in VC pay between those who are 55 years or under and those aged over 60. This particular result may be capturing a quality effect where the bidding for talent, through the award of higher pay, is independent of age. In addition, we find no evidence that VC pay is influenced by tenure.42
Typically, the remuneration committee sets pay awards for professors and other senior staff prior to determining the pay of their VC.43 It is assumed that such committees have information regarding the pay awards granted to senior or highly-paid staff in any given year when setting their own VC’s pay. Our results in this regard confirm findings from earlier research. There is evidence that VC pay is positively influenced by the presence of highly-paid staff in the institution (i.e. staff earning in excess of £70,000). The point estimate suggests that a 1 percentage point increase in the proportion of staff earning in excess of £70,000, on average and ceteris paribus, raises VC pay by about 0.43 per cent.
We argue that remuneration committees use an external pay benchmark to inform the annual pay of their VC. The external benchmark will typically be the pay awarded to VCs in institutions comparable in terms of size and type.44 We argue that it is unlikely remuneration committees will know the current pay awarded to VCs in comparable institutions, though we assume they will have information on the previous year’s awards. To capture this effect, our measure of the external pay benchmark is lagged by one year. 41VC pay and other financial data were also transformed to real variables using the consumer price
index and the average pay index for the public sector (including bonuses) available at http://www.ons.gov.uk/ons/ (accessed January 2014). These transformations made no material difference to the results reported in Table 2.
42We also created a VC previous experience dummy variable capturing whether or not the incumbent
had previously been appointed a VC at another university (including non-UK universities) and included this as a regressor. The estimated coefficient was statistically insignificant (|t|=1.02 [p=0.31]). In addition, the exclusion of this variable made no material difference to the empirical results for the key performance variables reported in Table 2. It was therefore dropped from further analysis.
43Tarbert, Tee and Watson, 2008.
44See Committee of University Chairs (2009, p. 27).
The estimated coefficient for this variable is well determined and the corresponding point estimate suggests that a 1 per cent increase in relative VC pay in comparable institutions (in the previous year) increases VC pay, on average and ceteris paribus, by about 0.15 per cent.45 This suggests that external benchmarking influences the framing of VC pay even after controlling for institution performance and VC individual fixed effects.
The average county-level house price enters the regression model (in logged form) to control for regional economic conditions that may impact on local living costs. A significant but negative effect is detected. This seems counterintuitive, but could reflect the receipt of some form of payment in ‘kind’, such as subsidised housing or transport costs, provided to those VCs living in areas where the cost of living is high. This may be particularly the case for VCs at universities in major cities or the heads of prestigious universities such as Oxford and Cambridge known to provide accommodation in kind and where VC pay is sometimes relatively modest.46
We now turn attention to the relationship between VC pay and mission and financial performance indicators. We first review the estimates for the variables assumed to capture dimensions of the university mission: growth and widening participation. One way in which an institution may grow is through an acquisition or merger, and the management of such a growth strategy appears to enhance VC pay by about 5.5 per cent per annum. There is also a significant effect detected for reaching the benchmark level for admitting students from areas where university participation has traditionally been low. The point estimate suggests that a VC in charge of a university achieving the relevant benchmark earns, on average and ceteris paribus, a 2.1 per cent pay premium. In addition, reaching the benchmark set for student intake from comprehensive schools enhances VC pay by a similar magnitude.47
Now we examine the role of university income variables that reflect one dimension of an institution’s financial performance. These comprise, as already noted, funding council grants, tuition fees and grants from research councils received in the previous year. Only the estimated coefficient on the
45We also experimented with a wider external benchmark measure comparing incumbent VC pay in
groups of six (rather than five) comparable institutions. The estimated coefficient remained significant but reduced in magnitude.
46Regressions that excluded the VCs of Oxford and Cambridge were also estimated but this had no
effect on the sign and significance of the estimated house price coefficient.
47We also estimated models including variables that capture the extent to which the two benchmarks
were reached in place of the mission-based dummies. The estimated coefficients suggested that VC pay increases by about 2.9 per cent if the proportion of students from low-participation areas increases by 1 percentage point above its benchmark figure and by about 1.3 per cent for a similar increase in the proportion of students from comprehensive schools. However, this latter effect was not statistically significant at a conventional level. The inclusion of these variables made no material difference to the significance and size of the other coefficients reported in Table 2 except that the age variables became insignificant.
funding council grant achieves statistical significance at a conventional level. The point estimate suggests that a 1 per cent increase in funding council grants increases VC pay by just over 0.1 per cent, on average and
ceteris paribus. Although statistically insignificant, the negative coefficient
on research council grants has been detected in previous studies.48 The poorly-determined nature of some of the financial performance measures may be due to the high correlations between these variables.49
As a check of the robustness of the results reported above, we re-estimate specification (1) using university rather than VC fixed effects. The results using institution fixed effects are reported in Table A2 of the online appendix along with the results already reported in Table 2 to permit a direct comparison.50 We note that the signs of the estimated coefficients are broadly similar for the two models and some of the estimated effects remain stable across the two specifications. The effects of internal pay structure and the external pay benchmark remain significant across the two specifications, although the external pay benchmark now yields twice the estimated effect. The coefficient on the merger variable remains significant and its estimate is now numerically larger than when VC fixed effects are included. In terms of financial performance, the effect of attracting funding council grants remains robust across the two specifications. The impacts reported for the year dummies, though still significant and exhibiting a monotonic increase, are attenuated by about one-half in most cases. Further, VC pay is not found to be affected by success in ‘widening participation’ when the set of university fixed effects are used in estimation. This may be attributable to the fact that the institutional fixed effects absorb most of the variation associated with the two measures of participation. This is perhaps to be anticipated since these social inclusion measures reflect explicit university policy. Overall, these results taken together provide for a general degree of confidence in the robustness of the results reported in Table 2, when VC fixed effects were used.
VI. Conclusion
There has been recent public interest in the determination of CEO pay in the public sector. This paper empirically examines the relationship between university vice chancellor pay and mission-based and financial performance indicators over an 11-year period for the UK. In addition, the data employed
48See Dolton and Ma (2003) and Tarbert, Tee and Watson (2008).
49The correlation coefficients are 0.65 (p = 0.00) between research council grants and funding council
grants, 0.56 (p = 0.00) between research council grants and tuition fees and 0.75 (p = 0.00) between funding council grants and tuition fees.
50The correlation coefficient between the 95 current VC fixed effects and the comparable university
fixed effects is 0.75, suggesting a high intercorrelation between the institutional and individual unobservables in this application.
allow examination of the influence internal and external pay benchmarks exert on the VC pay determination process. These variables, we argue, capture some of the information that remuneration committees utilise when determining VC pay. Our results confirm some of the findings reported in earlier research on this topic. Moreover, we offer new evidence of a relationship between VC pay and mission-based performance measures and provide some insights into the factors considered by remuneration committees in determining pay.
We find evidence that VCs are rewarded according to internal pay structures as predicted by tournament theory. This may not be that surprising given UK universities employ highly-paid financial and marketing staff to manage and identify changing income streams (for example, income from research/consultancy contracts and new markets for overseas students). Moreover, universities with business and/or medical schools now have to compete for high-quality academics who command high salaries. The evidence suggests that the presence of highly-paid staff impacts positively on VC pay. It is also interesting to note that just over one-fifth of the VCs in our data reach their position through internal promotion. Of these, 55 per cent were in ‘new’ and 45 per cent in ‘old’ universities. This may further suggest that ‘tournaments’ impact positively on VC pay if internal promotion reflects success in a promotional contest.
Similarly, the remuneration committee may seek to set VC pay commensurate with the pay awards of VCs at comparable institutions in regard to the guidelines set by the Committee of University Chairs (2009, p. 27). We find evidence that this is indeed the case and our finding is congruent with that reported by Tarbert, Tee and Watson (2008). Such pay awards may also represent a signal of comparable quality and assist retention, thus reducing the costly process of recruitment. Moreover, comparative pay awards may also be used by the remuneration committee to justify the increase in pay to relevant stakeholders (for example, lecturer unions, academic staff and students). However, our results reveal that the effect is fairly inelastic, suggesting that the responsiveness of the remuneration committee to VC pay in other comparable universities is relatively low.
We find new evidence of a relationship between VC pay and mission- and financial-based performance measures. There is evidence that VC pay is affected by ‘widening participation’, which is now a key feature of the mission statements and strategic plans of many universities, and indeed many VCs may be mission driven. However, when university rather than VC fixed effects are used in the analysis, neither of the social inclusion measures used achieves statistical significance at a conventional level. This may be reflective of different missions between ‘old’ and ‘new’ universities, though is more likely attributable to the fact that these measures for social inclusion
are highly correlated with the institutional fixed effects. We also find that VCs are compensated financially for securing steady financial flows through funding council grants as a possible reward for sound financial management, although the responsiveness of VC pay to this variable is again fairly inelastic. Overall, our results provide evidence that VCs are not entirely paid like public sector bureaucrats but good management and furthering the institution’s mission are rewarded. It may be the case, therefore, that VC pay is more merited than some of the harsher public criticism suggests. However, there is evidence from the estimated year effects that even after controlling for a rich array of observable and unobservable factors, there have been sizeable annual increases in real VC pay in the years covered by our analysis that are not readily explainable.
Modelling the relationship between CEO pay and performance in the public sector is not an easy task. Estimating the relationship between VC pay and performance is also fraught with difficulties given data constraints. Our results suggest that institutional performance, external benchmarks and internal pay structures or tournaments play an important role in the pay-determining process. Nevertheless, if more detailed data on internal university pay structures (such as the pay of professors or other highly-paid staff) are made accessible or if compatible performance data on other aspects of performance not covered in this research (such as teaching and research) become available, more fruitful insights into this pay–performance relationship may be gleaned. In addition, following Tarbert, Tee and Watson (2008), the role of alternative external benchmarks in determining VC remuneration based on the pay of CEOs in other public sector institutions could also be investigated as part of an agenda for future research.
We were unable to test the theory of managerial power in the VC labour market due to the limited availability of relevant data. In order to do so, more detailed data on the composition and pay of the members of the remuneration committee and other stakeholders are required. Such information is not readily accessible, but this also provides an obvious area for future research on VC pay. Finally, it remains to be seen how, if at all, the VC pay–performance gradient is affected by the recently-introduced levy of higher tuition fees.
References
Acharya, V. and Volpin, P. (2010), ‘Corporate governance externalities’, Review of Finance, vol. 14, pp. 1–33.
Audas, R., Barmby, T. and Treble, J. (2004), ‘Luck, effort, and reward in an organisational hierarchy’, Journal of Labor Economics, vol. 22, pp. 375–95.
Baimbridge, M. and Simpson, C. (1996), ‘Rewards to academia: the remuneration of vice chancellors and principals’, Applied Economics, vol. 28, pp. 631–9.
Bargh, C., Bocock, J., Scott, P. and Smith, D. (2000), University Leadership: The Role of the Chief Executive, Maidenhead: Society for Research into Higher Education (SRHE) and Open University Press.
Bebchuk, L. and Fried, J. (2003), ‘Executive compensation as an agency problem’, Journal of Economic Perspectives, vol. 17, no. 3, pp. 71–92.
— and — (2006), ‘Pay without performance: overview of the issues’, Academy of Management Perspectives, vol. 20, pp. 5–24.
Becker, G. S. (1993), Human Capital:A Theoretical and Empirical Analysis, with Special Reference to Education, third edition, Chicago, IL: University of Chicago Press.
Bell, B. and Van Reenen, J. (2011), ‘Firm performance and wages: evidence from across the corporate hierarchy’, London School of Economics, Centre for Economic Performance (CEP), Discussion Paper no. 1088.
Bertrand, M. and Mullainathan, S. (2001), ‘Are CEOs rewarded for luck? The ones without principals are’, Quarterly Journal of Economics, vol. 116, pp. 901–32.
Blanchard, O., Lopez-de-Silanes, F. and Shleifer, A. (1994), ‘What do firms do with cash windfalls?’, Journal of Finance and Economics, vol. 36, pp. 337–60.
Bognanno, M. (2001), ‘Corporate tournaments’, Journal of Labor Economics, vol. 19, pp. 290–315.
Chen, J., Ezzamel, M. and Cai, Z. (2011), ‘Managerial power theory, tournament theory, and executive pay in China’, Journal of Corporate Finance, vol. 17, pp. 1179–99.
Clark, A., Kristensen, N. and Westergard-Nielsen, N. (2009), ‘Job satisfaction and co-worker wages: status or signal’, Economic Journal, vol. 119, pp. 430–47.
Committee of University Chairs. (2009), Guide for Members of Higher Education Governing Bodies in the UK: Governance Code of Practice and General Principles, Bristol: Higher Education Funding Council for England (HEFCE).
Conyon, M. (1997), ‘Corporate governance and executive compensation’, International Journal of Industrial Organization, vol. 15, pp. 493–510.
— (2006), ‘Executive compensation and incentives’, Academy of Management Perspectives, vol. 20, pp. 25–44.
—, Gregg, P. and Machin, S. (1995), ‘Taking care of business: executive compensation in the United Kingdom’, Economic Journal, vol. 105, pp. 704–14.
— and Murphy, K. (2000), ‘The prince and the pauper? CEO pay in the United States and the United Kingdom’, Economic Journal, vol. 110, pp. F640–71.
—, Peck, S., Read, L. and Sadler, G. (2000), ‘The structure of executive compensation contracts: UK evidence’, Long Range Planning, vol. 33, pp. 478–503.
Cornell, B. (2004), ‘Compensation and recruiting: private universities versus private corporations’,Journal of Corporate Finance, vol. 10, pp. 37–52.
Data.Gov.UK, ‘Senior officials “high earners” salaries 2011’, HM Government (http://data.gov.uk/dataset/uk-civil-service-high-earners).
Department for Education & Skills (2003), The Future of Higher Education, Cm. 5735, Stationery Office.
DeVaro, J. (2006), ‘Strategic promotion tournaments and worker performance’, Strategic Management Journal, vol. 27, pp. 721–40.
Dixit, A. (2002), ‘Incentives and organizations in the public sector’, Journal of Human Resources, vol. 37, pp. 696–727.
Dolton, P. and Ma, A. (2003), ‘CEO pay in the public sector: the case of vice chancellors in UK universities’, Newcastle University, Discussion Paper in Economics.
— and Makepeace, G. (1982), ‘University typology: a contemporary analysis’, Higher Education Review, vol. 13, pp. 33–47.
Ehrenberg, R., Cheslock, J. and Epifantseva, J. (2001), ‘Paying our presidents: what do trustees value?’, Review of Higher Education, vol. 25, pp. 15–37.
Fabbri, F. and Marin, D. (2012), ‘What explains CEO pay in Germany? A panel data analysis for 1977–2009’, Institute for the Study of Labor (IZA), Discussion Paper no. 6420.
Farnham, D. and Jones, J. (1998), ‘Who are the vice chancellors and principals in the UK? An analysis of their professional and social backgrounds 1990–1997’, Higher Education Review, vol. 30, pp. 42–58.
Frydman, C. and Jenter, D. (2010), ‘CEO compensation’, Annual Review of Financial Economics, vol. 2, pp. 75–102.
Gabaix, X. and Landier, A. (2008), ‘Why has CEO pay increased so much?’, Quarterly Journal of Economics, vol. 123, pp. 49–100.
Girma, S., Thompson, S. and Wright, P. (2007), ‘Corporate governance reforms and executive compensation determination: evidence from the UK’, The Manchester School, vol. 75, pp. 65–81.
Gregg, P., Jewell, S. and Tonks, T. (2010), ‘Executive pay and performance in the UK’, London School of Economics, Financial Markets Group (FMG), Discussion Paper no. 657.
—, Machin, S. and Szymanski, S. (1993), ‘The disappearing relationship between directors’ pay and corporate performance’, British Journal of Industrial Relations, vol. 31, pp. 1–10. Holmstrom, B. (1979), ‘Moral hazard and observability’, Bell Journal of Economics, vol. 10,
pp. 74–91.
Hutton, W. (2011), Hutton Review of Fair Pay in the Public Sector: Final Report, London: HM Treasury.
Jensen, M. and Murphy, K. (1990), ‘Performance pay and top-management incentives’, Journal of Political Economy, vol. 98, pp. 225–64.
—, — and Wruck, E. (2004), ‘Remuneration: where we’ve been, how we got to here, what are the problems, and how to fix them’, Harvard, NOM (Negotiations, Organizations and Markets) Working Paper no. 04-28 and European Corporate Governance Institute (ECGI), Finance Working Paper no. 44/2004.
— and Zimmerman, J. (1985), ‘Management compensation and the managerial labor market’, Journal of Accounting and Economics, vol. 7, pp. 3–9.
Knoeber, R. and Thurman W. (1994), ‘Testing the theory of tournaments: an empirical analysis of broiler production’, Journal of Labor Economics, vol. 12, pp. 155–79.
Lazear, E. and Rosen, S. (1981), ‘Rank-order tournaments as optimal labor contracts’, Journal of Political Economy, vol. 89, pp. 841–64.
Main, B. and Johnston, J. (1993), ‘Remuneration committees and corporate governance’, Accounting and Business Research, vol. 23, pp. 351–62.
—, O’Reilly, C. and Wade, J. (1993), ‘Top executive pay: tournament or teamwork?’, Journal of Labor Economics, vol. 11, pp. 606–28.
—, — and — (1995), ‘The CEO, the Board of Directors, and executive compensation: economic and psychological perspectives’, Industrial and Corporate Change, vol. 11, pp. 606–28.
Marsden, D. (2010), ‘The paradox of performance related pay systems: why do we keep adopting them in the face of evidence that they fail to motivate?’, in H. Margetts, P. 6 and C. Hood (eds), Paradoxes of Modernization: Unintended Consequences of Public Policy Reform, Oxford: Oxford University Press.
Mincer, J. (1974), Schooling, Experience and Earnings, New York: National Bureau of Economic Research.
Mirrlees, J. (1976), ‘The optimal structure of incentives and authority within an organisation’, Bell Journal of Economics, vol. 7, pp. 105–31.
Morse, A., Nanda, V. and Seru, A. (2011), ‘Are incentive contracts rigged by powerful CEOs?’, Journal of Finance, vol. 66, pp. 1779–821.
Murphy, K. (1985), ‘Corporate performance and managerial remuneration: an empirical analysis’, Journal of Accounting and Economics, vol. 7, pp. 11–42.
— (1986), ‘Incentives, learning, and compensation: a theoretical and empirical investigation of managerial labor contracts’, Rand Journal of Economics, vol. 17, pp. 69–76.
— (1999), ‘Executive compensation’, in O. Ashenfelter and D. Card (eds), Handbook of Labor Economics, Volume 3, Amsterdam: North Holland.
Newman, H. and Mozes, H. (1999), ‘Does the composition of the compensation committee influence CEO compensation practices?’, Financial Management, vol. 28, pp. 41–53. O’Reilly, C., Main, B. and Crystal, G. (1988), ‘CEO compensation as tournament and social
comparison: a tale of two theories’, Administrative Science Quarterly, vol. 33, pp. 273–4. Parry, G. (2006), ‘Policy-participation trajectories in English higher education’, Higher
Education Quarterly, vol. 60, pp. 392–412.
Prendergast, C. (1999), ‘The provision of incentives in firms’, Journal of Economic Literature, vol. 37, pp. 7–63.
Rosen, S. (1986), ‘Prizes and incentives in elimination tournaments’, American Economic Review, vol. 76, pp. 701–15.
Shattock, M. (1999), ‘Governance and management incentives: the way we live now’, Journal of Education Policy, vol. 14, pp. 271–82.
Smith, D., Bargh, C., Bocock, J. and Scott, P. (1999), ‘New leaders at the top? The educational and career paths of UK university vice-chancellors (1960–1996)’, Higher Education Management, vol. 11, pp. 113–35.
Tarbert, H., Tee, K. and Watson, R. (2008), ‘The legitimacy of pay and performance comparisons: an analysis of UK university chancellors pay awards’, British Journal of Industrial Relations, vol. 46, pp. 771–805.
Tirole, J. (1994), ‘The internal organisation of government’, Oxford Economic Papers, vol. 46, pp. 1–29.
Whitchurch, C. (2006), ‘Who do they think they are? The changing identities of professional administrators and managers in UK higher education’, Journal of Higher Education Policy and Management, vol. 28, pp. 159–71.