THIS REPORT CONTAINS ASSESSMENTS OF COMMODITY AND TRADE ISSUES MADE BY USDA STAFF AND NOT NECESSARILY STATEMENTS OF OFFICIAL U.S. GOVERNMENT POLICY
Date: GAIN Report Number:
Approved By:
Prepared By:
Report Highlights:
Apple production in Mexico for marketing year (MY) 2017/18 (August/July) is forecast at 720,000 metric tons (MT), a slightly larger crop compared to MY 2016/17. Total pear imports for MY 2017/18 (July/June) are forecast to be higher compared to MY 2016/17 due to expected good demand. Total Mexican table grape production for MY 2017/17 (May/April) is forecast at 290,000 MT and grape exports are expected to increase to about 193,000 MT due to a good crop. The United States remains the major supplier of deciduous fruits to Mexico.
Dulce Flores Lashonda McLeod
More Deciduous Fruit Being Produced
Fresh Deciduous Fruit Annual
Mexico
MX7051
11/1/2017
MX7051 More Deciduous Fruit Being Produced Page 2
New/Post total area planted for MY 2017/18 is forecast to decrease marginally from New/Post MY 2016/17 area, as increases in some states are offset by decreases in other areas. New/Post planted and harvested areas for MY 2016/17 were revised downward based on official estimates from the Secretariat of Agriculture, Livestock, Rural Development, Fisheries and Food (SAGARPA). States like Coahuila, Durango, and Puebla have decreased area planted from MY 2016/17 to MY 2017/18 as producers are discouraged from continuing with the crop due to problems with marketing domestic apples. New/Post area planted and harvested for MY 2015/16 remains unchanged from previous estimates based on official data. Almost 43 percent of the area in Mexico is planted with the Golden Delicious variety and 34 percent with the Red Delicious variety. The state of Chihuahua accounts for 47 percent of total area planted in Mexico, of which, 58 percent is planted with the Golden Delicious variety and 30 percent with the Red Delicious variety. The state of Durango accounts for 15 percent, Puebla accounts for 15 percent, and Coahuila accounts for 10 percent of planted area. Growers indicated that Mexico’s planted area is not expected to expand much due to higher costs of production, limited credit availability, water scarcity, and limited market expansion. Mexico’s main harvest season is between August and October.
According to producers, the Gala variety comprises about five percent of the total planted area in Mexico. New crop Gala and Golden Supreme varieties from Chihuahua enter the market in mid-August. Near the end of August, the Red Delicious apple harvest starts. Golden Delicious apples are harvested in September. Rome Beauty apples are usually harvested in early October, and all harvesting in the state of Chihuahua is completed by the end of October. Producers in Chihuahua generally use more advanced production technology than in other states, resulting in higher-quality apples. Industry sources report that large-scale and technologically sophisticated growers in Chihuahua are renewing old orchards and planting with greater tree densities as well as slowly increasing planted area. There is also more investment in hail protection and in cold storage facilities using controlled atmosphere
technology. According to growers, more than 60 percent of the apple area in Chihuahua has irrigation infrastructure, via sprinklers, micro sprinklers, and drip irrigation. Most areas in Durango are also irrigated.
In order to remain competitive, large producers in Chihuahua continue replacing a number of older orchards with higher yielding (about 80 MT/hectare (Ha)) and higher density apple trees (1,000 trees/Ha or more). The remainder of the apple producing area is planted at more traditional spacing of 350-400 trees per hectare. Smaller producers tend to remain with the same area density as they cannot afford to invest. High-density production accounts for approximately 30 percent of Chihuahua’s planted area.
Production
Grapes, Table, Fresh Pears, Fresh
MX7051 More Deciduous Fruit Being Produced Page 3
According to sources, apple production in Mexico is expected to be somewhat low and sizes of apples are expected to be slightly smaller than the previous marketing year. Therefore the forecast for MY 2017/18 (August/July) of apple production is expected at about 720,000 MT. Average yields are forecast at about 13 MT/Ha. The state of Chihuahua, the main apple producing state, is expected to have a crop of about 580,000 MT to 590,000 MT for MY 2017/18. Due to weather issues and hail for MY 2017/18, the apple crop in Chihuahua is expected to be slightly lower and is expected to have smaller-sized apples compared to MY 2016/17. Yields in Chihuahua are usually the highest in the country and average between 15-25 MT/Ha or more for well-tended orchards. Yields in the state of Durango, the second-largest producing state, are at about 4 to 5 MT/Ha, the states of Coahuila and Puebla have yields of about 5 to 6 MT/Ha.
Table 1. Mexico: Apple Production for Selected States
Metric Tons
Apple Production MY 2015/16 MY 2016/17
Chihuahua 593,937 586,593
Durango 66,131 42,224
Coahuila 26,224 20,832
Puebla 33,703 37,113
Total Mexico 750,324 716,930
Source: Secretariat of Agriculture, Livestock, Rural Development, Fisheries and Food./ Agrifood and Fisheries Information System. (Secretaria de Agricultura, Ganaderia, Desarrollo Rural, Pesca y Alimentacion./ Servicio de Informacion Agroalimentaria y Pesquera) -SAGARPA/SIAP
The New/Post apple production estimate for MY 2016/17 is revised downward from previous estimates to 716,930 MT as Chihuahua and Durango had smaller crops than expected. The national average yield for MY 2016/17 is estimated at 13.2 MT/Ha. The New/Post apple production data for MY 2015/16 remains unchanged from previous estimates. There is no official information on non-commercial apple production.
Consumption
New/Post domestic consumption for MY 2017/18 is forecast to be lower compared to MY 2016/17 consumption due to an expected lower consumer purchasing power. This will, however, depend on international prices and the depreciation of the peso against the dollar that will increase prices for imported fruit. In fact, the wholesale markets are expecting more expensive fruit from the international and domestic markets. Retailers are also observing that consumers buy somewhat less quantity of fruit due to prices. New/Post apple consumption estimates for MY 2016/17 were revised upward from previous estimates due to stronger demand than expected. New/Post apple consumption estimates for MY 2015/16 were revised marginally upward from previous estimates.
MX7051 More Deciduous Fruit Being Produced Page 4
Gala variety. According to industry, consumption of apples is driven by the retail sector which represents 54 percent of domestic consumption. There is no official information on apple per capita consumption. Apple varieties like Honey Crisp, Jonagold, and Crisp Pink are being imported at much smaller quantities, based on consumer preferences. While Mexican consumers like the size and color of U.S. apples, Mexican apples are considered sweeter. The U.S. apple industry will continue to face limited competition in Mexico from other countries such as Chile, Canada and South Africa.
Apples for processing are destined mostly to the juice processing plants. Apples are sold at very cheap prices. Producers tend to sell all they can to the fresh market first. There is no official information as to the amount of apples destined to the industry. Growers indicate that about 13 or 14 percent of the crop is for processing.
Trade
New/Post estimates for apple imports for MY 2017/18 are forecast to be lower compared to MY 2016/17 imports due to the depreciation of the peso against the dollar and international fruit prices. However, importers indicate that they are confident that consumers will still buy the fruit. Some importers though will buy fruit in smaller quantities at a time due to the swings in exchange rates. New/Post apple imports for MY 2016/17 were revised upward from previous estimates due to better demand than expected for apples, despite fruit prices. New/Post apple imports for MY 2015/16 were revised slightly upwards from previous estimates based on Global Trade Atlas (GTA) trade data.
More than 65 percent of apples are imported into Mexico during the months of January/July. Traders indicate that they expect demand will continue in this period as end consumers are used to having apples year round. More than 95 percent of Mexico’s appleimports originate from the United States’ west coast, and it is expected that this trend will continue. Washington-origin apples account for 85 percent of U.S. exports to Mexico, with the state of California supplying the remainder. Canadian apples are imported from November to January and Chilean apples are typically imported from March to June. Mexican apples are marketed from September through December. But due to the cold storage facilities, now Mexican apples are present throughout the year
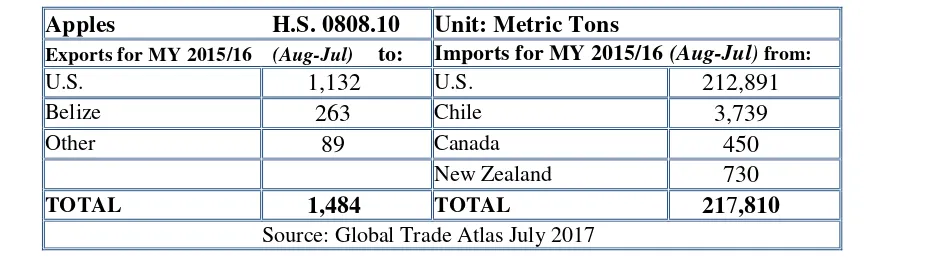
Mexican apple exports are almost residual, and the United States and Belize have been the main
importers for the last two years. Mexico exported 459 MT of apples to the United States and 432 MT to Belize for MY 2016/17. These apples come from a limited number of counties in the state of Chihuahua that are recognized as fruit fly free zone by USDA Animal and Plant Health Inspection Service.
MX7051 More Deciduous Fruit Being Produced Page 5
The Mexican government has established several agricultural protocols and agreements with the Chinese government and only initial test shipments have begun. Among the products to be imported from China are fruits and vegetables, including apples. The domestic industry does not anticipate significant competition. For information on the Work Plans between the United States and Mexico on apples see http://publico.senasica.gob.mx/?doc=27822
Tariffs
Under NAFTA, tariffs on U.S. and Canadian apples were eliminated on January 1, 2003. Under the Chile-Mexico Free Trade Agreement, imported Chilean apples began to enter duty free as of January 1, 2006. Apples from other countries are subject to a 20 percent duty. Apple HS code is 080810.
Prices
The cost of production for MY 2017/18 is estimated between US$0.24/kg and $0.37/kg. Production costs will tend towards the higher end of the estimate if growers have frost protection equipment and new irrigation systems. According to producers, electricity, fuel, and packing costs (the last of which depend on foreign inputs like imported boxes and wax cartons), continue to rise compared to previous years. Part of the current crop that has been harvested in Chihuahua is now in cold storage in order to manage prices.
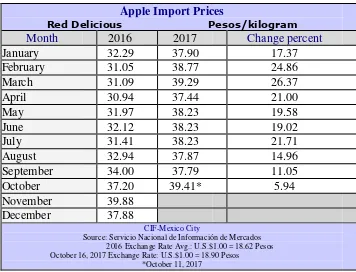
According to the National Service of Market Information (SNIIM), wholesale domestic prices during MY 2016/17 were higher compared to prices in 2015/16. Growers are expecting that prices will also increase for MY 2017/18. Wholesale domestic Golden Delicious apple prices were on average U.S. $1.84/kg (MX$33.16/kg) in October 2017, while prices for apples in October 2016 were about U.S. $1.44/kg (MX$27.37/kg). Wholesale domestic Red Delicious apple prices were about U.S. $1.60/kg (MX$28.95/kg) in October 2017, while in October 2016 they were U.S. $1.58/kg (MX$29.88/kg). It is important to consider that the Mexican peso value against the dollar was on average $16.58 pesos per dollar in October 2015; $18.91 pesos per dollar in October 2016, and $18.48 pesos per dollar in October 2017 with trends of more depreciation for the Mexican currency.
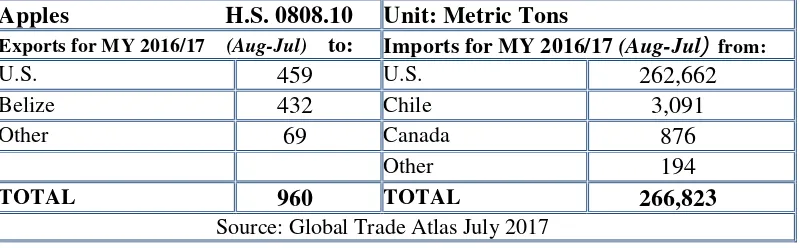
MX7051 More Deciduous Fruit Being Produced Page 6 Apple Import Prices
Red Delicious Pesos/kilogram
Month 2016 2017 Change percent
January 32.29 37.90 17.37
February 31.05 38.77 24.86
March 31.09 39.29 26.37
April 30.94 37.44 21.00
May 31.97 38.23 19.58
June 32.12 38.23 19.02
July 31.41 38.23 21.71
August 32.94 37.87 14.96
September 34.00 37.79 11.05
October 37.20 39.41* 5.94
November 39.88
December 37.88
CIF-Mexico City
Source: Servicio Nacional de Información de Mercados 2016 Exchange Rate Avg.: U.S.$1.00 = 18.62 Pesos
October 16, 2017 Exchange Rate: U.S.$1.00 = 18.90 Pesos *October 11, 2017
Table 4: Mexico –Average Monthly Wholesale Apple Domestic Prices
Red Delicious Pesos/kilogram
Month 2016 2017 Change percent
January 21.21 27.89 31.49
February 22.42 27.57 22.97
March 24.28 27.68 14.00
April 26.94 27.36 1.55
May 26.94
June 26.73
July 26.35
MX7051 More Deciduous Fruit Being Produced Page 7
Source: Servicio Nacional de Información de Mercados 2016 Exchange Rate Avg.: U.S.$1.00 = 18.62 Pesos October 16, 2017 Exchange Rate: U.S.$1.00 = 18.90 Pesos
*October 11, 2017
Table 5. Mexico -Average Monthly Wholesale Apple Import Prices
Source: Servicio Nacional de Información de Mercados 2016 Exchange Rate Avg.: U.S.$1.00 = 18.62 Pesos October 16, 2017 Exchange Rate: U.S.$1.00 = 18.90 Pesos *October 11, 2017
MX7051 More Deciduous Fruit Being Produced Page 8
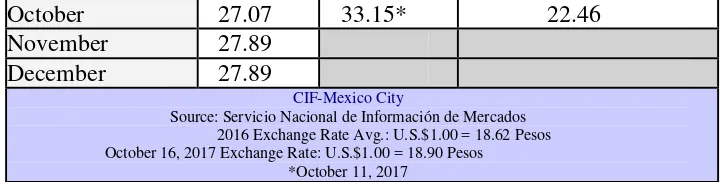
October 27.07 33.15* 22.46
November 27.89
December 27.89
CIF-Mexico City
Source: Servicio Nacional de Información de Mercados 2016 Exchange Rate Avg.: U.S.$1.00 = 18.62 Pesos
October 16, 2017 Exchange Rate: U.S.$1.00 = 18.90 Pesos
Apples, Fresh 2015/2016 2016/2017 2017/2018
Market Begin Year Aug 2015 Aug 2016 Aug 2017 Mexico USDA Official New Post USDA Official New Post USDA Official New Post
Area Planted 59811 59811 59500 58528 0 57770
Area Harvested 55120 55120 55100 54248 0 54000
Bearing Trees 12622 12622 12618 12422 0 12366
Non-Bearing Trees 1000 1074 1000 980 0 863
Total Trees 13622 13696 13618 13402 0 13229
Commercial Production 748324 748324 728000 714930 0 718000
Non-Comm. Production 2000 2000 2000 2000 0 2000
Production 750324 750324 730000 716930 0 720000
Imports 217800 217810 250000 266823 0 250000
Total Supply 968124 968134 980000 983753 0 970000
Fresh Dom. Consumption 869624 869650 883000 889793 0 876000
Exports 1500 1484 1000 960 0 1000
For Processing 97000 97000 96000 93000 0 93000
Withdrawal From Market 0 0 0 0 0 0
Total Distribution 968124 968134 980000 983753 0 970000
Area planted has fluctuated from 4,000 to 4,500 hectares in the last few years. Producers are not
investing in more production and have been producing more or less the same volumes in the same area. Some growers, however, have started to experiment with planting more disease-resistant and longer shelf-life varieties. New/Post area planted for MY 2017/18 is forecast to be at about 4,250 hectares based on official data which is a decrease compared to MY 2016/17, but still into the fluctuation mentioned above. The state of Puebla seems to have a decrease of about 3 percent in area planted due to higher costs of production. New/Post Planted area for MY 2016/17 is revised downward from previous estimates and area harvested is revised upward, according to official data from SAGARPA. Planted area for MY 2015/16 is revised marginally downwards from previous estimates, while area harvested is revised marginally upwards based on official data.
MX7051 More Deciduous Fruit Being Produced Page 9 Mexico’s New/Post pear production forecast for MY 2017/18 (July/June) is 26,800 MT, based on trends
and expected good weather conditions. Pear production is not expected to show significant increases in the near future, as growers are not heavily investing in this crop due to the high cost of production. New/Post pear production for MY 2016/17 is revised slightly upward from previous estimates based on official data. Pear yields for MY 2016/17 increased to 6.4 MT/Ha from the 5.9 MT/Ha that prevailed in MY 2015/16. New/ Post pear production for MY 2015/16 remains unchanged from previous estimates.
Approximately 86 percent of the pear planted area is rain-fed. Michoacán, Puebla, and Morelos are
Mexico’s major pear producing states and account for almost 80 percent of total Mexican production. Morelos starts harvesting in June, Michoacan starts harvesting during June/July, while Puebla begins in August/September. Lack of investment, high costs of production, scarce water supplies in pear
producing regions, and disease problems have limited domestic production growth. Due to limited scales of production, Mexican pears are sold almost exclusively through local markets, with few sold in supermarkets. The most popular Mexican pear varieties among Mexican consumers are the Kiefer variety and the Paraiso variety. There is no official information on non-commercial pear production.
Consumption
Domestic demand is satisfied mainly by imports from the United States, which represent about 70 to 75 percent of total supply. New/Post pear consumption for MY 2017/18 is expected to increase compared to MY 2016/17, due to expected affordable prices. However, a lower consumer purchasing power could negatively influence pear consumption.
New/Post pear consumption for MY 2016/17 is revised upward from previous estimates due to slightly higher international demand and domestic production. However consumption was 8 percent lower compared to MY 2015/16, attributable to variations in the peso exchange rate against the dollar and higher consumer prices. New/Post pear consumption for MY 2015/16 is revised marginally upward over previous estimates due to good demand and good pear prices for consumers.
Pears are available to consumers year round, mainly from Oregon and Washington states. Anjou pears continue to be the most sought-after variety in the market followed by Bosc, Bartlett, and Red Anjou varieties. Traders indicated that per capita pear consumption was about 2 pounds. There is no official information as to the amount of pears destined to the industry. Growers indicate that about 16 to 17 percent of the crop is destined to processing.
Trade
Due to the depreciation of the peso against the dollar and uncertainties this originates in the market, importers are cautious and import by smaller batches. Pear imports for MY 2017/18 are forecast to increase due to an expected good demand; however, this will depend on the availability of product as the U.S. crop is expected to be smaller compared to the previous year. It seems the Anjou variety will have more volume than other varieties. According to traders, August and September 2017 pears prices were better compared to 2016 and about 15 percent lower compared to 2016 prices. Sizes for imported pears in MY 2017/18 are expected to be medium and of good quality which could help for the
marketing of the fruit.
MX7051 More Deciduous Fruit Being Produced Page 10
2016/17 were generally very high and demand was lower than expected. New/Post pear import estimates for MY 2015/16 are revised marginally upward from previous estimates still representing a good international demand, as prices were still good, not as affected by swings in the exchange rate.
U.S. Anjou pear import season is from September to July, although cold storage facilities in Mexico and the United States provide year-round availability. U.S. Bartlett pear import season is from August through February, again with cold storage facilitating year-round availability. The United States is by far the largest and most important supplier of pears in Mexico, with a market share of 95 percent,
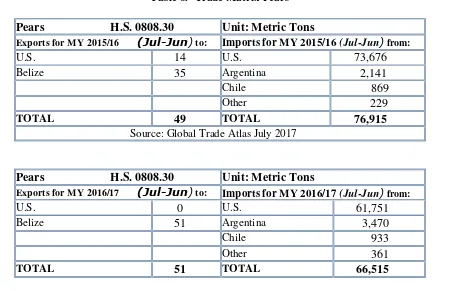
followed by Argentina with 3-5 percent, Chile with 1 percent and China with the remaining 0.5 percent. The presence of Chilean and Argentinean pears is limited in the Mexican market. When available in Mexico, they are of fair to good quality and are usually priced lower than U.S. pears. Mexican pear exports are residual and Belize has been the principal importer for the last few years. The export forecast for pears for MY 2017/18 is 50 MT. Belize imported 35 MT during MY 2015/16 and 51 MT during MY 2016/17. Only pears from the states of Oregon, Washington and California from areas that are not under quarantine are allowed. China has been exporting pears to the Mexican market recently, but volumes are still small.
Table 8.- Trade Matrix Pears
Pears H.S. 0808.30 Unit: Metric Tons
Exports for MY 2015/16 (Jul-Jun) to: Imports for MY 2015/16 (Jul-Jun) from:
U.S. 14 U.S. 73,676
Belize 35 Argentina 2,141
Chile 869
Other 229
TOTAL 49 TOTAL 76,915
Source: Global Trade Atlas July 2017
Pears H.S. 0808.30 Unit: Metric Tons
Exports for MY 2016/17 (Jul-Jun) to: Imports for MY 2016/17 (Jul-Jun) from:
U.S. 0 U.S. 61,751
Belize 51 Argentina 3,470
Chile 933
Other 361
TOTAL 51 TOTAL 66,515
MX7051 More Deciduous Fruit Being Produced Page 11 Tariffs
Under various trade agreements, the import duty on pears from the United States, Chile, and Argentina is zero. All other countries is 20 percent. The pear HS code is 080830.
Prices
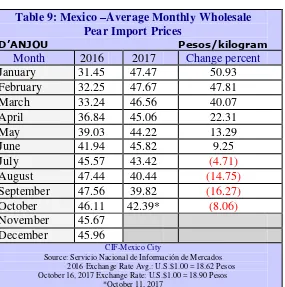
Although demand is expected to be good for pears, MY 2017/18 imported pear prices are expected to be better compared to the previous year, however, the peso/dollar exchange rate is expected to influence prices.
Table 9: Mexico –Average Monthly Wholesale Pear Import Prices
D’ANJOU Pesos/kilogram
Month 2016 2017 Change percent
January 31.45 47.47 50.93
February 32.25 47.67 47.81
March 33.24 46.56 40.07
April 36.84 45.06 22.31
May 39.03 44.22 13.29
June 41.94 45.82 9.25
July 45.57 43.42 (4.71)
August 47.44 40.44 (14.75)
September 47.56 39.82 (16.27)
October 46.11 42.39* (8.06)
November 45.67
December 45.96
CIF-Mexico City
Source: Servicio Nacional de Información de Mercados 2016 Exchange Rate Avg.: U.S.$1.00 = 18.62 Pesos October 16, 2017 Exchange Rate: U.S.$1.00 = 18.90 Pesos
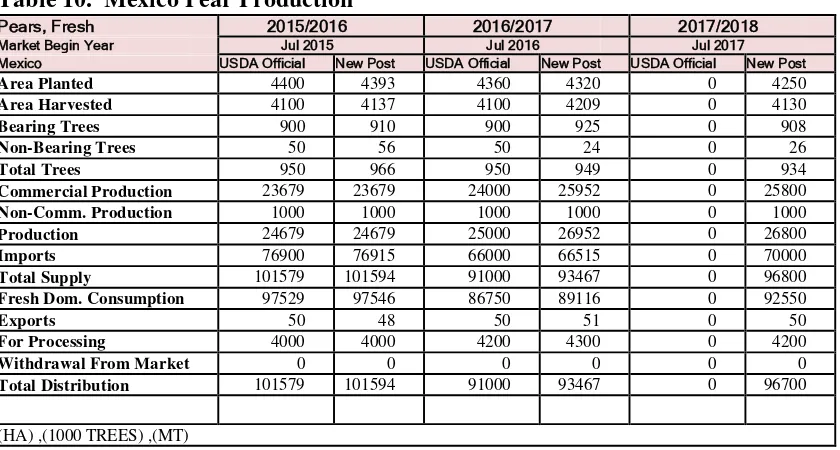
MX7051 More Deciduous Fruit Being Produced Page 12 Table 10. Mexico Pear Production
Pears, Fresh 2015/2016 2016/2017 2017/2018
Market Begin Year Jul 2015 Jul 2016 Jul 2017 Mexico USDA Official New Post USDA Official New Post USDA Official New Post
Area Planted 4400 4393 4360 4320 0 4250
Area Harvested 4100 4137 4100 4209 0 4130
Bearing Trees 900 910 900 925 0 908
Non-Bearing Trees 50 56 50 24 0 26
Total Trees 950 966 950 949 0 934
Commercial Production 23679 23679 24000 25952 0 25800
Non-Comm. Production 1000 1000 1000 1000 0 1000
Production 24679 24679 25000 26952 0 26800
Imports 76900 76915 66000 66515 0 70000
Total Supply 101579 101594 91000 93467 0 96800
Fresh Dom. Consumption 97529 97546 86750 89116 0 92550
Exports 50 48 50 51 0 50
For Processing 4000 4000 4200 4300 0 4200
Withdrawal From Market 0 0 0 0 0 0
Total Distribution 101579 101594 91000 93467 0 96700
The state of Sonora accounts for approximately 90 percent of total table grape production in Mexico and 86 percent of the total planted area. New/post area planted for MY 2017/18 is forecast to increase slightly to 20,000 Ha. Growth in planted area is limited in Sonora as production costs are high and water is scarce. Producers are getting rid of old areas and establishing new areas with new technology to increase yields. Sonora growers have increased technological innovations and higher density
planting, achieving higher yields compared to other growing regions. Producers indicate that expansion is limited mainly because of water scarcity in Sonora aquifers. As a result, producers are trying to increase yields and become more efficient rather than increase acreage. Market and growing conditions are favorable but water scarcity continues to limit aggressive expansion in Sonora as all table grape area is irrigated. The national average yield for MY 2016/17 was 14.10 MT/Ha, lower than the MY 2015/16 yields of 15.75 MT/Ha. Yields for MY 2017/18 are expected at about 15.5 MT/Ha.
MX7051 More Deciduous Fruit Being Produced Page 13
revised slightly downward from previous estimates and harvested area remains unchanged based on official estimates.
Production
New/Post total Mexican table grape production for MY 2017/18 (May/April) is forecast at 290,000 MT, an increase from MY 2016/17, due to expected better yields and good weather. According to producers, temperatures were ideal for grape growth and maturation. Harvesting begins in May and typically ends in July for the state of Sonora, the largest producer. Table grape production in Zacatecas, the second-largest producing state, is expected to be good. Harvest is usually between July and October. Baja California and other states harvest from June to August.
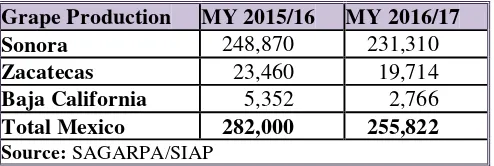
Table 11. Mexico: Table Grape Production for Selected States
Metric Tons
Grape Production MY 2015/16 MY 2016/17
Sonora 248,870 231,310
Zacatecas 23,460 19,714
Baja California 5,352 2,766
Total Mexico 282,000 255,822
Source: SAGARPA/SIAP
New/Post production estimate for MY 2016/17 is revised downward from previous estimates and MY 2014/15 production remains unchanged based on official estimates. Some of the main grape varieties that Mexico produces include Perlette, Flame, Sugraone, and Red Globe. There is no official
information on non-commercial table grapes production.
Consumption
MX7051 More Deciduous Fruit Being Produced Page 14
Trade
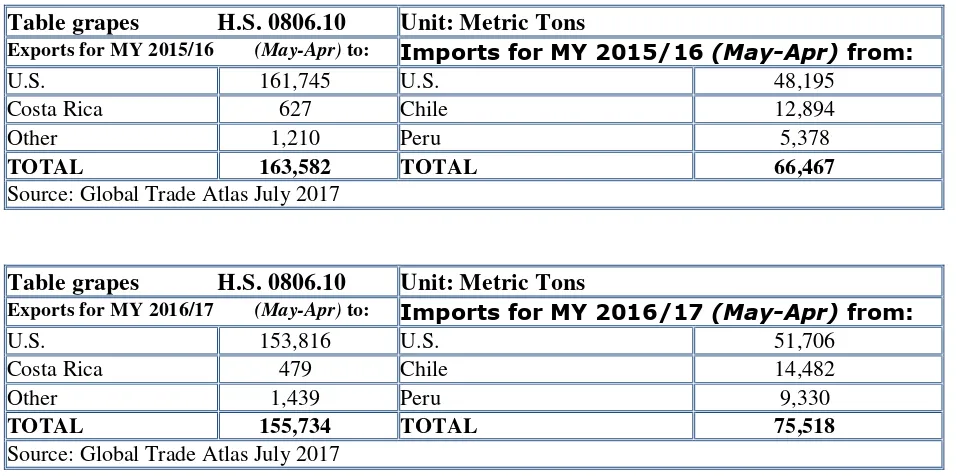
According to traders, New/Post table grape imports for MY 2017/18 are forecast to be similar or slightly lower compared to MY 2016/17. According to traders imports began slowly (Sep/Oct 2017) because domestic product was available at good prices. Although demand is expected to be good, high prices on imported product are expected to affect demand. Table grape imports for MY 2016/17 increased from previous estimates due to a good demand. New/Post grape imports for MY 2015/16 are revised marginally downwards from previous estimates based on GTA trade data.
While Chilean grape production is primarily counter-seasonal to U.S. production, some Chilean grapes
are also available during California’s early and late season, when they compete directly in the Mexican
market. U.S. suppliers export to Mexico from August to December and from January to February— before and after the Mexican season. Chile usually exports from January to April. The United States remains the leading supplier of fresh grapes to Mexico, with approximately 68 percent of total imports for MY 2016/17. Chilean grapes represented about 19 percent of total imports for MY 2016/17, same as in the previous year. In three years Peruvian grapes have gone from 0 to 10 percent market share of grape imports into Mexico.
Mexican table grape exports for MY 2017/18 are forecast to be higher compared to MY 2016/17 reflecting a strong international demand at good prices. New/Post exports for MY 2016/17 are revised slightly upward, while MY 2015/16 exports are revised marginally downwards from previous
MX7051 More Deciduous Fruit Being Produced Page 15
U.S. table grapes may only be imported into Mexico from California due to phytosanitary restrictions that prohibit imports from other U.S. states. Grapes must come from nonregulated areas in California
Tariffs
Under their respective trade agreements, the import duty on grapes from the United States, Chile, Japan and Peru is zero, and are expected to continue exporting to the Mexican market. Table grapes HS code is 080610.
The Mexico–European Union (EU) Trade Agreement, signed in 2000, allows Mexican table grapes to be imported into the EU duty free, beginning in 2008. Mexico has not taken full advantage of this agreement since most of its grapes are being exported to the United States—said to be a more profitable market.
Prices
Although demand is expected to be good for table grapes, prices are expected to be higher compared to MY 2016/17 prices. Similar to other imported fruit, importers are being very cautious when importing, as the continuing depreciation of the peso against the dollar does not allow them to import in large quantities at a time and have to import in smaller quantities, slowing down the market.
Most of Mexico’s table grapes are exported to the United States. Growers indicated that free on board (FOB) export prices early in May 2017 began at about U.S. $46 to $58 per 8-kg box of Perlettes compared to U.S. $45 to $48 per 8-kg box of Perlettes in May 2016, and then continued high at about U.S. $46 to $48 at the end of June 2017. Flame seedless grapes began in May 2015 at a high of U.S. $32 to $40 per 8-kg box and then fell to an average of U.S. $27 to $20 per 8-kg box in mid-June 2017. These prices are higher than the traditional Mexican export prices of between U.S. $14 and U.S. $16 per box.
MX7051 More Deciduous Fruit Being Produced Page 16 CIF-Mexico City
Source: Servicio Nacional de Información de Mercados 2016 Exchange Rate Avg.: U.S.$1.00 = 18.62 Pesos October 16, 2017 Exchange Rate: U.S.$1.00 = 18.90 Pesos
*October 11, 2017
Table 14. Mexico Table Grape Production
Grapes, Fresh 2015/2016 2016/2017 2017/2018
Market Begin Year May 2015 May 2016 May 2017 Mexico USDA Official New Post USDA Official New Post USDA Official New Post
Area Planted 19200 19171 19200 19467 0 20000
Area Harvested 17900 17900 18000 18139 0 18600
Commercial Production 281000 281000 279000 254821 0 289000
Non-Comm. Production 1000 1000 1000 1000 0 1000
Production 282000 282000 280000 255821 0 290000
Imports 66500 66467 75000 75518 0 75000
Total Supply 348500 348467 355000 331339 0 365000
Fresh Dom. Consumption 184900 184885 200000 175605 0 172000
Exports 163600 163582 155000 155734 0 193000
Withdrawal From Market 0 0 0 0 0 0
Total Distribution 348500 348467 355000 331339 0 365000
(HA) ,(MT)
Table 15. Mexico: Monthly Exchange Rate Averages for 2013-2016
MX Pesos per U.S. $1.00
2014 2015 2016 2017
January 13.20 14.68 18.02 21.37
February 13.28 14.92 18.47 20.33
March 13.22 15.21 17.69 19.35
April 13.29 15.22 17.49 18.77
May 12.93 15.26 18.09 18.76
June 12.99 15.46 18.12 18.16
July 12.97 15.92 18.58 17.83
August 13.14 16.50 18.47 17.80
September 13.21 16.85 19.16 17.81
October 13.47 16.58 18.91 18.48*
MX7051 More Deciduous Fruit Being Produced Page 17
December 14.44 17.03 20.51
Annual Avg 13.29 15.85 18.62
*As of October 16, 2017 Source: Mexican Federal Register
Note: Monthly rates are averages of daily exchange rates from the Banco de Mexico