KUESIONER PENELITIAN
DETERMINAN KINERJA KADER POSYANDU DALAM MENUJU REVITALISASI POSYANDU DI KECAMATAN PANTAI LABU KABUPATEN DELI SERDANG
TAHUN 2009
No responden :... I. KARAKTERISTIK INDIVIDU KADER POSYANDU
1) Umur Responden : ... Tahun (Sebutkan) 2) Pendidikan Terakhir a. Tamat SD b. Tamat SLTP c. Tamat SLTA d. Tamat D-3/S-1 3) Pekerjaan Kader
a. Ibu Rumah Tangga b. PNS
c. Wiraswasta
II. MOTIVASI KADER (INSENTIF/JASA dan TANGGUNG JAWAB)
Jawaban
No Pernyataan
TP CP SP A. Insentif (Jasa)
01 Insentif diterima setiap 3-6 bulan sekali 02 Insentif hanya dalam bentuk transportasi saja
03 Insentif/jasa yang diterima disesuaikan dengan tingkat pendidikan 04 Insentif yang diterima disesuaikan dengan beban kerja
05 Mendapatkan dana yang bersumber dari dana JAMKESMAS 06 Mendapatkan tambahan insentif dari iuran masyarakat 07 Kader menerima JPKMS
Tabel Pertanyaan motivasi lanjutan
Jawaban
No Pernyataan
S K TP
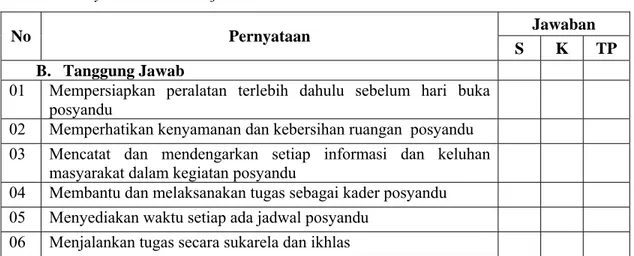
B. Tanggung Jawab
01 Mempersiapkan peralatan terlebih dahulu sebelum hari buka posyandu
02 Memperhatikan kenyamanan dan kebersihan ruangan posyandu 03 Mencatat dan mendengarkan setiap informasi dan keluhan
masyarakat dalam kegiatan posyandu
04 Membantu dan melaksanakan tugas sebagai kader posyandu 05 Menyediakan waktu setiap ada jadwal posyandu
06 Menjalankan tugas secara sukarela dan ikhlas
Keterangan : S=Sering; K=Kadang-kadang, dan TP=Tidak Pernah
VARIABEL KINERJA Sebelum hari ”H”Posyandu Apakah Ibu melaksanakan beberapa kegiatan?
1. Menyiapkan tempat pelaksanaan, peralatan, sarana dan prasarana, PMT sebelum posyandu dimulai.
2. Memberitahukan warga adanya kegiatan di posyandu?
3. Mendata jumlah sasaran Ibu hamil, WUS, PUS, Ibu menyusui, Ibu balita, dan sasaran UPGK yang ada diwilayah posyandu binaan Ibu? 1. Ya (1) 2. Tidak (2) 1. Ya (1) 2. Tidak (2) 1. Ya (1) 2. Tidak (2) Sebelum hari ”H”Posyandu Apakah ibu?
4. Melaksanakan pendaftaran pengunjung Posyandu balita dan ibu hamil.
5. Melakukan penimbangan balita dan Ibu hamil yang berkunjung ke posyandu?
6. Melakukan penimbangan balita dan Ibu hamil yang berkunjung ke posyandu?
7. melakukan kegiatan penyuluhan kesehatan dan gizi serta pemberian PMT bila menemukan balita Bbnya BGM ?
8. Membantu memberikan pelayanan kesehatan : KB, imunisasi, Fe, Oralit dan obat-obatan lainnya bersama petugas kesehatan di Posyandu kepada pengunjung Posyandu
1. Ya (1) 2. Tidak (2) 1. Ya (1) 2. Tidak (2) 1. Ya (1) 2. Tidak (2) 1. Ya (1) 2. Tidak (2) 1. Ya (1) 2. Tidak (2)
9. Mencatat di secarik kertas yang diselipkan kedalam KMS/ buku KIA setelah menimbang balita dan Ibu hamil kemudian baru mencatat hasilnya di KMS/ buku KIA dan mengisi buku register ?
10. Memberikan PMT dan penyuluhan kesehatan bila menemukan balita KEP?
11. Melakukan konsultasi kepada petugas kesehatan bila menemukan balita sudah 3 (tiga) kali berturut-turut BBnya tidak naik ?
1. Ya (1) 2. Tidak (2) 1. Ya (1) 2. Tidak (2) 1. Ya (1) 2. Tidak (2) Setelah hari ”H”Posyandu Apakah ibu?
12. Merapikan tempat posyandu, melengkapi pencatatan dan evaluasi kegiatan
13. Membuat grafik SKDN jumlah semua balita yang ada di wilayah binaan posyandu. S : Jumlah balita yang mempunyai KMS/ buku KIA.
14. Melakukan tindak lanjut dan kunjungan rumah kepada sasaran yang tidak datang ke posyandu? 15. Melakukan tatap muka ke tokoh masyarakat
setempat dan menghadiri pertemuan rutin organisasi keagamaan dalam masyarakat seperti pengajian, wirit, arisan dan lain-lain.
1. Ya (1) 2. Tidak (2) 1. Ya (1) 2. Tidak (2) 1. Ya (1) 2. Tidak (2) 1. Ya (1) 2. Tidak (2)
Lampiran 2
HASIL PENGOLAHAN DATA PENELITIAN
VALIDITAS DAN REABILITAS
VARIABEL INSENTIF
Reliability
****** Method 1 (space saver) will be used for this analysis ****** _
R E L I A B I L I T Y A N A L Y S I S - S C A L E (A L P H A)
Mean Std Dev Cases
1. INSENT1 2.5000 .7071 10.0 2. INSENT2 2.7000 .4830 10.0 3. INSENT3 2.5000 .7071 10.0 4. INSENT4 2.2000 .6325 10.0 5. INSENT5 2.4000 .6992 10.0 6. INSENT6 2.3000 .6749 10.0 7. INSENT7 2.3000 .6749 10.0 N of Statistics for Mean Variance Std Dev Variables
SCALE 16.9000 16.9889 4.1218 7
Item-total Statistics Scale Scale Corrected Mean Variance Item- Alpha if Item if Item Total if Item Deleted Deleted Correlation Deleted INSENT1 14.4000 11.8222 .9597 .9429 INSENT2 14.2000 13.9556 .7758 .9592 INSENT3 14.4000 11.8222 .9597 .9429 INSENT4 14.7000 12.9000 .8120 .9550 INSENT5 14.5000 12.0556 .9154 .9467 INSENT6 14.6000 12.4889 .8478 .9523 INSENT7 14.6000 12.9333 .7416 .9608 Reliability Coefficients N of Cases = 10.0 N of Items = 7 Alpha = .9584
VARIABEL TANGGUNG JAWAB
Reliability
****** Method 1 (space saver) will be used for this analysis ****** _
R E L I A B I L I T Y A N A L Y S I S - S C A L E (A L P H A)
Mean Std Dev Cases
1. TGGJWB1 2.3000 .6749 10.0 2. TGGJWB2 2.4000 .6992 10.0 3. TGGJWB3 2.2000 .6325 10.0 4. TGGJWB4 2.4000 .6992 10.0 5. TGGJWB5 2.3000 .6749 10.0 6. TGGJWB6 2.5000 .7071 10.0 N of Statistics for Mean Variance Std Dev Variables
SCALE 14.1000 12.9889 3.6040 6
Item-total Statistics Scale Scale Corrected Mean Variance Item- Alpha if Item if Item Total if Item Deleted Deleted Correlation Deleted TGGJWB1 11.8000 9.2889 .7886 .9360 TGGJWB2 11.7000 8.9000 .8629 .9270 TGGJWB3 11.9000 9.8778 .6820 .9477 TGGJWB4 11.7000 8.9000 .8629 .9270 TGGJWB5 11.8000 9.2889 .7886 .9360 TGGJWB6 11.6000 8.4889 .9708 .9130 Reliability Coefficients N of Cases = 10.0 N of Items = 6 Alpha = .9423
VARIABEL KINERJA KADER POSYANDU
Reliability
R E L I A B I L I T Y A N A L Y S I S - S C A L E (A L P H A)
Mean Std Dev Cases
1. KINERJA1 1.8000 .4216 10.0 2. KINERJA2 1.7000 .4830 10.0 3. KINERJA3 1.6000 .5164 10.0 4. KINERJA4 1.8000 .4216 10.0 5. KINERJA5 1.7000 .4830 10.0 6. KINERJA6 1.8000 .4216 10.0 7. KINERJA7 1.6000 .5164 10.0 8. KINERJA8 1.8000 .4216 10.0 9. KINERJA9 1.6000 .5164 10.0 10. KINERJ10 1.8000 .4216 10.0 11. KINERJ11 1.8000 .4216 10.0 12. KINERJ12 1.6000 .5164 10.0 13. KINERJ13 1.7000 .4830 10.0 14. KINERJ14 1.7000 .4830 10.0 15. KINERJ15 1.7000 .4830 10.0 N of Statistics for Mean Variance Std Dev Variables
SCALE 25.7000 34.2333 5.8509 15
Item-total Statistics Scale Scale Corrected Mean Variance Item- Alpha if Item if Item Total if Item Deleted Deleted Correlation Deleted KINERJA1 23.9000 29.6556 .9581 .9635 KINERJA2 24.0000 30.0000 .7559 .9668 KINERJA3 24.1000 30.1000 .6824 .9684 KINERJA4 23.9000 29.6556 .9581 .9635 KINERJA5 24.0000 29.5556 .8462 .9652 KINERJA6 23.9000 29.6556 .9581 .9635 KINERJA7 24.1000 30.1000 .6824 .9684 KINERJA8 23.9000 29.6556 .9581 .9635 KINERJA9 24.1000 30.5444 .6996 .9700 KINERJ10 23.9000 29.6556 .9580 .9635 KINERJ11 23.9000 29.6556 .7581 .9635 KINERJ12 24.1000 30.1000 .6824 .9684 KINERJ13 24.0000 30.0000 .7554 .9668 KINERJ14 24.0000 29.5556 .8472 .9652 KINERJ15 24.0000 30.4444 .6670 .9684 R E L I A B I L I T Y A N A L Y S I S - S C A L E (A L P H A) Reliability Coefficients N of Cases = 10.0 N of Items = 15 Alpha = .9681
Frequencies
UMUR 18 33.3 33.3 33.3 36 66.7 66.7 100.0 54 100.0 100.0 20-30 Tahun 31-40 Tahun Total Valid
Frequency Percent Valid Percent
Cumulative Percent DIDIKAN 18 33.3 33.3 33.3 17 31.5 31.5 64.8 19 35.2 35.2 100.0 54 100.0 100.0 Tamat SD Tamat SLTP Tamat SLTA Total Valid
Frequency Percent Valid Percent
Cumulative Percent DIDIK 36 66.7 66.7 66.7 18 33.3 33.3 100.0 54 100.0 100.0 Sedang Rendah Total Valid
Frequency Percent Valid Percent
Cumulative Percent JN_KERJA 32 59.3 59.3 59.3 8 14.8 14.8 74.1 5 9.3 9.3 83.3 9 16.7 16.7 100.0 54 100.0 100.0 IRT Wiraswasta/Pegawai Swasta PNS Petani/Buruh Total Valid
Frequency Percent Valid Percent
Cumulative Percent KERJA 24 44.4 44.4 44.4 30 55.6 55.6 100.0 54 100.0 100.0 Bekerja Tidak Bekerja Total Valid
Frequency Percent Valid Percent
Cumulative Percent
INSENTIF 8 14.8 14.8 14.8 19 35.2 35.2 50.0 27 50.0 50.0 100.0 54 100.0 100.0 Baik Sedang Kurang Total Valid
Frequency Percent Valid Percent
Cumulative Percent TGG_JWB 10 18.5 18.5 18.5 19 35.2 35.2 53.7 25 46.3 46.3 100.0 54 100.0 100.0 Rendah Sedang Tinggi Total Valid
Frequency Percent Valid Percent
Cumulative Percent
Motivasi Kader Posyandu
8 14.8 14.8 14.8 17 31.5 31.5 46.3 29 53.7 53.7 100.0 54 100.0 100.0 Tinggi Sedang Rendah Total Valid
Frequency Percent Valid Percent
Cumulative Percent
Kinerja Kader Posyandu
15 27.8 27.8 27.8 10 18.5 18.5 46.3 29 53.7 53.7 100.0 54 100.0 100.0 Baik Sedang Kurang Total Valid
Frequency Percent Valid Percent
Cumulative Percent
Crosstabs
Crosstab 7 1 10 18 5.0 3.3 9.7 18.0 38.9% 5.6% 55.6% 100.0% 46.7% 10.0% 34.5% 33.3% 13.0% 1.9% 18.5% 33.3% 8 9 19 36 10.0 6.7 19.3 36.0 22.2% 25.0% 52.8% 100.0% 53.3% 90.0% 65.5% 66.7% 14.8% 16.7% 35.2% 66.7% 15 10 29 54 15.0 10.0 29.0 54.0 27.8% 18.5% 53.7% 100.0% 100.0% 100.0% 100.0% 100.0% 27.8% 18.5% 53.7% 100.0% Count Expected Count % within UMUR % within Kinerja Kader Posyandu % of Total Count Expected Count % within UMUR % within Kinerja Kader Posyandu % of Total Count Expected Count % within UMUR % within Kinerja Kader Posyandu % of Total 20-30 Tahun 31-40 Tahun UMUR Total
Baik Sedang Kurang Kinerja Kader Posyandu
Total Chi-Square Tests 3.667a 2 .160 4.151 2 .125 .304 1 .581 54 Pearson Chi-Square Likelihood Ratio Linear-by-Linear Association N of Valid Cases Value df Asymp. Sig. (2-sided)
1 cells (16.7%) have expected count less than 5. The minimum expected count is 3.33.
a.
Crosstab 15 6 15 36 10.0 6.7 19.3 36.0 41.7% 16.7% 41.7% 100.0% 100.0% 60.0% 51.7% 66.7% 27.8% 11.1% 27.8% 66.7% 0 4 14 18 5.0 3.3 9.7 18.0 .0% 22.2% 77.8% 100.0% .0% 40.0% 48.3% 33.3% .0% 7.4% 25.9% 33.3% 15 10 29 54 15.0 10.0 29.0 54.0 27.8% 18.5% 53.7% 100.0% 100.0% 100.0% 100.0% 100.0% 27.8% 18.5% 53.7% 100.0% Count Expected Count % within DIDIK % within Kinerja Kader Posyandu % of Total Count Expected Count % within DIDIK % within Kinerja Kader Posyandu % of Total Count Expected Count % within DIDIK % within Kinerja Kader Posyandu % of Total Sedang Rendah DIDIK Total
Baik Sedang Kurang Kinerja Kader Posyandu
Total Chi-Square Tests 10.614a 2 .005 15.115 2 .001 9.530 1 .002 54 Pearson Chi-Square Likelihood Ratio Linear-by-Linear Association N of Valid Cases Value df Asymp. Sig. (2-sided)
1 cells (16.7%) have expected count less than 5. The minimum expected count is 3.33.
a.
Crosstab 10 3 11 24 6.7 4.4 12.9 24.0 41.7% 12.5% 45.8% 100.0% 66.7% 30.0% 37.9% 44.4% 18.5% 5.6% 20.4% 44.4% 5 7 18 30 8.3 5.6 16.1 30.0 16.7% 23.3% 60.0% 100.0% 33.3% 70.0% 62.1% 55.6% 9.3% 13.0% 33.3% 55.6% 15 10 29 54 15.0 10.0 29.0 54.0 27.8% 18.5% 53.7% 100.0% 100.0% 100.0% 100.0% 100.0% 27.8% 18.5% 53.7% 100.0% Count Expected Count % within KERJA % within Kinerja Kader Posyandu % of Total Count Expected Count % within KERJA % within Kinerja Kader Posyandu % of Total Count Expected Count % within KERJA % within Kinerja Kader Posyandu % of Total Bekerja Tidak Bekerja KERJA Total
Baik Sedang Kurang Kinerja Kader Posyandu
Total Chi-Square Tests 4.343a 2 .114 4.383 2 .112 2.685 1 .101 54 Pearson Chi-Square Likelihood Ratio Linear-by-Linear Association N of Valid Cases Value df Asymp. Sig. (2-sided)
1 cells (16.7%) have expected count less than 5. The minimum expected count is 4.44.
a.
Crosstab 5 2 1 8 2.2 1.5 4.3 8.0 62.5% 25.0% 12.5% 100.0% 33.3% 20.0% 3.4% 14.8% 9.3% 3.7% 1.9% 14.8% 7 2 8 17 4.7 3.1 9.1 17.0 41.2% 11.8% 47.1% 100.0% 46.7% 20.0% 27.6% 31.5% 13.0% 3.7% 14.8% 31.5% 3 6 20 29 8.1 5.4 15.6 29.0 10.3% 20.7% 69.0% 100.0% 20.0% 60.0% 69.0% 53.7% 5.6% 11.1% 37.0% 53.7% 15 10 29 54 15.0 10.0 29.0 54.0 27.8% 18.5% 53.7% 100.0% 100.0% 100.0% 100.0% 100.0% 27.8% 18.5% 53.7% 100.0% Count Expected Count % within Motivasi Kader Posyandu % within Kinerja Kader Posyandu % of Total Count Expected Count % within Motivasi Kader Posyandu % within Kinerja Kader Posyandu % of Total Count Expected Count % within Motivasi Kader Posyandu % within Kinerja Kader Posyandu % of Total Count Expected Count % within Motivasi Kader Posyandu % within Kinerja Kader Posyandu % of Total Tinggi Sedang Rendah Motivasi Kader Posyandu Total
Baik Sedang Kurang
Kinerja Kader Posyandu
Total Chi-Square Tests 12.344a 4 .015 13.386 4 .010 11.018 1 .001 54 Pearson Chi-Square Likelihood Ratio Linear-by-Linear Association N of Valid Cases Value df Asymp. Sig. (2-sided)
5 cells (55.6%) have expected count less than 5. The minimum expected count is 1.48.
a.
Variables Entered/Removedb Motivasi Kader Posyandu, KERJA, UMUR, DIDIKa . Enter Model 1 Variables Entered Variables Removed Method
All requested variables entered. a.
Dependent Variable: Kinerja Kader Posyandu b. Model Summary .578a .334 .279 .741 Model 1 R R Square Adjusted R Square Std. Error of the Estimate Predictors: (Constant), Motivasi Kader Posyandu, KERJA, UMUR, DIDIK
a. ANOVAb 13.470 4 3.367 6.134 .000a 26.901 49 .549 40.370 53 Regression Residual Total Model 1 Sum of
Squares df Mean Square F Sig.
Predictors: (Constant), Motivasi Kader Posyandu, KERJA, UMUR, DIDIK a.
Dependent Variable: Kinerja Kader Posyandu b. Coefficientsa -.534 .647 -.825 .413 .085 .222 .046 .383 .703 .495 .255 .270 1.941 .009 .211 .239 .121 .882 .382 .489 .146 .413 3.355 .002 (Constant) UMUR DIDIK KERJA
Motivasi Kader Posyandu Model 1 B Std. Error Unstandardized Coefficients Beta Standardized Coefficients t Sig.
Dependent Variable: Kinerja Kader Posyandu a.