Lampiran 1
Table Frekuensi Responden
gender Frequency Percent Valid Percent Cumulative Percent Valid LAKI-LAKI 14 16.5 16.5 16.5 PEREMPUAN 71 83.5 83.5 100.0 Total 85 100.0 100.0 umur
Frequency Percent Valid Percent
Cumulative Percent Valid 21 - 30 81 95.3 95.3 95.3 31 - 40 3 3.5 3.5 98.8 41 - 50 1 1.2 1.2 100.0 Total 85 100.0 100.0 pendidikan Frequency Percent Valid Percent Cumulative Percent Valid SMP 4 4.7 4.7 4.7 SMA 70 82.4 82.4 87.1 S-1 9 10.6 10.6 97.6 LAIN -LAIN 2 2.4 2.4 100.0 Total 85 100.0 100.0 pekerjaan Frequency Percent Valid Percent Cumulative Percent Valid PELAJAR / MAHASISWA 75 88.2 88.2 88.2 KARYAWAN 5 5.9 5.9 94.1 WIRASWASTA 1 1.2 1.2 95.3 IBU RUMAH TANGGA 4 4.7 4.7 100.0 Total 85 100.0 100.0
penghasilan
Frequency Percent Valid Percent
Cumulative Percent Valid <250000 14 16.5 16.7 16.7 250000 - 500000 20 23.5 23.8 40.5 500000 - 1000000 33 38.8 39.3 79.8 1000000 - 1500000 12 14.1 14.3 94.0 >1500000 5 5.9 6.0 100.0 Total 84 98.8 100.0 Missing System 1 1.2 Total 85 100.0
Lampiran 2
Tabel frekuensi jawaban responden
X11
Frequency Percent Valid Percent
Cumulative Percent Valid 1 1 1.2 1.2 1.2 2 6 7.1 7.1 8.2 3 10 11.8 11.8 20.0 4 60 70.6 70.6 90.6 5 8 9.4 9.4 100.0 Total 85 100.0 100.0 X12
Frequency Percent Valid Percent
Cumulative Percent Valid 2 6 7.1 7.1 7.1 3 18 21.2 21.2 28.2 4 56 65.9 65.9 94.1 5 5 5.9 5.9 100.0 Total 85 100.0 100.0 X13
Frequency Percent Valid Percent
Cumulative Percent Valid 1 1 1.2 1.2 1.2 2 6 7.1 7.1 8.2 3 25 29.4 29.4 37.6 4 48 56.5 56.5 94.1 5 5 5.9 5.9 100.0 Total 85 100.0 100.0 X21
Frequency Percent Valid Percent
Cumulative Percent Valid 1 1 1.2 1.2 1.2 2 9 10.6 10.6 11.8 3 8 9.4 9.4 21.2 4 52 61.2 61.2 82.4 5 15 17.6 17.6 100.0 Total 85 100.0 100.0
X22
Frequency Percent Valid Percent
Cumulative Percent Valid 1 3 3.5 3.5 3.5 2 8 9.4 9.4 12.9 3 19 22.4 22.4 35.3 4 44 51.8 51.8 87.1 5 11 12.9 12.9 100.0 Total 85 100.0 100.0 X23
Frequency Percent Valid Percent
Cumulative Percent Valid 1 5 5.9 5.9 5.9 2 14 16.5 16.5 22.4 3 12 14.1 14.1 36.5 4 43 50.6 50.6 87.1 5 11 12.9 12.9 100.0 Total 85 100.0 100.0 X24
Frequency Percent Valid Percent
Cumulative Percent Valid 1 1 1.2 1.2 1.2 2 9 10.6 10.6 11.8 3 17 20.0 20.0 31.8 4 50 58.8 58.8 90.6 5 8 9.4 9.4 100.0 Total 85 100.0 100.0 X25
Frequency Percent Valid Percent
Cumulative Percent Valid 1 1 1.2 1.2 1.2 2 8 9.4 9.4 10.6 3 29 34.1 34.1 44.7 4 42 49.4 49.4 94.1 5 5 5.9 5.9 100.0 Total 85 100.0 100.0
X31
Frequency Percent Valid Percent
Cumulative Percent Valid 1 12 14.1 14.1 14.1 2 29 34.1 34.1 48.2 3 29 34.1 34.1 82.4 4 14 16.5 16.5 98.8 5 1 1.2 1.2 100.0 Total 85 100.0 100.0 X32
Frequency Percent Valid Percent
Cumulative Percent Valid 1 16 18.8 18.8 18.8 2 35 41.2 41.2 60.0 3 22 25.9 25.9 85.9 4 11 12.9 12.9 98.8 5 1 1.2 1.2 100.0 Total 85 100.0 100.0 X41
Frequency Percent Valid Percent
Cumulative Percent Valid 2 1 1.2 1.2 1.2 3 28 32.9 32.9 34.1 4 35 41.2 41.2 75.3 5 21 24.7 24.7 100.0 Total 85 100.0 100.0 X42
Frequency Percent Valid Percent
Cumulative Percent Valid 2 2 2.4 2.4 2.4 3 29 34.1 34.1 36.5 4 49 57.6 57.6 94.1 5 5 5.9 5.9 100.0 Total 85 100.0 100.0
X43
Frequency Percent Valid Percent
Cumulative Percent Valid 2 6 7.1 7.1 7.1 3 27 31.8 31.8 38.8 4 48 56.5 56.5 95.3 5 4 4.7 4.7 100.0 Total 85 100.0 100.0 X51
Frequency Percent Valid Percent
Cumulative Percent Valid 1 3 3.5 3.5 3.5 2 11 12.9 12.9 16.5 3 5 5.9 5.9 22.4 4 52 61.2 61.2 83.5 5 14 16.5 16.5 100.0 Total 85 100.0 100.0 X52
Frequency Percent Valid Percent
Cumulative Percent Valid 1 1 1.2 1.2 1.2 2 7 8.2 8.2 9.4 3 13 15.3 15.3 24.7 4 48 56.5 56.5 81.2 5 16 18.8 18.8 100.0 Total 85 100.0 100.0 X53
Frequency Percent Valid Percent
Cumulative Percent Valid 1 7 8.2 8.2 8.2 2 19 22.4 22.4 30.6 3 7 8.2 8.2 38.8 4 36 42.4 42.4 81.2 5 16 18.8 18.8 100.0 Total 85 100.0 100.0
X54
Frequency Percent Valid Percent
Cumulative Percent Valid 1 1 1.2 1.2 1.2 2 13 15.3 15.3 16.5 3 15 17.6 17.6 34.1 4 45 52.9 52.9 87.1 5 11 12.9 12.9 100.0 Total 85 100.0 100.0
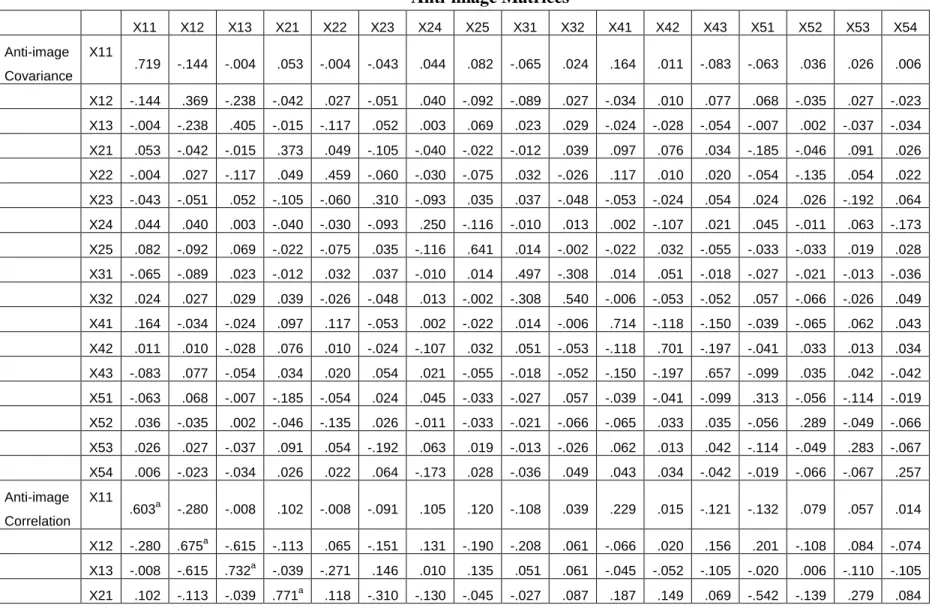
Lampiran 3
Tabel Anti Image
Anti-image Matrices
X11 X12 X13 X21 X22 X23 X24 X25 X31 X32 X41 X42 X43 X51 X52 X53 X54 Anti-image Covariance X11 .719 -.144 -.004 .053 -.004 -.043 .044 .082 -.065 .024 .164 .011 -.083 -.063 .036 .026 .006 X12 -.144 .369 -.238 -.042 .027 -.051 .040 -.092 -.089 .027 -.034 .010 .077 .068 -.035 .027 -.023 X13 -.004 -.238 .405 -.015 -.117 .052 .003 .069 .023 .029 -.024 -.028 -.054 -.007 .002 -.037 -.034 X21 .053 -.042 -.015 .373 .049 -.105 -.040 -.022 -.012 .039 .097 .076 .034 -.185 -.046 .091 .026 X22 -.004 .027 -.117 .049 .459 -.060 -.030 -.075 .032 -.026 .117 .010 .020 -.054 -.135 .054 .022 X23 -.043 -.051 .052 -.105 -.060 .310 -.093 .035 .037 -.048 -.053 -.024 .054 .024 .026 -.192 .064 X24 .044 .040 .003 -.040 -.030 -.093 .250 -.116 -.010 .013 .002 -.107 .021 .045 -.011 .063 -.173 X25 .082 -.092 .069 -.022 -.075 .035 -.116 .641 .014 -.002 -.022 .032 -.055 -.033 -.033 .019 .028 X31 -.065 -.089 .023 -.012 .032 .037 -.010 .014 .497 -.308 .014 .051 -.018 -.027 -.021 -.013 -.036 X32 .024 .027 .029 .039 -.026 -.048 .013 -.002 -.308 .540 -.006 -.053 -.052 .057 -.066 -.026 .049 X41 .164 -.034 -.024 .097 .117 -.053 .002 -.022 .014 -.006 .714 -.118 -.150 -.039 -.065 .062 .043 X42 .011 .010 -.028 .076 .010 -.024 -.107 .032 .051 -.053 -.118 .701 -.197 -.041 .033 .013 .034 X43 -.083 .077 -.054 .034 .020 .054 .021 -.055 -.018 -.052 -.150 -.197 .657 -.099 .035 .042 -.042 X51 -.063 .068 -.007 -.185 -.054 .024 .045 -.033 -.027 .057 -.039 -.041 -.099 .313 -.056 -.114 -.019 X52 .036 -.035 .002 -.046 -.135 .026 -.011 -.033 -.021 -.066 -.065 .033 .035 -.056 .289 -.049 -.066 X53 .026 .027 -.037 .091 .054 -.192 .063 .019 -.013 -.026 .062 .013 .042 -.114 -.049 .283 -.067 X54 .006 -.023 -.034 .026 .022 .064 -.173 .028 -.036 .049 .043 .034 -.042 -.019 -.066 -.067 .257 Anti-image Correlation X11 .603a -.280 -.008 .102 -.008 -.091 .105 .120 -.108 .039 .229 .015 -.121 -.132 .079 .057 .014 X12 -.280 .675a -.615 -.113 .065 -.151 .131 -.190 -.208 .061 -.066 .020 .156 .201 -.108 .084 -.074 X13 -.008 -.615 .732a -.039 -.271 .146 .010 .135 .051 .061 -.045 -.052 -.105 -.020 .006 -.110 -.105 X21 .102 -.113 -.039 .771a .118 -.310 -.130 -.045 -.027 .087 .187 .149 .069 -.542 -.139 .279 .084X22 -.008 .065 -.271 .118 .848a -.160 -.089 -.139 .067 -.052 .205 .017 .036 -.143 -.371 .149 .063 X23 -.091 -.151 .146 -.310 -.160 .710a -.334 .079 .095 -.117 -.113 -.051 .119 .077 .087 -.647 .226 X24 .105 .131 .010 -.130 -.089 -.334 .700a -.289 -.029 .035 .004 -.254 .051 .160 -.042 .236 -.682 X25 .120 -.190 .135 -.045 -.139 .079 -.289 .836a .025 -.003 -.033 .048 -.084 -.075 -.076 .044 .068 X31 -.108 -.208 .051 -.027 .067 .095 -.029 .025 .699a -.594 .024 .087 -.032 -.068 -.055 -.034 -.101 X32 .039 .061 .061 .087 -.052 -.117 .035 -.003 -.594 .528a -.010 -.087 -.087 .138 -.167 -.067 .131 X41 .229 -.066 -.045 .187 .205 -.113 .004 -.033 .024 -.010 .654a -.166 -.219 -.083 -.143 .139 .101 X42 .015 .020 -.052 .149 .017 -.051 -.254 .048 .087 -.087 -.166 .615a -.290 -.089 .074 .028 .079 X43 -.121 .156 -.105 .069 .036 .119 .051 -.084 -.032 -.087 -.219 -.290 .611a -.218 .079 .097 -.103 X51 -.132 .201 -.020 -.542 -.143 .077 .160 -.075 -.068 .138 -.083 -.089 -.218 .757a -.185 -.383 -.066 X52 .079 -.108 .006 -.139 -.371 .087 -.042 -.076 -.055 -.167 -.143 .074 .079 -.185 .890a -.173 -.242 X53 .057 .084 -.110 .279 .149 -.647 .236 .044 -.034 -.067 .139 .028 .097 -.383 -.173 .705a -.247 X54 .014 -.074 -.105 .084 .063 .226 -.682 .068 -.101 .131 .101 .079 -.103 -.066 -.242 -.247 .766a
Lampiran 4
Tabel statistic deskriptif variable penelitian
Descriptive Statistics
N Minimum Maximum Mean Std. Deviation
X11 85 1.00 5.00 3.8000 .75277 X12 85 2.00 5.00 3.7059 .68701 X13 85 1.00 5.00 3.5882 .76055 X21 85 1.00 5.00 3.8353 .88435 X22 85 1.00 5.00 3.6118 .95237 X23 85 1.00 5.00 3.4824 1.09774 X24 85 1.00 5.00 3.6471 .84100 X25 85 1.00 5.00 3.4941 .79617 X31 85 1.00 5.00 2.5647 .96913 X32 85 1.00 5.00 2.3647 .97403 X41 85 2.00 5.00 3.8941 .78715 X42 85 2.00 5.00 3.6706 .62466 X43 85 2.00 5.00 3.5882 .69512 X51 85 1.00 5.00 3.7412 1.00182 X52 85 1.00 5.00 3.8353 .87078 X53 85 1.00 5.00 3.4118 1.25636 X54 85 1.00 5.00 3.6118 .93978 Valid N (listwise) 85
Lampiran 5
OUTPUT UJI VALIDITAS
(sample 30)
Correlations X1 X11 Pearson Correlation .708** Sig. (2-tailed) .000 N 30 X12 Pearson Correlation .864** Sig. (2-tailed) .000 N 30 X13 Pearson Correlation .801** Sig. (2-tailed) .000 N 30 X1 Pearson Correlation 1 Sig. (2-tailed) N 30*. Correlation is significant at the 0.05 level (2-tailed). **. Correlation is significant at the 0.01 level (2-tailed).
Correlations X3 X31 Pearson Correlation .940** Sig. (2-tailed) .000 N 30 X32 Pearson Correlation .918** Sig. (2-tailed) .000 N 30 X3 Pearson Correlation 1 Sig. (2-tailed) N 30
**. Correlation is significant at the 0.01 level (2-tailed).
Correlations X2 X21 Pearson Correlation .510** Sig. (2-tailed) .004 N 30 X22 Pearson Correlation .613** Sig. (2-tailed) .000 N 30 X23 Pearson Correlation .755** Sig. (2-tailed) .000 N 30 X24 Pearson Correlation .799** Sig. (2-tailed) .000 N 30 X25 Pearson Correlation .707** Sig. (2-tailed) .000 N 30 X2 Pearson Correlation 1 Sig. (2-tailed) N 30
**. Correlation is significant at the 0.01 level (2-tailed). *. Correlation is significant at the 0.05 level (2-tailed).
Correlations X4 X41 Pearson Correlation .646** Sig. (2-tailed) .000 N 30 X42 Pearson Correlation .804** Sig. (2-tailed) .000 N 30 X43 Pearson Correlation .806** Sig. (2-tailed) .000 N 30 X4 Pearson Correlation 1 Sig. (2-tailed) N 30
*. Correlation is significant at the 0.05 level (2-tailed). **. Correlation is significant at the 0.01 level (2-tailed).
Correlations X5 X51 Pearson Correlation .640** Sig. (2-tailed) .000 N 30 X52 Pearson Correlation .789** Sig. (2-tailed) .000 N 30 X53 Pearson Correlation .892** Sig. (2-tailed) .000 N 30 X54 Pearson Correlation .760** Sig. (2-tailed) .000 N 30 X5 Pearson Correlation 1 Sig. (2-tailed) N 30
**. Correlation is significant at the 0.01 level (2-tailed).
OUTPUT UJI VALIDITAS
( sample 85)
Correlations X1 X11 Pearson Correlation .676** Sig. (2-tailed) .000 N 85 X12 Pearson Correlation .859** Sig. (2-tailed) .000 N 85 X13 Pearson Correlation .821** Sig. (2-tailed) .000 N 85 X1 Pearson Correlation 1 Sig. (2-tailed) N 85**. Correlation is significant at the 0.01 level (2-tailed). *. Correlation is significant at the 0.05 level (2-tailed).
Correlations X2 X21 Pearson Correlation .741** Sig. (2-tailed) .000 N 85 X22 Pearson Correlation .743** Sig. (2-tailed) .000 N 85 X23 Pearson Correlation .739** Sig. (2-tailed) .000 N 85 X24 Pearson Correlation .750** Sig. (2-tailed) .000 N 85 X25 Pearson Correlation .629** Sig. (2-tailed) .000 N 85 X2 Pearson Correlation 1 Sig. (2-tailed) N 85
**. Correlation is significant at the 0.01 level (2-tailed).
Correlations X3 X31 Pearson Correlation .894** Sig. (2-tailed) .000 N 85 X32 Pearson Correlation .895** Sig. (2-tailed) .000 N 85 X3 Pearson Correlation 1 Sig. (2-tailed) N 85
**. Correlation is significant at the 0.01 level (2-tailed).
Correlations X4 X41 Pearson Correlation .767** Sig. (2-tailed) .000 N 85 X42 Pearson Correlation .725** Sig. (2-tailed) .000 N 85 X43 Pearson Correlation .760** Sig. (2-tailed) .000 N 85 X4 Pearson Correlation 1 Sig. (2-tailed) N 85
**. Correlation is significant at the 0.01 level (2-tailed).
Correlations X5 X51 Pearson Correlation .816** Sig. (2-tailed) .000 N 85 X52 Pearson Correlation .844** Sig. (2-tailed) .000 N 85 X53 Pearson Correlation .831** Sig. (2-tailed) .000 N 85 X54 Pearson Correlation .745** Sig. (2-tailed) .000 N 85 X5 Pearson Correlation 1 Sig. (2-tailed) N 85
Lampiran 6
OUTPUT UJI RELIABILITAS
(sample 30)
X1
Reliability Statistics Cronbach's Alpha N of Items .674 3X2
Reliability Statistics Cronbach's Alpha N of Items .695 5X3
Reliability Statistics Cronbach's Alpha N of Items .837 2X4
Reliability Statistics Cronbach's Alpha N of Items .613 3X5
Reliability Statistics Cronbach's Alpha N of Items .764 4OUTPUT UJI RELIABILITAS
(sample 85)
X1
Reliability Statistics Cronbach's Alpha N of Items .683 3X2
Reliability Statistics Cronbach's Alpha N of Items .765 5X3
Reliability Statistics Cronbach's Alpha N of Items .749 2X4
Reliability Statistics Cronbach's Alpha N of Items .608 3X5
Reliability Statistics Cronbach's Alpha N of Items .815 4Lampiran 7
Output KMO
KMO and Bartlett's Test
Kaiser-Meyer-Olkin Measure of Sampling Adequacy. .742 Bartlett's Test of Sphericity Approx. Chi-Square 654.232
df 136
Lampiran 8
OUTPUT COMMUNALITAS
Communalities Initial Extraction X11 1.000 .616 X12 1.000 .780 X13 1.000 .762 X21 1.000 .622 X22 1.000 .556 X23 1.000 .675 X24 1.000 .767 X25 1.000 .547 X31 1.000 .780 X32 1.000 .846 X41 1.000 .468 X42 1.000 .589 X43 1.000 .672 X51 1.000 .768 X52 1.000 .749 X53 1.000 .754 X54 1.000 .696 Extraction Method: Principal Component Analysis.Lampiran 9
Output total variance explained
Total Variance Explained
Compo nent
Initial Eigenvalues Extraction Sums of Squared Loadings Total % of Variance Cumulative % Total % of Variance Cumulative %
1 5.370 31.589 31.589 5.370 31.589 31.589 2 2.013 11.838 43.428 2.013 11.838 43.428 3 1.652 9.718 53.146 1.652 9.718 53.146 4 1.459 8.585 61.730 1.459 8.585 61.730 5 1.153 6.783 68.513 1.153 6.783 68.513 6 .859 5.055 73.568 7 .816 4.803 78.370 8 .652 3.834 82.205 9 .621 3.654 85.859 10 .535 3.146 89.005 11 .462 2.717 91.722 12 .395 2.324 94.046 13 .299 1.761 95.807 14 .253 1.489 97.296 15 .189 1.114 98.410 16 .150 .884 99.294 17 .120 .706 100.000
Lampiran 10
OUTPUT KOMPONEN MATRIK SEBELUM ROTASI
Component Matrixa Component 1 2 3 4 5 X11 .094 -.578 .312 .205 .366 X12 .526 -.381 .317 .507 -.013 X13 .557 -.193 .275 .564 .149 X21 .709 -.025 -.283 -.053 .188 X22 .725 .047 -.035 .153 -.057 X23 .688 -.075 -.155 -.368 .191 X24 .652 .500 -.098 .125 -.259 X25 .484 .411 -.059 .217 -.305 X31 .437 -.223 .616 -.270 -.296 X32 .216 -.110 .634 -.530 -.324 X41 -.282 .486 .346 -.006 .180 X42 -.107 .619 .340 .010 .279 X43 -.188 .502 .473 .051 .398 X51 .703 .089 -.113 -.224 .451 X52 .855 .108 .038 -.039 -.054 X53 .690 -.136 -.076 -.428 .265 X54 .740 .313 -.009 .164 -.156
Extraction Method: Principal Component Analysis. a. 5 components extracted.
Lampiran 11
OUTPUT KOMPONEN MATRIK SETELAH ROTASI
Rotated Component Matrixa
Component 1 2 3 4 5 X11 .123 -.407 .651 -.064 .082 X12 .062 .235 .818 -.174 .149 X13 .146 .301 .806 .006 -.005 X21 .664 .331 .154 -.196 -.099 X22 .393 .537 .303 -.131 .065 X23 .770 .178 .014 -.165 .153 X24 .243 .839 -.021 .059 .025 X25 .058 .736 .025 .028 .007 X31 .136 .131 .253 -.045 .823 X32 .083 -.008 -.045 .059 .913 X41 -.180 -.024 -.128 .647 .022 X42 -.019 .112 -.091 .753 -.019 X43 -.052 -.059 .046 .814 .006 X51 .840 .193 .126 .094 -.027 X52 .552 .579 .226 -.075 .228 X53 .824 .084 .055 -.131 .218 X54 .329 .741 .183 .015 .076
Extraction Method: Principal Component Analysis. Rotation Method: Varimax with Kaiser Normalization. a. Rotation converged in 6 iterations.