The Morgan Kaufmann Series in Interactive Technologies
Series Editors: Stuart Card, PARC; Jonathan Grudin, Microsoft; Jakob Nielsen, Nielsen Norman GroupForms that Work: Designing Web Forms for Usability Caroline Jarrett and Gerry Gaffney
Evaluating Children’s Interactive Products: Principles and Practices for Interaction Designers
Panos Markopoulos, Janet Read, Stuart MacFarlane, and Johanna Hoysniemi
HCI Beyond the GUI: Design for Haptic, Speech, Olfactory and Other Nontraditional Interfaces
Edited by Phil Kortum
Measuring the User Experience: Collecting, Analyzing, and Presenting Usability Metrics
Tom Tullis and Bill Albert
Moderating Usability Tests: Principles and Practices for Interacting
Joseph Dumas and Beth Loring
Keeping Found Things Found: The Study and Practice of Personal Information Management
William Jones
GUI Bloopers 2.0: Common User Interface Design Don’ts and Dos
Jeff Johnson
Visual Thinking for Design Colin Ware
User-Centered Design Stories: Real-World UCD Case Studies Carol Righi and Janice James
Sketching User Experiences: Getting the Design Right and the Right Design
Bill Buxton
Text Entry Systems: Mobility, Accessibility, Universality Scott MacKenzie and Kumiko Tanaka-ishi
Letting Go of the Words: Writing Web Content that Works Janice “Ginny” Redish
The Persona Lifecycle: Keeping People in Mind Throughout Product Design
Jonathan Pruitt and Tamara Adlin
Effective Prototyping with Excel: A Practical Handbook for Developers and Designers
Nevin Berger, Michael Arent
Jonathan Arnowitz, and Fred Sampson
Cost-Justifying Usability
Edited by Randolph Bias and Deborah Mayhew User Interface Design and Evaluation
Debbie Stone, Caroline Jarrett, Mark Woodroffe, and Shailey Minocha
Rapid Contextual Design
Karen Holtzblatt, Jessamyn Burns Wendell, and Shelley Wood Voice Interaction Design: Crafting the New Conversational Speech Systems
Randy Allen Harris
Understanding Users: A Practical Guide to User Requirements: Methods, Tools, and Techniques Catherine Courage and Kathy Baxter
The Web Application Design Handbook: Best Practices for Web-Based Software
Susan Fowler and Victor Stanwick
The Mobile Connection: The Cell Phone’s Impact on Society
Richard Ling
Information Visualization: Perception for Design, 2nd Edition Colin Ware
Interaction Design for Complex Problem Solving: Developing Useful and Usable Software
Barbara Mirel
The Craft of Information Visualization: Readings and Reflections
Written and edited by Ben Bederson and Ben Shneiderman Observing the User Experience: A Practitioner’s Guide to User Research
Mike Kuniavsky
Paper Prototyping: The Fast and Easy Way to Design and Refine User Interfaces
WITH EXCEL
A Practical Handbook for
Developers and Designers
Nevin Berger
Michael Arent
Jonathan Arnowitz
Fred Sampson
Morgan Kaufmann is an imprint of Elsevier AMSTERDAM • BOSTON • HEIDELBERG • LONDON
Morgan Kaufmann Publishers is an imprint of Elsevier. 30 Corporate Drive, Suite 400, Burlington, MA 01803, USA This book is printed on acid-free paper.
#2009 by Elsevier Inc. All rights reserved.
Designations used by companies to distinguish their products are often claimed as trademarks or registered trademarks. In all instances in which Morgan Kaufmann Publishers is aware of a claim, the product names appear in initial capital or all capital letters. All trademarks that appear or are otherwise referred to in this work belong to their respective owners. Neither Morgan Kaufmann Publishers nor the authors and other contributors of this work have any relationship or affiliation with such trademark owners nor do such trademark owners confirm, endorse or approve the contents of this work. Readers, however, should contact the appropriate companies for more information regarding trademarks and any related registrations.
No part of this publication may be reproduced, stored in a retrieval system, or transmitted in any form or by any means—electronic, mechanical, photocopying, scanning, or otherwise—without prior written permission of the publisher.
Permissions may be sought directly from Elsevier’s Science & Technology Rights Department in Oxford, UK: phone: (þ44) 1865 843830, fax: (þ44) 1865 853333, E-mail: [email protected]. You may also complete your request online via the Elsevier homepage (http://elsevier.com), by selecting
“Support & Contact”then“Copyright and Permission”and then“Obtaining Permissions.”
Library of Congress Cataloging-in-Publication Data
Application Submitted ISBN: 978-0-12-088582-4
For information on all Morgan Kaufmann publications, visit our Web site at www.mkp.com or www.elsevierdirect.com Printed in China
Dedications xiii
Acknowledgments xv
About the Authors xvii
PART 1
TURNING EXCEL INTO A PROTOTYPING
TOOL 2
1
A DEVELOPER'S DILEMMA 4
A Case Study 5
Introduction 6
Excel Prototyping 7
Prototyping Flexibility 7
Storyboard Prototypes 8
Wireframe Prototypes 9
Paper Prototypes 10
Digital Interactive Prototypes 12
Efficient and Easy 13
Professional Results 13
No Special Skills Required 14
Readily Available 14
Still Not Convinced? 15
Who Should Consider Using Excel? 15
Prototyping Productivity 15
Our Goal 16
2
GETTING STARTED: YOUR FIRST EXCEL
PROTOTYPE 18
Examples of Excel Prototypes 19
How to Create Your First Excel Prototype 19
To Adapt the Template 22
To Add a Header 23
To Add a Search Text Entry Box and
Accompanying Search Button 25
To Add Page Navigation 26
To Build the Hotel Finder Area 27
To Create a Grouping Box Around the Hotel
Finder Area 29
To Create the Placeholder, the Images, and Descriptive
Text for the Featured Hotels Area 30
To Create the Placeholder Descriptive Text 31
To Create the Placeholder Promotional
Information Area 31
Summary 34
About This Book 35
How to Use This Book 35
How to Use the Associated Files 36
3
BASICS: THE EXCEL PROTOTYPING
CANVAS 38
Creating a Prototyping Canvas 39
To Prepare a Canvas 39
To Hide the Grid 40
To Change the Row and Column Dimensions 42
Conclusion 49
4
CREATING AN EXCEL PROTOTYPING
TEMPLATE 50
Templates 51
The Image Library 51
vi
What Graphics Should be Included in Your Image
Library Worksheet? 52
Finding the Images You Need 53
When to Use Graphics Instead of Widgets Built
in Excel 53
To Create the Image Library 54
To Add Graphics to the Template 54
The Boxes & Buttons Worksheet 56
Creating the Boxes & Buttons Worksheet 57
Boxes 57
Buttons 58
The Tabs Worksheet 63
To Create Straight Tabs 65
To Create More Tabs 68
Color Management 70
To Create a New Color 70
The Color Key and Palette 77
The Tips and Tricks Worksheet 77
The Table Template Worksheet 79
Creating the Table Template 80
To Build a Table 80
Modifying the Table 84
The Starter Worksheet 86
Conclusion 87
PART 2
PROTOTYPING WITH EXCEL 88
5
EXCEL PROTOTYPING: STORYBOARDS 90
About Storyboards 91
How to Create an Excel Storyboard
Prototype 95
Creating the Berger Books Storyboard in
Excel 97
To Build a Storyboard 97
To Create the Header 98
To Place a Wireframe Image on the Worksheet 100
To Create a Text Box 102
Options for Presenting Your Storyboard 104
To Add Navigation Links to a Storyboard 105
Conclusion 107
References 107
6
WIREFRAMES 108
Introduction to Wireframes 109
Task Flow or Site Map Diagram 110
To Create Site Map Wireframe Boxes 111
To Add Connectors Between Boxes 112
The Hyperlinked Site Map 114
To Create an Interactive Site Map 114
From Skeletal to Detailed Wireframes 115
The Excel Methodology 117
Conclusion 119
References 119
7
DIGITAL INTERACTIVE PROTOTYPES 120
About Digital Interactive Prototypes 121
How Does an Interactive Prototype
Work? 122
Creating Interactive Prototypes with
Excel 122
Gathering and Verifying Requirements for
the Prototype 123
Creating a Screen Flow Diagram 124
To Import Scanned Drawings or Graphics Created in
Another Application 125
To Create the Thumbnails in Excel 125
To Group Shapes 133
Creating an Interactive Prototype 135
To Create the Interactive Digital Prototype 137
viii
Creating a Drop-Down Menu in Excel 139
To Create a Drop-Down Menu 139
Conclusion 147
References 147
PART 3
PUTTING YOUR EXCEL PROTOTYPE
TO WORK
148
8
ITERATING PROTOTYPES WITH EXCEL 150
Preparing for a Design Iteration 151
Creating Iterations of Your Excel
Prototype 152
Iteration 1: Simple Wireframe 153
Iteration 2: Wireframe with Some Details
154
Iteration 3: Wireframe Updated with Design
Team Feedback 157
Iteration 4: Final Wireframe 164
Conclusion 165
References 165
9
COMMUNICATING YOUR DESIGN IN
EXCEL 166
Introduction 167
Adding a Tooltip to Excel Hyperlinks 169
To Create a ScreenTip Annotation 169
Inserting Comments 172
To Insert a Comment 174
Creating Annotation Areas 177
To Create Annotation Areas 178
Conclusion 185
References 185
10
SHARING YOUR EXCEL PROTOTYPE 186
Introduction 187
Using Your Prototype for Collaboration 187
Mitigating the Risks of Implementing a
Finished Prototype 189
Engineering Can't (or Doesn't Want to)
Implement Your Design 190
Competing Prototypes 190
Outdated Prototypes 190
Misunderstanding and Misinterpretation 191
Tips for Avoiding the Risks in Sharing Your
Prototypes 192
Using a Summary Worksheet 192
Setting the Appropriate Fidelity Level 192
Setting the Appropriate Visual Emphasis 193
To Create a Translucent Overlay 193
Denoting Your Prototype's Interaction
Methods 196
Creating a Simple Click-Through Interaction 196
To Name a Tab 196
To Color a Tab 197
Identifying Which Links Work and Which Are
Just Mocked Up 198
Improving the Appearance and Presentation
of Your Excel Prototypes 199
Conclusion 203
References 203
APPENDIX A: USEFUL TECHNIQUES WITH EXCEL 204
Introduction 205
Creating the Canvas 205
To Turn Off the Display of Gridlines to Create a Blank
Canvas 205
x
Setting Page Attributes for Prototyping 206
To Select the Entire Worksheet 206
To Ensure That Cell Contents Will Be Read as Text
Only and to Prevent Accidental Reformatting 206
To Select a Default Color as a Background Color 206
To Select a Default Font Style 206
To Specify a Background Texture 206
To Apply a Special Background 207
Another Way to Use a Background 207
To Change the Table Cell Orientation for Prototyping
Rather than Making Spreadsheets 209
Formatting Table Cells 209
To Specify How a Cell or Group of Cells Appears 209
Using the Drawing Menu 210
To Insert Shapes 210
To Fill Shapes with Text 211
To Fill a Shape with a Pattern 211
To Group Shapes 211
To Order Shapes 211
Managing Worksheet Tabs 212
Hyperlinking 212
Saving a Workbook as HTML 212
Insert and Delete Cells Shortcuts 213
Drag-and-Drop Shortcuts 216
To Align Elements on a Page 217
Drag-Fill Shortcuts 219
To Apply Drag-Fill 219
Drag-Fill Patterns 221
Copy and Paste: Building Prototype Screens
Quickly 222
Working with Graphics in Excel 223
Selecting Object Mode 223
Draw Menu 224
Formatting Toolbar 224
APPENDIX B: NEVIN DISCOVERS EXCEL AS A RAPID
PROTOTYPING TOOL 226
First Exposure 227
My First Attempts with Excel 228
A Test Case 228
APPENDIX C: GLOSSARY 230
References 233
Index 235
xii
In memory of Gene Berger and Sam Norman.
-NB
To my loving and supportive wife, Jacqueline, and children, Nick and Vanessa.
-MA
I gratefully acknowledge the love and support of my children, Warren, Willy, Ariel,
and Miranda Sampson, without whom there would be no point; the inspiration of
music by Philip Glass, Frank Zappa, David Byrne, Moby, and Blondie; and the
unyielding persistence of the lovely yet talented Spanky Kushner, my lead critic,
who keeps me honest.
I dedicate this volume to the memory of James Julius Sampson, whose mission in
life was to teach compassion: May the long-time sun shine upon you, all love
sur-round you, and the pure light within you guide you all the way on.
-FS
I dedicate this book for my life-partner and spouse Minne Fekkes.
-JA
The authors thank our reviewers, who contributed so much to this book: John
Armitage, Deborah Mayhew, and Dirk-Jan Hoets. With their thoughtful comments
and attention to detail, we are confident the only errors that remain are our own.
Lastly, we would like to make special mention of an essential figure in the creation
of this book: Diane Cerra. Diane was the guiding force behind this book, and the
series of which it is a part. She helped to guide this work to its present shape more
than anyone else. We are especially grateful, and thank Diane from the bottom of
our hearts. Diane, the next Timpano is in your honor.
AUTHORS
Nevin Bergeris the Senior Director of User Experience and Design for TechWeb of
United Business Media. Previously he was the Director of Design at Ziff Davis Media,
Senior Interaction Designer at Oracle Corporation/Peoplesoft, Inc., and held Online
Creative Director positions at World Savings, Ziff Davis, and OFOTO.
Michael Arentis the Vice President of User Experience at SAP Business Objects, and
has previously held positions at SAP Labs, PeopleSoft, Adobe Systems, MetaDesign,
Sun Microsystems, and Apple Computer. He is a co-author of the first definitive
book on software prototyping, Effective Prototyping for Software Makers (Morgan
Kaufmann). In addition, Michael is the holder of a number of national and
interna-tional patents.
Jonathan Arnowitz is currently a Senior User Experience Architect at Google.
Jonathan has over 20 years experience in designing user experiences, and recently
co-authored the bookEffective Prototyping for Software Makers. Jonathan started out
designing interactive multimedia software. In 1991 Jonathan moved to the
Nether-lands where he was an Interaction Design Consultant for over 10 years. Most
recently, Jonathan worked as a Senior Interaction Designer for PeopleSoft and then
as User Experience Architect for SAP Labs where he worked on designing, training,
and implementing User Experience Patterns for the next generation of SAP
Applica-tions. Jonathan is also a volunteer for ACM/SIGCHI where among other things he
was the co-founder of the DUX conference (Designing for User Experiences), former
co-editor in chief of Interactions Magazine, and most recently the Design
Community co-chair for CHI2008. He also loves music, almost any kind but has a
particular place in his heart for Gustav Mahler–as well as things fin-de-siecle in
general.
Fred Sampson is an Information Developer for the Content Management and
Discovery team at the IBM Silicon Valley Lab, where he helps user experience
designers create self-documenting user interfaces. He plans to be an information
architect when he grows up. Fred has been a committee member for the DUX
(Designing for User Experience) and CHI (Computer-Human Interaction) conferences,
and contributes regularly to ACM Interactions magazine. Fred is Vice-President for
Finance of ACM SIGCHI, a senior member of the Society for Technical Communication,
and a member of the Information Architecture Institute and the Usability Professionals
Association. He lives on Monterey Bay in California.
xviii
PART
1
ing to use a tool you already have for your first prototyping exercise. Either way, in
Part 1 ofEffective Prototyping With Excelyou will learn how easy it is to adapt Excel
as a prototyping tool.
nIn Chapter 1 you will consider the challenge faced by one software developer.
n In Chapter 2 you will create your first Excel prototype and learn how easy it really is to do so.
nIn Chapter 3 you will set up an Excel prototyping canvas, the basis for all Excel prototypes.
nIn Chapter 4 you will set up an Excel prototyping template to help you become a prototyping power user.
n The benefits of using ExcelWfor prototyping
n The productivity and collaboration opportunities
n Our goal in creating this book
Note
If you are eager to dive immediately into Excel prototyping, skip ahead to the “How to create your first Excel prototype” section of Chapter 2, on page 16.
A Case Study
In an unnamed software company, long ago and far away, a developer learned that his
product was going to have little access to the company's user interface design
resources. This meant that he received no help with the design—only random,
ad hoc advice from product stakeholders. The developer was concerned about his
pro-duct's usability. He did not want to see his efficient coding wasted on a less than optimal
user interface design. He heard that some user interface designers had set up a stealth
prototyping service to assist developers who needed some unscheduled and
unbud-geted help. How such a thing was possible he didn't know or care; he needed their help.
In desperation the developer went to the designers' Friday office hours. He thought
he would need a whole day to mock up a prototype based on the functional
requirements he had received. He was disappointed to hear that he would have
only an hour of the designers' time and could not imagine that he might walk away
with anything that resembled a codeable prototype.
At the prototyping office, the two designers explained that they would develop the
prototype together; he would get enough direction so that he could do the rest
himself. He could not believe it, but what could he do? He did not know any
proto-typing tools, nor did he have the skills to use such tools.
Much to his surprise, the designers opened Microsoft Excel and used a template file
to implement his designs. The file looked like nothing he had ever seen in Excel
before. The spreadsheet grid was changed into a layout grid, and the worksheets
resembled software window layouts rather than spreadsheets. He learned in the
session how, by using only copy and paste commands, the designers could quickly
create his basic window layout. In fact, within the hour the two designers finished
the work he needed and gave him an Excel file with his designs.
Back at his own office, the developer was satisfied with the results until he realized
that there were some functions that had been neglected. At first he thought he had
to wait until the next Friday for another appointment with the designers. But when
he opened the Excel file and realized that, because he had used Excel before to create
spreadsheets, he was very familiar with the software's features. With no more training
than that short session with the designers, he started to add the missing functionality.
Within the Excel file he found worksheets with the widgets and buttons he needed
and even a worksheet of instructions. He found it easy to copy buttons and to add fields
and text. He made a few mistakes, butCTRL-Zalways undid them. In fact, he learned, as with normal Excel use, thatCTRL-Zundid andCTRL-Yredid multiple steps. This allowed him to make changes, back up, and go forward to compare his changes before
com-mitting to them. No one taught him this prototyping technique; he stumbled on it by
exploring the skills he had already learned with Excel for creating spreadsheets.
After what he thought of as playing around, he realized that he had put the
finish-ing touches on his prototype and had somethfinish-ing to show product management.
Without thinking about it, the developer became an Excel prototyper and had
pro-duced a good enough prototype of his application screens within an hour.
This book will share with you this developer's experience with the simplicity and
ease of Excel prototyping. Having worked in many companies and seen how using
Excel as a prototyping tool helped designers, developers, and product managers
better express their requirements, we feel that we have the experience with Excel
prototyping to empower you as well.
Introduction
This book is about how to prototype with Excel (or another spreadsheet application
with similar functionality).
Introduction
6
This book will also touch lightly on the larger topic of prototyping. Although the
book does not attempt to completely cover the topic of prototyping, it will discuss
prototyping as it relates to prototyping with Excel. For a comprehensive discussion
on prototyping, we refer the reader to our first book, Effective Prototyping for
Software Makers.
Excel is an amazing prototyping tool. It is amazing because it is the only tool we
know that combines these advantages into a single tool:
n Prototyping flexibility
n Efficiency and ease of use
n Professional results
n No special skills required
n Readily available
Excel Prototyping
“Using Excel for prototyping? I don't get it!”
This is a common reaction from people when we first try to describe prototyping
with Excel. The concept is far from what you use Excel for in your daily work. For
some it is like claiming that their washing machine can mow the lawn. People
can-not visualize how it can be done until they see it.
When you look at Excel, you probably just see a spreadsheet; you just can't think
outside the table cell. To understand Excel as a prototyping tool, you will have to
step out of the mental model that says Excel is only a spreadsheet application. This
book will show you how.
Prototyping Flexibility
As a prototyping tool, Excel is not only easy to use, it is quite flexible for the various
methods of prototyping. You can create static screen wireframes, screens with
click-through interaction and navigation, and even prototypes that can be optimized for
different types of usability testing.
To illustrate what we mean, the following images are prototypes created in Excel.
You can experience these prototypes for yourself by visiting the book's Website
and downloading each of these examples as native Excel files:
www.effectiveprototyping.com/ep_excel/.
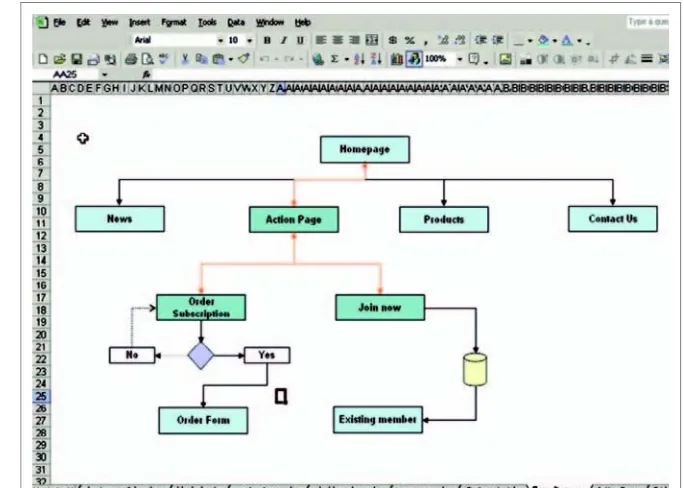
An interaction flow diagram in Excel, which might be the most basic visualization of
a software concept, is illustrated in Figure 1.1.
Storyboard Prototypes
A storyboard is a narrative prototype, usually created in the early stages of the
software-making process, to articulate business and marketing requirements in the
form of a usage scenario or story. These stories narrate the user actions needed to
per-form tasks as specified by marketplace, customer, and user requirements. These
requirements are interpreted into a scenario before the storyboarding process begins.
Because requirements drive the storyboarding process, they provide early insight into
what users, the software, and the system are meant to do in conjunction with each
other. The primary goal of a storyboard is to align the design team's thinking to the
goals and behaviors of the software, regardless of the screen design.
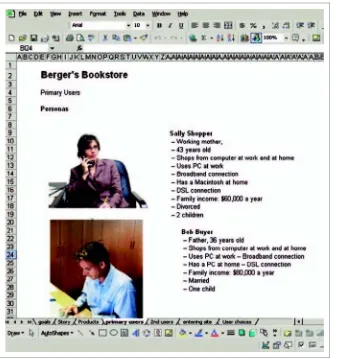
Figure 1.2 is an example of a storyboard in which an interactive narrative is shown
through text and images. The user interface design embodied in an Excel prototype
reflects this narrative as you click from one screen to another, with each screen
contained in a worksheet.
F i g u r e 1 . 1 .
Interaction flow diagram in Excel.
Introduction
8
Wireframe Prototypes
Awireframeis a narrative prototype, usually created in the beginning of the design
process. The narration is usually derived from a use case or scenario, often the same
scenario used in a storyboard. This prototype showsflowcharts, high-level sketches
visualizing conceptual assumptions about the product structure and general
inter-action. The primary goal of this method is to get a design team to agree on basic
concepts.
F i g u r e 1 . 2 .
A storyboard portraying envisioned software interaction.
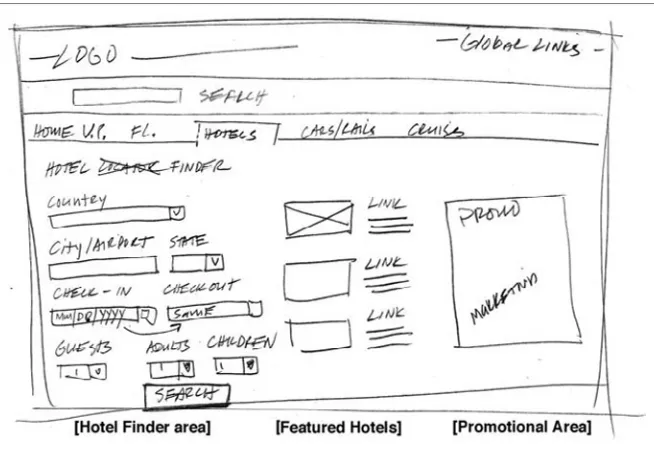
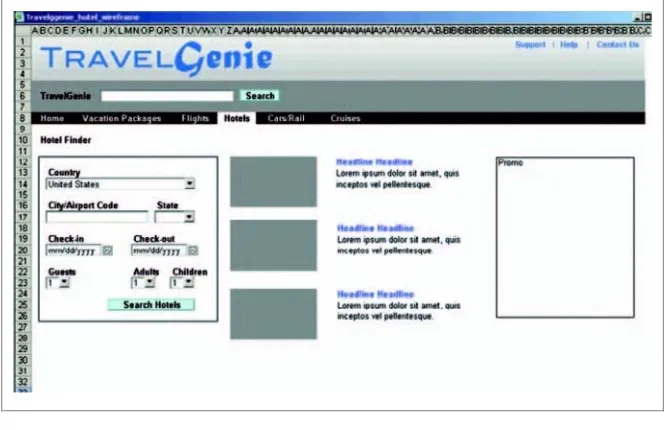
Figure 1.3 shows a rough wireframe of a Website that was created in minutes. This
tool allows functional and rough conceptual issues to be separated from the
detailed, more precise designs that should come later.
Figure 1.4 shows a medium-fidelity wireframe that evolved from the rough
wire-frame shown in Figure 1.3. The design of a medium-fidelity wirewire-frame can help
establish a visual design direction. It can also show a more evolved concept that
includes interaction. As a result, stakeholders get a better idea of the design
com-mitment without your prototyping a finished product.
Figure 1.5 shows a similar design to the previous two figures but with higher visual
and content fidelity, to serve as the specification.
Paper Prototypes
Apaper prototypeis an interactive prototype that consists of a paper mockup of the
user interface. The interface represents a fully functional interface that allows you to
F i g u r e 1 . 3 .
A screen from a rough wireframe of a Website.
Introduction
10
F i g u r e 1 . 4 .
A screen from a medium-fidelity prototype of a Website.
F i g u r e 1 . 5 .
A screen from a high-fidelity prototype of a Website.
usability-test a design. The intended audiences are targeted users who test the
design and the software makers who use the prototype as a means to implement
the software.
Digital Interactive Prototypes
Adigital interactive prototype is a digital version of a paper prototype. Interactive
prototyping shares the same objectives as paper prototyping; that is, they can both
be used to
n Understand task flow and context of use
n Validate assumptions in scenarios, requirements, and user profiles
n Shape task sequencing and interaction design direction
n Evolve prototypes from early rough sketches to the next level of detail
n Validate a visual design direction
Figure 1.6 shows that Excel can also be used to create interactive prototypes of
list-driven products such as email clients.
F i g u r e 1 . 6 .
Screen from a prototype of a list-driven product—an email client.
Introduction
12
Figure 1.7 shows that Excel can also be used to prototype interactive business software.
Notice the drop-down list, which was activated by a user clicking on the menu button.
Excel can also be used to prototype a range of designs, from Windows applications
to AJAX-enabled Websites. Figure 1.8 (page 14) shows an example of a Windows
application prototyped in Excel.
Efficient and Easy
By using Excel, the user can quickly and easily create user interface prototypes. The
results are both quick and professional looking. We know of few other tools that offer
this level of quality for a minimum of effort. Nearly all the effort involves using features
that you probably already know: cut, copy, paste, cell formatting, and so on.
Professional Results
Regardless of the level of prototyping, Excel's adapted layout grid ensures that you
get professional-looking layouts. Field alignment and spatial distribution have never
F i g u r e 1 . 7 .
Screen from a prototype of interactive business software.
been easier. Applying company colors and graphics can also be automated,
allow-ing you to leverage the work of professional designers in your company to achieve
professional-looking results.
No Special Skills Required
Prototyping in Excel requires only the use of basic desktop and Excel functionality.
You can create forms, tabs, and tables using simple cell formatting. You can create
3-D borders for buttons or input fields simply by using cell borders. Field length can
be changed via drag and drop or copy and paste. The only mental shift required is
to stop thinking of the Excel grid as a spreadsheet, instead thinking of it as a
gra-phics layout grid.
Readily Available
If you want your prototyping process to empower your software makers, you need
a tool that everyone can use. Excel is a readily available tool; it is frequently
included on business computers. For the few of you who don't have Excel, there
are alternatives such as OpenOffice, available for free, that put 90 percent of the
techniques from this book to use, although some commands will differ. F i g u r e 1 . 8 .
Screen from a prototype of a Windows application. Prototype courtesy of Dirk-Jan Hoets.
Introduction
14
Still Not Convinced?
As we start to explain the process of prototyping with Excel, you will eventually
understand how it is done. The figures in this chapter help, but you might need
some quick, hands-on experience, which we cover in the next chapter.
At our tutorials and seminars at PeopleSoft, Ziff Davis Media, Google, and SAP Labs,
we encountered the same doubt. After our demonstrations, the results were the
same at all these venues: Excel became an important tool in the audience's
proto-typing toolbox. This is not to say that Excel istheessential tool; Excel does not fulfill
all prototyping needs. But for basic wireframes and digital interactive prototypes,
Excel is an efficient tool you will not want to be without.
Who Should Consider Using Excel?
This book is for anyone who needs to prototype an interface for desktop software or the
Web. It is intended not only for designers but for anyone who is part of the
software-making process. Software makers include the full range of participants, from people
with extensive graphics experience to those with little or no graphics background.
Some of the professionals we have seen using Excel for prototyping include
n Developers and programmers
In short, any stakeholder who needs to express a software idea or requirement
visu-ally or interactively can use Excel. We want to emphasize that this book is about
how to prototype with Excel, not how to prototype in general.
Prototyping Productivity
Simply knowing the features that Excel offers is not enough to make use of the
power of this tool. We have developed a methodology to ensure that Excel
becomes a highly productive tool for you. In this book, you will learn the concept
of theExcel template. A template can contain all the elements you need to make a
prototype, with worksheets that are already built to your site specifications and
lay-out grid for such things as
n Font styles
n Colors
n Graphics
n Icons
n Web widgets
n Input boxes
This all might sound too easy; it is if you think that you don't have to spend time
creating these things yourself. With the methods you will learn from this book,
setting up the template becomes simple. As a bonus, you can download templates
already created for you to help you get started. Visit our Website at
www.effective-prototyping.com/ep_excel to get some ideas of what's available.
Our Goal
Our goal in writing this book is for you to discover that Excel is as easy, productive,
and flexible a prototyping tool as any that's available. So that you can try it yourself
and see its potential, we show you how to use the features in Excel by beginning
with a quick demonstration. Then we provide more detail to give you a working
knowledge of all the features that you will need to build a prototype using Excel.
Our Goal
16
CHAPTER
2
GETTING STARTED: YOUR FIRST
n How to create your first Excel prototype
n About this book
n How to use this book
n How to use the associated files
Examples of Excel Prototypes
You need a quick and easy way to create prototypes. The prototyping tool should
make credible-looking prototypes in variable degrees of fidelity. The tool should allow
varying degrees of interactivity appropriate to your prototyping goals but not require
you to code extensively. The ideal tool would also leverage skills that you already have
so that you do not need to learn anything new. And the truly ideal tool would already
be on your computer—for example, Microsoft Excel.
Look at the examples that follow (Figures 2.1–2.4, pages 20–21). These prototypes look as though they were made in a graphics tool, not a spreadsheet application.
These prototypes were made possible by users learning to think of Excel as a
gra-phics-based design tool rather than an application for spreadsheet calculations.
After you make that mental leap, you will use styles, copy and paste, and drag
and drop to unlock a new, very powerful prototyping tool.
How to Create Your First Excel Prototype
Let's assume that you are in a deadline situation. You have only 30 minutes in
which to create a digital prototype to demonstrate a software concept at a design
meeting with a couple of software engineers. The Excel prototype is based on a
rough paper sketch that you have worked out with the product manager
(Figure 2.5, page 22).
F i g u r e 2 . 1 . A Google calendar interface built in Excel.
F i g u r e 2 . 2 . A prototype for a housewares e-commerce site built in Excel.
How to Create Your First Excel Prototype
20
F i g u r e 2 . 3 . An Excel interactive wireframe prototype of a sports Website.
F i g u r e 2 . 4 . An Excel dashboard prototype for a business software user interface.
Note
As with all the samples shown in this book, you can download a convenient ready-to-use template from the authors’ Effective Prototyping Website:
www.effectiveprototyping.com/ep_excel/.
To Adapt the Template:
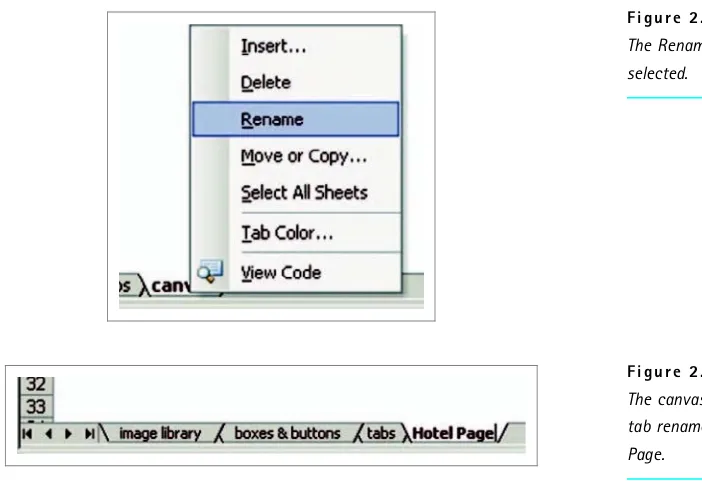
Right-click the worksheet tab namedcanvas, chooseRename(Figure 2.6), and type
in a new text label,Hotel Page(Figure 2.7).
Tip
You can also double-click the tab and type in the new name. F i g u r e 2 . 5 .
The paper prototype sketch that serves as a basis for the ensuing Excel prototype building exercise.
How to Create Your First Excel Prototype
22
To Add a Header:
1. Click the tab named image library, which includes premade graphics that you can use and reuse.
2. Select the graphic that includes the site logo and header, TravelGenie, by clicking it (Figure 2.8).
3. Copy the graphic by pressingCTRL-C.
4. Return to the Hotel Page tab; then press CTRL-V to paste in the header graphic.
5. With the graphic still selected, drag it to the upper-left corner of the worksheet.
F i g u r e 2 . 8 . The header graphic, TravelGenie, selected in the Image Library. F i g u r e 2 . 7 . The canvas worksheet tab renamed to Hotel Page.
F i g u r e 2 . 6 . The Rename function selected.
Note
The graphic should fill the entire width of the worksheet.
Hint
Place the cursor in cell A1 and then paste the graphic in the correct position (Figure 2.9).
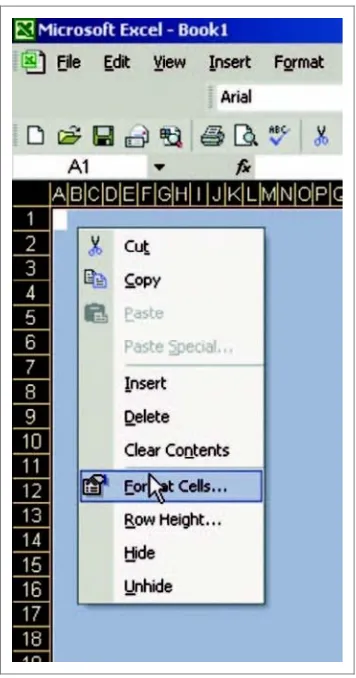
6. Select the three rows below the header (rows 5, 6, and 7).
7. While the rows are still selected, right-click within the selected area and chooseFormat Cellsfrom the menu.
8. In the Format Cells dialog box, click thePatterns tab; then select the gray box located two squares above the white box in the color palette (Figure 2.10).
F i g u r e 2 . 9 . The header graphic, TravelGenie, pasted into the prototype screen.
F i g u r e 2 . 1 0 . Applying a gray color to the three rows selected.
How to Create Your First Excel Prototype
24
9. ClickOK.
10. In cell B6, type in the name of the site:TravelGenie.
11. With the cell selected, click theBoldbutton (Figure 2.11).
To Add a Search Text Entry Box and Accompanying Search
Button:
1. Click theboxes and buttonsworksheet tab.
2. Select the entire text entry box (1) in row 17 (Figure 2.12).
3. With the box still selected, copy the box.
4. Return to the Hotel Page tab and select the cell that is two cells to the right of the TravelGenie text that you have just entered.
5. Paste the text entry box into position (Figure 2.13, page 26).
6. Return to theboxes and buttonsworksheet and select theSearchbutton.
7. Copy theSearchbutton; then paste it to the right of the text entry box (Figure 2.14, page 26).
F i g u r e 2 . 1 1 . Bolding the label Travel-Genie.
F i g u r e 2 . 1 2 . The text entry box (1) selected for copying.
To Add Page Navigation:
1. Go to the tabs worksheet and find the navigation bar of tabs with Hotel selected.
2. Select the entire bar and copy it (Figure 2.15).
3. Return to theHotel Pageworksheet, select cell 8A, and paste the entire navi-gation bar into position (Figure 2.16).
F i g u r e 2 . 1 3 . The search text entry box pasted into position.
F i g u r e 2 . 1 4 . The Search button pasted into position.
F i g u r e 2 . 1 5 . Navigation bar selected for copying.
F i g u r e 2 . 1 6 . The navigation bar pasted into the prototype worksheet.
How to Create Your First Excel Prototype
26
To Build the Hotel Finder Area:
1. Select cell B10 and type in the textHotel Finder; then make the text bold (Figure 2.17).
2. Go to theboxes and buttonsworksheet; then select and copy the combo box graphic (3).
3. Be sure to copy the box as well as the graphic of the down arrow at the right end of the box (Figure 2.18).
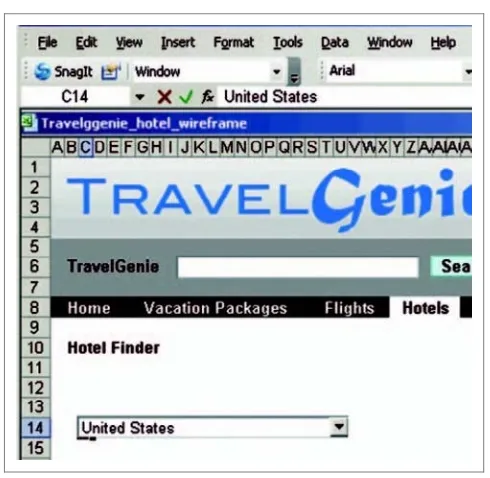
4. Return to theHotel Pageworksheet and select cell C14.
F i g u r e 2 . 1 7 . The text Hotel Finder added and bolded.
F i g u r e 2 . 1 8 . The combo box and arrow graphic selected for copying.
5. Paste the combo box into position (Figure 2.19).
6. Select the cell at the far left of the combo box entry field; then typeUnited States to replace the placeholderText(Figure 2.20).
F i g u r e 2 . 1 9 . Combo box graphic pasted into position.
F i g u r e 2 . 2 0 . Text added into combo box.
How to Create Your First Excel Prototype
28
7. In the cell directly above the finished combo box, type in the labelCountry; then make the text bold (Figure 2.21).
8. Referring to Figure 2.5, use the same method to create the remainder of the text entry and combo boxes, labels, and entered text (boxes 3–6).
Note
Be sure to leave space for the text labels above each input box.
9. Copy theSearch Hotelsbutton (7) and paste it into position (see Figure 2.22, page 30).
To Create a Grouping Box Around the Hotel Finder Area:
1. Select all the cells that encompass the Hotel Finder area.
2. Right-click in the selected area and chooseFormat Cellsfrom the menu.
3. In the Format Cells dialog box, click theBordertab.
4. Select the one-point black line style, and click theOutline icon (Figure 2.23, page 30).
An outline appears around theHotel Findergrouping box (Figure 2.24, page 31).
F i g u r e 2 . 2 1 . Combo box label text added above the combo box.
To the right of the Hotel Finder, you'll create and position placeholders for three
images and accompanying descriptive text for the Featured Hotels area.
To Create the Placeholder, the Images, and Descriptive Text for
the Featured Hotels Area:
1. To create the first placeholder image, select the Rectangle function in the Drawing menu.
F i g u r e 2 . 2 2 . The Search Hotels button added to the Hotel Finder area.
F i g u r e 2 . 2 3 . Applying the outline border.
How to Create Your First Excel Prototype
30
2. Click in the worksheet to the right of the Hotel Finder area and drag a rectan-gle shape (Figure 2.25, page 32).
3. Right-click the border of the rectangle that you just created and selectFormat AutoShapefrom the menu.
4. In the dialog box that appears, select a fill color of gray; then select theNo Linecolor attribute (Figure 2.26, page 32).
5. To make the remaining image boxes, copy the one you just created; then paste it two times so that the boxes align vertically (Figure 2.27, page 33).
To Create the Placeholder Descriptive Text:
1. In theimage libraryworksheet, copy the desired preformatted text and paste it in place to the right of the top placeholder box.
2. Paste two more copies of the text aligned vertically under the top placeholder text and aligned horizontally to the right of the placeholder images they are associated with (Figure 2.28, page 33).
To Create the Placeholder Promotional Information Area:
1. Select the Rectangle drawing tool again and draw a box for the promotional information area to the right of the Featured Hotels area.
F i g u r e 2 . 2 4 . A surrounding border added to the Hotel Finder area.
2. Right-click the rectangle, choose Add Text from the menu that appears (Figure 2.29), then type in the textPromo.
All the elements you need in your initial prototype are now assembled and
arranged in the prototype worksheet (Figure 2.30, page 34). Save the file and send
it to everyone on your team; the design meeting can begin on time! F i g u r e 2 . 2 5 .
A placeholder rectangle positioned to the right of the Hotel Finder area.
F i g u r e 2 . 2 6 . The Format AutoShape dialog box.
How to Create Your First Excel Prototype
32
F i g u r e 2 . 2 7 . Image boxes placed in vertical alignment.
F i g u r e 2 . 2 8 . Preformatted text selected in the image library worksheet.
F i g u r e 2 . 2 9 . Placeholder descriptive text added to the right of the Featured Hotels area.
Summary
You have learned the first steps to becoming a successful Excel prototyper.
Follow-ing similar steps in subsequent chapters will make you an even more accomplished
Excel prototyper. You can start with a template, follow the step-by-step instructions,
and learn both basic and advanced techniques of prototyping.
A Note About Excel
There are many spreadsheet applications now available in the marketplace. Aside from the dominant application, Microsoft Excel, other similar spreadsheet applica-tions are now available for prototyping: Apple’s Numbers, OpenOffice’s Spreadsheet, and Google’s Trixely. All these programs can do much the same thing in varying degrees; you only need to learn the different command structures and functions. Although we chose Excel due to its current pervasiveness, we do not necessarily rec-ommend or endorse Excel to the exclusion of another spreadsheet application that you might already know. To use another product to achieve the same results, you might need to make a table that translates the Excel commands and functions por-trayed in this book to those of your spreadsheet program. If you do make a transla-tion table, we invite you to share it within the Effective Prototyping community by posting it to our book’s Website: www.effectiveprototyping.com.
F i g u r e 2 . 3 0 . A finished Excel prototype design.
Summary
34
About This Book
Thishow-tostyle instructional book was inspired by our experience using Microsoft
Excel as a rapid prototyping tool, a technique that was pioneered by former
People-Soft engineer Mark Miller. (See Appendix B for more about our story on the
discov-ery of Excel prototyping.) All the authors worked at PeopleSoft, in varying
capacities, during the period from 2003–2005. We quickly saw the value of this unique use of Excel and proceeded to evolve the techniques from a simple tool
to the robust rapid prototyping environment discussed in upcoming chapters. We
were so excited about our discovery that we wanted to evangelize it by offering
tutorials and writing this book. We decided that the best way to demonstrate
how to use Excel is through practical examples of prototyping methods.
Each chapter will follow roughly this organization: what you will learn, introduction,
how-to exercises, and summary. Each chapter begins with a brief list of what you
will learn in the chapter, followed by a short introduction to the prototyping
princi-ples covered which will serve as the framework for the how-to examprinci-ples. After the
brief introduction, the body of the chapter focuses on a procedural, step-by-step
instruction on how to perform the prototyping activity with Excel. The procedures
are based on a case study scenario illustrated with supporting visual examples. Each
chapter closes with a summary that is meant to wrap up the chapter as well as give
you a hint of what to expect in the next chapter.
Excel has many redundant commands and ways to accomplish the various
proto-typing procedures. If there is an alternative way we know about, we will call it
out in tips and notes, each clearly marked in a shaded box.
How to Use This Book
This book is structured and paced to guide you from an initial overview of Excel
prototyping to presentations of more and more specific techniques of Excel
proto-typing. Accompanying each chapter are relevant principles of Excel prototyping
that will become the structure from which we will describe the how-to techniques.
Three different prototyping methods are used to demonstrate Excel prototyping
through how-to procedures: storyboards, wireframes, and digital interactive
prototypes.
You'll find that the procedures build on each other as you progress through the
book. However, if you are already an Excel expert and familiar with many of its
func-tions and techniques, you can skip through many of the procedures you already
know and concentrate on the new parts that make prototyping in Excel come alive
for you.
The examples and procedures in this book are based on Excel in Microsoft Office
2002 on Windows XP. You might need to adapt to the version of Excel on your
computer.
How to Use the Associated Files
Although this book is a standalone how-to guide, it is accompanied by a set of
templates and sample content, which can be found on our Website:
www.effectiveprototyping.com.
You can download all the files in a single compressed archive from
www.effective-prototyping.com/ep_excel/prototypes.zip. Enter the user nameexceland the
pass-wordelsevier.
We suggest that you download the files now so that they're available as you work
through the book. As you begin each chapter, you might find it convenient to open
the associated files for easy reference.
How to Use the Associated Files
36
CHAPTER
3
BASICS: THE EXCEL PROTOTYPING
Creating a Prototyping Canvas
To use Excel for prototyping, you will fundamentally change the way you use Excel.
When you first open Excel, you see an empty traditional spreadsheet ready for you
to begin entering data. To create prototypes, you will transform the traditional
spreadsheet of delineated rows and columns into a blank canvas.
The metaphor of the painter's canvas is useful here because it has a great deal in
common with what you are trying to accomplish: A blank canvas is the starting
point for a creative person to visually express his or her ideas.
The parameters that you will use to format your canvas include
n Worksheet cell row height and column width set up specifically for prototyping
n Default font properties: font family, size, style, and colors
n Text alignment properties: horizontal and vertical, orientation, control (such as wrap text)
n Background color or background image
n No visible grid
In this series of exercises you will create an Excel canvas and set the options that
make Excel a prototyping tool.
To Prepare a Canvas:
1. Open a new Excel workbook.
2. You only want to make one of the worksheets a canvas, so delete Sheet 2 and Sheet 3 by right-clicking each tab and clickingDelete(Figure 3.1, page 40). 3. Right-click the Sheet 1 tab and chooseRename. With the name of the tab
highlighted, typeCanvas.
To convert this sheet to a canvas, you will first hide the grid. The grid will still be
there, but the grid lines will be invisible.
To Hide the Grid:
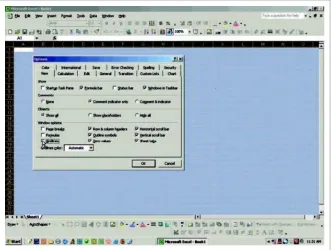
1. ChooseTools > Optionsfrom the menu bar (Figure 3.2).
2. In the Options dialog box, select the View tab and deselect the Gridlines
check box (Figure 3.3).
3. ClickOK.
The gridlines are now invisible. F i g u r e 3 . 1 .
Deleting unwanted worksheets.
F i g u r e 3 . 2 .
Choosing the Options function.
Creating a Prototyping Canvas
40
Tip
Some prototypers like to switch the grid on and off, using it to help them with align-ment; others do not need this visual aid. If you add the Forms toolbar, there is a tog-gle button to turn the grid off and on.
Now you will change the default Excel row and column dimensions so that they
support user interface design and prototyping. Changing the width of the columns
creates a much tighter grid, allowing finer control over the layout of text and
gra-phics. A slightly taller row height better accommodates a standard Windows input
box or drop-down menu. You will see the value of this change in subsequent
chap-ters. The grid can reflect the flexibility and constraints of either your development
environment or your design concept.
F i g u r e 3 . 3 .
Deselect the Gridlines check box.
Tip
Some experienced Excel prototypers have found it handy when the width of a cell is about the width of a single character of the default font used for their prototype.
To Change the Row and Column Dimensions:
1. Click the rectangle at the upper left of the worksheet, where the column and row headers meet, to highlight the entire worksheet.
2. With the entire worksheet highlighted, choose Format > Row > Height
(Figure 3.4) and enter 13for the row height (Figure 3.5).
F i g u r e 3 . 4 .
Choose the Height function.
F i g u r e 3 . 5 .
Enter the Row Height value.
Creating a Prototyping Canvas
42
3. ChooseFormat > Column > Width(Figure 3.6) and enter1for the column width (Figure 3.7).
Tip
n With all the rows and columns selected, you can also click and drag a row or column border to the desired size and it will resize all the rows and columns.
n The Windows shortcutCTRL-1opens the cell properties sheet and is very useful throughout the entire process of Excel prototyping.
F i g u r e 3 . 6 .
Choose the Width function.
F i g u r e 3 . 7 .
Enter the Column Width value.
The Layers of Excel
A characteristic of Excel is its virtual layers. These layers are laid one over another, which is helpful in designing your prototype. Understanding these layers can help you create different effects in Excel. The layers are
Layer 1: Background image; an imported file can be used as a tiled background.
Layer 2: Cell background color; these colors will cover any part of a background image.
Layer 3: Cell text; the text will appear superimposed on a background image or the background color.
Layer 4: Graphical images, auto shapes, and other drawing elements form the top layers. You can adjust overlap order of graphics within layer 4 by using send-to-front and send-to-back functionality. In practice, avoid using more than three graphical layers.
4. With the entire worksheet still highlighted, right-click any cell and choose
Format Cells(Figure 3.8).
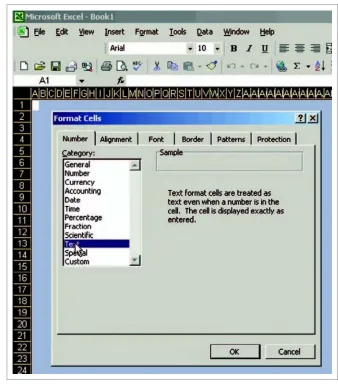
5. SelectTextin the Category list (Figure 3.9, page 46).
Selecting Text from the list stops Excel from autoformatting numbers. Auto-formatting of numbers can result in unintended consequences to the prototype by automatically converting dates, percentages, and other number formats.
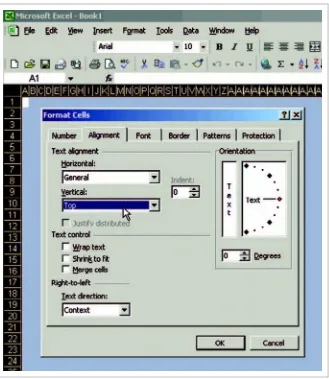
6. Click theAlignment tab and set the vertical alignment to Top (Figure 3.10, page 47).
Setting the alignment to top makes text appear at the top of every cell by default. You can set middle or bottom if you prefer. Whatever alignment you choose, it is useful to have as a default across all your prototypes.
7. Click theFonttab and set the font to Arial, the font style to Regular, and the size to 10 (Figure 3.11, page 48).
The font settings become the default whenever you enter text in the canvas worksheet. If you have a style guide for the user interface that you are design-ing, you can use those font characteristics in your design. Don't worry if you'll need more styles for your design—you can easily override the default setting in individual cells.
Creating a Prototyping Canvas
44
Tip
If there are multiple styles that you will use repeatedly throughout your design, make the most common style your default style, as described earlier. You can create a separate worksheet and create these multiple styles in individual cells. You can do this by selecting a cell and then typing in the name of the style.
You can now copy the style and paste into cell(s) in the canvas, and the pasted cells will inherit the styles from the copied cell and override the default styles.
8. Click thePatternstab, where you can choose a color for all the cells if your design calls for a color other than the default white (Figure 3.12, page 49).
F i g u r e 3 . 8 .
Select the Format Cells function.
In thePatternstab you will see the standard Excel palette. Later you will learn how to create your own custom palette for your template so that your designs match your client's or organization's visual branding or house style.
You now have a canvas worksheet. This canvas worksheet has a grid that is optimally formatted for user interface design, font specifications, and back-ground color. Copy all the other worksheets that you create from this work-sheet so that they'll have the same specifications built into them. Then any worksheet in your prototype will be interchangeable with any others. If you share your designs with any other users, whether they are across the hall or around the world, this will allow your designs to remain consistent.
9. Now save this file asCanvas.xls. F i g u r e 3 . 9 .
Select Text in the Number Category.
Creating a Prototyping Canvas
46
F i g u r e 3 . 1 0 .
Select Top from Vertical alignment.
F i g u r e 3 . 1 1 .
Select Font: Arial.
Creating a Prototyping Canvas
48
Conclusion
You have just completed the most fundamental step in learning to prototype with
Excel. You have changed the Excel worksheet from a spreadsheet to a prototyping
canvas. Although you could start creating a prototype at this point, with a little
more work you can create a prototyping template that makes building prototypes
much easier and quicker. In the following chapter you will create a prototyping
template.
F i g u r e 3 . 1 2 .
Select a cell color.
CHAPTER
4
CREATING AN EXCEL PROTOTYPING
n Boxes and buttons
n Tab components
n Color key and palette
n Tips and tricks
n Table template
n Prototype starter worksheets
Templates
Atemplatecomprises worksheets in a special Excel workbook. The template
con-tains user interface elements and useful information that you can use over and over
as you build prototypes. By using a template as part of your prototyping practice,
you have most of the prototyping building blocks you need available in one
document.
The template facilitates collaboration with your team and stakeholders by enabling
anyone who has the file to continue with the work that you started. Because the
template is built from the canvas worksheet that you already set up, it has default
specifications already integrated into the workbook. As you go through the process
of building these template worksheets, you will gain a better understanding of how
to use Excel for prototyping.
The Image Library
Nearly any prototype that you build will require some graphic elements. For
exam-ple, you might need
n Logos
n Icons
n Buttons
n Interface widgets
n Illustrations
n Headers or footers
You can store these graphics in an image library worksheet (Figure 4.1) for easy
access so you can
n Reserve this worksheet for images that are not created in Excel.
n See the available images together on one worksheet.
n Group them in ways that make sense to you.
n Show them in context with each other; for example, the plus icon goes next to the minus icon.
n Copy many images at a time if needed.
What Graphics Should be Included in Your Image Library
Worksheet?
There is no set number of images that you should include in your template. The
image library is not intended to contain every graphic that you might ever need,
F i g u r e 4 . 1 .
A worksheet that contains an image library.
The Image Library
52
but it is a place to keep the ones you think you will regularly use. In our experience
at PeopleSoft and SAP, we found that only a small percentage of all the available
graphics was needed to prototype most of the designs. Because the size of your
workbook file could become large and cumbersome, take care not to accumulate
too many graphics. Too many graphics could slow down your work and make your
prototype less readily transportable. As you work on your project and find you need
more graphics, you can always add them to the template as you evolve your
designs.
Finding the Images You Need
Where can you find the images to put in your template? You have a few
alternatives:
n Find appropriate graphics on another Website or application (paying appropri-ate attention to copyright issues).
n If you are working in a company that has a design or art department, it will often have an image library that you can use.
n Create them yourself.
n For some very simple graphics, Excel and other office applications have clip art that you can use.
When to Use Graphics Instead of Widgets Built in Excel
In subsequent chapters you will learn to build some widgets directly in Excel. How
do you decide whether you should make your own each time in Excel or to save a
graphic into your image library? Images that are specific to your site, such as logos,
icons, or nonstandard buttons, would be good candidates for inclusion in the
library. Parts of standard widgets that you will use all the time, such as the down
arrow for a pull-down menu, are good to have available, and you can copy those
directly from our templates.
Use the right level of fidelity in your prototypes. Not every prototype needs to be
pixel-perfect. For example, is it important to have an exact copy of aSavebutton
in a wireframe? Or is a generic Save button built with table cells in Excel good
enough? See“Creating the boxes & buttons worksheet”below. The benefit of table cell buttons built in Excel is that you can change the text in the button at will,
whereas you cannot change a static graphic button in Excel.
You will find a file of images on our Website for your use in building an image
library: www.effectiveprototyping.com/ep_excel.
Save the file where you can access it easily while using this book.
To Create the Image Library
1. Open the Excel Canvas file that you created and saved earlier.
2. Right-click theCanvasworksheet tab and selectMove or Copy(Figure 4.2).
3. In theBefore sheetlist in the Move or Copy dialog box, select(move to end) and selectCreate a copy; then clickOK(Figure 4.3).
4. With the new tab selected, right-click and chooseRename.
5. With the tab text highlighted, type inImage Library(Figure 4.4).
Now that you have your Image Library worksheet, we'll show you how to add
graphics to it.
To Add Graphics to the Template:
1. From the Draw toolbar, clickInsert Picture From File (Figure 4.5). Alterna-tively, choose Insert > Pictureand clickFrom File.
2. Browse to where you saved the sample graphics file, exp.xls.
3. Select the graphic called exp_graphic1.gif; then click Insert. The inserted graphic will appear highlighted on the Image Library worksheet.
4. Do the same for graphics labeled 2–9.
F i g u r e 4 . 2 .
Select function Move or Copy.
The Image Library
54
Note
If you are copying graphics directly from a Website into Excel, you might inadver-tently copy a hyperlink associated with the graphic. To solve this problem, after you have pasted the graphic into your template, right-click the graphic and select
Remove hyperlink.
F i g u r e 4 . 3 .
Choose (move to end).
F i g u r e 4 . 4 .
Type Image Library over the default tab name.
F i g u r e 4 . 5 .
Click the Insert Picture From File icon.
To finish your Image Library worksheet, position the graphics in groupings that
make sense to you. Keeping your graphics organized will help you to locate exactly
what you need. This organization will also help others who use your template to
find a specific kind of image.
The Boxes & Buttons Worksheet
This template worksheet includes different types of boxes and buttons that you will
need as you design your interface (Figure 4.6). Although you might already have
F i g u r e 4 . 6 .
The boxes & buttons worksheet.
The Boxes & Buttons Worksheet
56
boxes or buttons that you copied on to your image library worksheet, these buttons
are made from Excel table cells, borders, and text. You can change their size as well
as the text so that they are much more flexible than static graphics.
The boxes (text entry fields, combo boxes, and so on) that are represented in
Figure 4.1 were used in a Web application interface. By including this worksheet
as part of your template, you will save yourself hours of work in the future.
Creating the Boxes & Buttons Worksheet
Start by opening your Excel template and right-clicking theCanvastab to create a
new worksheet the same way you created the Image Library. Name this worksheet
boxes and buttons.
Boxes
Your first box is a combo box control that uses bordered table cells and a graphic
from the Graphics Library (Figure 4.7, page 58).
To Create the Combo Box:
1. Using your cursor, select a horizontal area of cells.
2. With the cells highlighted, right-click and chooseFormat Cells (Figure 4.8, page 59).
3. Click theBorder tab.
4. For this exercise you will change the default border color to a dark gray.
5. In the lower-right corner, click the down arrow next to Automatic under Color. A color palette will appear.
6. Select the middle gray by clicking it (Figure 4.9, page 60). All the line styles will now be this gray color.
7. Select the two-pixel line (Figure 4.10, page 61). In the center of the dialog box is a white box labeledBorderwith small tick marks. The tick marks represent the table cells that were highlighted on the worksheet.
8. Click in the upper-left part of the box with the arrow (Figure 4.11, page 62).
9. Then click the one-pixel line in theStylebox.
10. Returning to the Border box, click the left and bottom sides of the box (Figure 4.12, page 63).
13. ClickOK. After you deselect the table cells, you see a box that appears to be recessed, just like a normal input field (Figure 4.13, page 64).
14. Click yourImage Librarytab and find the gray box with the down arrow that you copied into the library previously. Right-click the graphic and choose Copy(Figure 4.14, page 64).
15. Return to the boxes and buttonsworksheet and highlight the cell at the right end of the box that you just created. Paste the down arrow into the table cell (Figure 4.15, page 64).
You just created a combo box control (Figure 4.16, page 65).
To provide a range of boxes, repeat this process with different dimensions to create
different variations and kinds of boxes (Figure 4.17, page 65).
Buttons
The buttons you create are also very simple in design. They might not look like the
buttons you will end up using on your site, but they will express the idea of a
but-ton you'll need for a prototype.
When you built the input boxes, you created a widget that looked like it was inset.
To create buttons, you will make a box that looks raised, as though you could
click it.
F i g u r e 4 . 7 .
Selecting a canvas area to place a combo box.
The Boxes & Buttons Worksheet