DATA FUSION OF LIDAR INTO A REGION GROWING STEREO ALGORITHM
J. Veitch-Michaelis a, J-P. Muller a, J. Storey b D. Walton a, M. Foster b
a
Imaging Group, Mullard Space Science Laboratory (University College London, Holmbury St Mary, RH5 6NT, UK - (j.veitchmichaelis.12, j.muller, d.walton)@ucl.ac.uk
b IS Instruments Ltd, 220 Vale Road, Tonbridge, TN9 1SP, UK (jstorey, mfoster)@is-instruments.com
KEY WORDS: Stereo vision, LIDAR, Multisensor data fusion, calibration, 3D reconstruction
ABSTRACT:
Stereo vision and LIDAR continue to dominate standoff 3D measurement techniques in photogrammetry although the two
techniques are normally used in competition. Stereo matching algorithms generate dense 3D data, but perform poorly on low-texture image features. LIDAR measurements are accurate, but imaging requires scanning and produces sparse point clouds. Clearly the two techniques are complementary, but recent attempts to improve stereo matching performance on low-texture surfaces using data fusion have focused on the use of time-of-flight cameras, with comparatively little work involving LIDAR.
A low-level data fusion method is shown, involving a scanning LIDAR system and a stereo camera pair. By directly imaging the LIDAR laser spot during a scan, unique stereo correspondences are obtained. These correspondences are used to seed a region-growing stereo matcher until the whole image is matched. The iterative nature of the acquisition process minimises the number of LIDAR points needed. This method also enables simple calibration of stereo cameras without the need for targets and trivial co-registration between the stereo and LIDAR point clouds. Examples of this data fusion technique are provided for a variety of scenes.
1. INTRODUCTION
Stereovision and LIDAR remain the two most commonly used methods for 3D reconstruction. Stereo camera systems can provide dense 3D information, but image matching is a computationally complex problem and reconstruction coverage and accuracy suffer if the image does not have sufficient texture. LIDAR derived ranges are accurate and are not significantly dependent on surface texture, albeit they are dependent on avoiding specular reflection angles for certain types of shiny surfaces, but in most systems the laser must be scanned to build up a 3D image.
This paper proposes a novel method for integrating LIDAR ranges into a region growing stereo matching algorithm, proposed initially by (Muller and Anthony, 1987). In particular, the image of the LIDAR spot on the scene is used to provide unambiguous seed points in regions where there is low texture.
1.1 Data fusion with stereo systems
In recent years, there has been a large amount of research into integrating additional sources of range information into stereo matching algorithms. Stereo data fusion algorithms generally attempt to solve the problem of ambiguous matches arising from homogenous or repetitive texture. Obvious candidate techniques for data fusion are those that actively sense the scene.
Most research has focused on the use of Time of Flight Cameras (ToFCs) (Lange and Seitz, 2001), (Foix et al., 2011), which are now available commercially at low cost (e.g. Microsoft Kinect for Xbox One). ToFCs offer active illumination and dense 3D imaging data in real-time. However, the usable range of a couple of metres depends on the modulation frequency of the illumination and performance outdoors, due to the use of near infrared illumination, is not guaranteed. ToFC range data tends to be relatively noisy with accuracy in the millimetre scale. The
use-cases for these systems are dominated by robotics, where real-time imaging is desirable for navigation and mapping.
Broadly, there are two classes of fusion algorithm:
A priori methods using ToFCs have been used with most of the common state-of-the-art stereo matching algorithms including dynamic programming (DP) (Gudmundsson et al., 2008), graph cuts (Hahne and Alexa, 2008); (Song et al, 2011), belief propagation (Jiejie Zhu et al., 2011) and semi-global matching (SGM) (Fischer et al., 2011). ToF range data is used to overcome the limitations of stereo in homogenous image regions while stereo range data is retained near depth discontinuities. First, a range interval is obtained for every pixel in the ToF system. This range interval is then mapped to each pixel in the stereo system and used as a constraint on the matching algorithm, either limiting the disparity search space or as an adjusted matching cost function.
A posteriori methods combine two (or more) complete range images, ideally producing an image that is better than any of the inputs alone. (Kuhnert and Stommel, 2006) merge ToF data with results from winner-take-all (WTA) and simulated annealing stereo. ToF data is retained in homogenous regions where stereo fails and is also used to detect blunders in the disparity map. (Beder et al., 2007) use an approach based on patchlets (Murray and Little, 2005), rectangular surface elements defined at every pixel in the disparity image. In both cases the fused data are an improvement over stereo or ToF alone, but results are limited by the low resolution of the ToF cameras.
1.2 Data fusion of stereo with LIDAR
Comparatively little work has involved LIDAR at close range. (Romero et al., 2004) use a 2D scanning LIDAR to seed the disparity map in a trinocular stereo system. Initial disparity estimates are calculated using LIDAR ranges which are then propagated through the image based on a set of rules that
consider image texture and horizontal and vertical pixel correspondences. Results from a standard stereo matcher are not provided, but the LIDAR does improve matching performance in homogenous image regions.
(Badino et al., 2011) follow an approach largely similar to that used with ToFCs. A 3D scanning LIDAR is used to generate a minimum and maximum range map for the scene. This is then used to constrain WTA and DP stereo matchers. The presented scenes are all outdoors and the fused data contains significantly fewer blunders than stereo matching alone.
The technique presented in this paper departs from previous work. Using a visible LIDAR scanner, it is possible to perform data fusion at a lower level by imaging the LIDAR spot as it scans through the scene.
2. 3D IMAGING SYSTEM
The imaging system used for this research consisted of a stereo camera pair and a single point LIDAR mounted on a gimbal DMK23UM01 monochrome cameras with a resolution of 1280x960px, fitted with 8mm focal length lenses set to f/4. A custom stereo bar was built using a rail (Thorlabs XT95SP) with each camera mounted on a manual rotation stage (Thorlabs RP01) and carriage (Thorlabs XT95P11).
2.2 LIDAR and mount
The LIDAR used was a Dimetix FLS-C10 with a specified accuracy of ±1mm, repeatable to ±0.3mm on natural surfaces up to a distance of 65m. This sensor uses a visible (650nm) laser beam and can operate at up to 20Hz in its highest resolution mode. The LIDAR is mounted on a Newmark GM-12 gimbal mount with a specified resolution of 300µrad and a repeatability of 20µrad.
2.3 System geometry and model
The stereo system was modelled using the conventional pinhole camera model including radial and tangential lens distortion
(Hartley and Zisserman, 200). Camera intrinsic and stereo calibration was performed using the OpenCV (Bradski, 2000) library implementation of (Zhang, 2000) employing a planar chessboard target. This calibration is then used to epipolar rectify the images prior to stereo reconstruction. Calibration results are shown in Table 1.
Calibration Parameter Left Camera Right Camera Focal length (mm) 8.378 8.387
Principal Point (mm) (2.459, 1.803) (2.443, 1.780) Rectified Position (m) (0.0,0.0,0.0) (0.463, 0, 0) Reprojection Err. (px) 0.104 0.103 Table 1 Calculated stereo camera calibration parameters
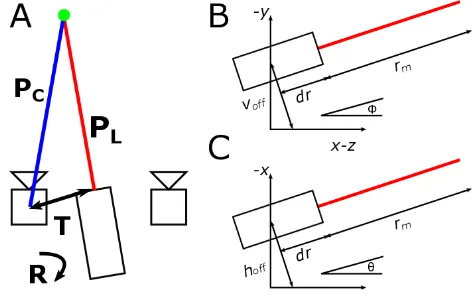
The geometric model for the LIDAR allows for systematic translational and rotational offsets, similar to (Muhammad and Lacroix, 2010). Five parameters are required: two for translational offsets orthogonal to the laser beam axis, two for rotational offsets with respect to the reported position of the mount and a distance offset. This geometry is shown in Figure 2.
!"" – Horizontal translation orthogonal to laser beam
�
!"" – Vertical translation orthogonal to laser beam
�
! – Systematic elevation offset
�! – Systematic azimuth offset �
!,�!,�! – LIDAR world coordinates
The conversion to Cartesian coordinates is as follows:
�=�!+�� (1)
Note the use of a right hand coordinate system consistent with stereo imaging conventions – the z-axis represents depth, directed into the scene. Without loss of generality, the world origin is chosen to be the centre of projection in the left camera.
2.4 Cross-Calibration
The use of a visible laser allows for simple intrinsic and extrinsic calibration of the LIDAR. The LIDAR is scanned in a raster fashion across a scene. At each orientation, a stereo pair is synchronously acquired and the location of the laser spot in the epipolar-rectified images is determined using a maximum filter. A short exposure time of 1/5000s is used to ensure that the image of the spot is not saturated. Thus two point clouds are produced: one from the LIDAR ranges and one from the stereo reconstruction of the LIDAR laser spot.
Assuming a good stereo calibration, the LIDAR intrinsic and extrinsic parameters with respect to the stereo system may be determined using least squares minimisation. The error to be minimised was chosen to be the Euclidean distance between corresponding points in the stereo point cloud and the LIDAR point cloud. For a stereo reconstructed point �!,! and corresponding LIDAR point �!,!, the minimisation function is:
min!,!,! !||(��!,!+�)−�!,!|| (2)
Where � and � are a rotation and translation matrix bringing the LIDAR point cloud onto the stereo point cloud and � represents the LIDAR intrinsic parameters.
It is expected, for the system described here, that the intrinsic parameters are close to zero. Initially, � and � are estimated using a rigid body transformation between the two point clouds since there is a one-one correspondence between them. After transformation, any points with a large distance error (further from the mean by more than two standard deviations) are discarded. This effectively removes most spurious correspondences, for example LIDAR points which are occluded in one image. With these points removed, the rotation and translation are estimated again to get initial values for the minimisation. The LIDAR intrinsic parameters are initialised to be zero. The rotation offsets �� and �� were both fixed to be zero for better parameter convergence.
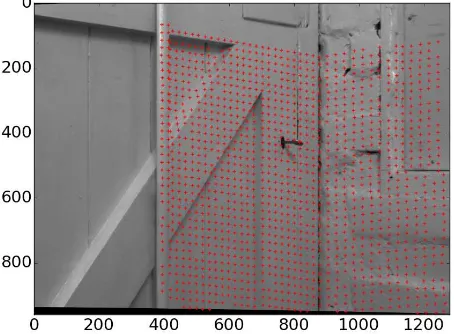
Figure 3 Epipolar-rectified left image of calibration scene, locations of calibration points are plotted.
The calibration scene (Figure 3) was chosen to be a wall corner to avoid coplanar calibration points. There is no particular requirement for the target to be planar, however.
Calibration Parameter Value
Translation, T (mm) (-214.10, 287.55, 225.17) Rotation, R (deg) (-1.83, 0.29, 0.013) Distance offset, �� (mm) 21.21
Horizontal offset, ℎ!"" (mm) 1.05 Vertical offset, �!"" (mm) 15.02
Table 2 Calculated LIDAR intrinsic and extrinsic parameters.
Calibration parameters are given in Table 2. Co-registered LIDAR and stereo points are shown in Figure 4 from an overhead perspective. The LIDAR points are visibly more tightly clustered than the stereo points. The registration error between the two point clouds is shown in Figure 5.
Figure 4 Overhead view of calibration points from each measurement system.
Figure 5 Registration error between LIDAR and Stereo point clouds.
The registration error was found to be (1.21±1.11mm). Some error is likely due to uncertainties in determining the laser spot location; further work will investigate ways to improve this.
3. DATA FUSION ALGORITHM
The proposed algorithm operates at a lower level of fusion than prior work. It aims to directly address the issue of poor stereo matching performance in low texture regions.
3.1 GOTCHA stereo matcher
The stereo matcher used is based on the Gruen-Otto-Chau Adaptive Least Squares Correlation (GOTCHA) algorithm, (Otto and Chau, 1989). The actual GOTCHA used here is based on (Shin and Muller, 2012) which is a 5th generation version of the original. GOTCHA is a region growing stereo matcher taking as input a stereo pair and a list of initial, proposed correspondences or tiepoints. These tiepoints are either selected manually or are automatically generated using a feature detector such as SIFT (Lowe, 2004).
This method has proved to be accurate and robust, for example when applied to spacecraft (Day and Muller, 1989); (Thornhill et al., 1993); close-range industrial (Muller and Anthony, 1987); (Anthony, Deacon and Muller 1988); close-range medical (Deacon et al., 1991) and Martian rover imagery (Shin and Muller, 2012).
The algorithm uses Adaptive Least Squares Correlation (ALSC) (Gruen, 1985) to refine and determine correspondences to sub-pixel accuracy, providing a disparity estimate and a confidence score. If a tiepoint is successfully matched, its neighbouring pixels are added to a priority queue, sorted by match confidence. ALSC is performed on the neighbours of the highest confidence tiepoint and any matches are added to the tiepoint queue. The process iterates until the queue is empty. Thus the disparity is grown from the initial seed points, preferentially matching from the regions with highest confidence.
3.2 Proposed algorithm
Normally the initial seed points are generated using SIFT keypoint matching. This approach excels in regions of high image texture, but results are poor in low texture regions where there tend to be multiple keypoints with similar descriptors.
Since the LIDAR spot is visible in both images, it can provide unique stereo correspondences. Instead of using a feature detector like SIFT, the laser spot locations are used directly as unambiguous seed points for GOTCHA. Imaging matching is performed using GOTCHA and gaps in the disparity map may be filled using LIDAR data.
This approach has several advantages over previous work. Compared to methods that use ToFCs, the LIDAR has higher accuracy and can be aimed with finer resolution. By using a visible LIDAR, cross calibration between the two coordinate systems becomes straightforward; this is particularly useful for gap filling, as the two point clouds are easily co-registered. Compared to other data fusion techniques, this method requires relatively few points from the LIDAR.
4. RESULTS
A demonstration scene of a white-painted laboratory brick wall was chosen to be representative of the challenges involved with imaging indoor scenes. The left camera view is shown in Figure 6. The four kiln bricks were included to provide regions of high texture, in contrast to the wooden panel.
Figure 6 Example scene to be reconstructed. Left stereo image, epipolar rectified.
Figure 7 Matched SIFT keypoints, left stereo image, epipolar rectified.
Figure 7 shows the matched SIFT keypoints for the stereo pair. As expected, there are very few keypoints located on the panel implying a very low texture region. Figure 8 shows the result from GOTCHA using these SIFT keypoints. Match performance is good on the kiln bricks, reasonable on the painted brick wall and poor on the flat wooden panel.
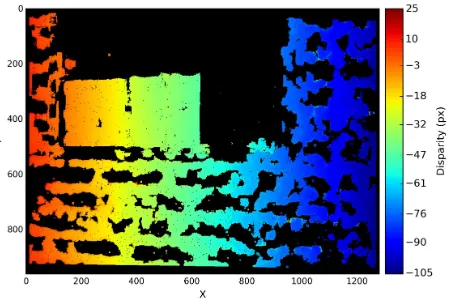
Figure 8 Disparity map using SIFT keypoints as seeds for GOTCHA stereo matching.
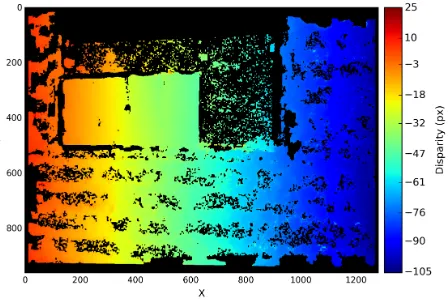
Figure 9 Disparity map using 30000 random LIDAR points as seeds for GOTCHA stereo matching.
The match results are clearly correlated with the location of the initial tiepoints. In particular the panel provides little texture for the matcher to grow into.
Figure 9 shows the same scene, but with 30000 randomly selected LIDAR points used as seeds. There is a 26.5% increase in the number of matched pixels and improvement is visible throughout the image. Performance is still degraded in low texture regions, such as the panel and between bricks, where there are isolated matched pixels from which the disparity could not be grown. These regions would be suitable for gap filling by scanning the LIDAR.
5. CONCLUSIONS AND FUTURE WORK
A novel data fusion algorithm has been presented, incorporating data from a visible scanning LIDAR into a region growing stereo matcher to produce denser disparity maps without loss of accuracy. This is achieved by using the image of the LIDAR laser spot to generate unambiguous seed points for the GOTCHA stereo matcher. Imaging the LIDAR spot also allows for straightforward target-less calibration of the LIDAR system and registration between the stereo and LIDAR point clouds.
Future work will look into improving cross calibration, in particular the possibility of calibrating camera intrinsic parameters using the LIDAR alone. Additionally, smarter methods of scanning the scene, based on pre-selecting areas of low image texture could focus the number of LIDAR points required for dense reconstruction on these areas where they will have the most impact.
6. REFERENCES
Anthony, A.G., Deacon A.T., Muller J.-P., (1988) A close range vision cell for direct input to CAD systems. IAPR Workshop on Computer Vision, October, pp. 12-14 Badino, H., Huber, D., Kanade, T., 2011. Integrating LIDAR
into Stereo for Fast and Improved Disparity Computation, in:. Presented at the 3D Imaging, Modeling, Processing, Visualization and Transmission (3DIMPVT), 2011 International Conference on, IEEE, pp. 405–412. Beder, C., Bartczak, B., Koch, R., 2007. A Combined Approach
for Estimating Patchlets from PMD Depth Images and Stereo Intensity Images, in: Hamprecht, F., Schnörr, C., Jähne, B. (Eds.), Lecture Notes in Computer Science.
Springer BerlinHeidelberg, pp. 11–20.
Bradski, G., 2000. The opencv library. Doctor Dobbs Journal
25, 120–126. http://www.opencv.org (17 Apr 2015) Day, T., Muller, J.-P., 1989. Digital elevation model production
by stereo-matching spot image-pairs: a comparison of algorithms. Image and Vision Computing 7, 95–101. Deacon, A., Anthony, A., Bhatia, S., & Muller, J. (1991).
Evaluation of a CCD-Based Facial Measurement System.
Medical Informatics, 16(2), 213–228
Fischer, J., Arbeiter, G., Verl, A., 2011. Combination of Time-of-Flight depth and stereo using semiglobal optimization, in: IEEE International Conference on Robotics and Automation (ICRA) Shanghai, China, pp. 3548–3553. Foix, S., Alenya, G., Torras, C., 2011. Lock-in Time-of-Flight
(ToF) Cameras: A Survey. IEEE Sensors J. 11, 1917– 1926
Gruen, A., 1985. Adaptive least squares correlation: a powerful image matching technique. South African Journal of Photogrammetry 14, 175–187.
Gudmundsson, S.A., Aanaes, H., Larsen, R., 2008. Fusion of stereo vision and Time-Of-Flight imaging for improved 3D estimation. IJISTA 5, 425.
Hahne, U., Alexa, M., 2008. Combining Time-Of-Flight depth and stereo images without accurate extrinsic calibration.
IJISTA 5, 325.
Hartley, R. I. and Zisserman, A., 2004. Multiple View Geometry in Computer Vision 2nd Ed. Cambridge University Press. Jiejie Zhu, Liang Wang, Ruigang Yang, Davis, J.E., Zhigeng
Pan, 2011. Reliability Fusion of Time-of-Flight Depth and Stereo Geometry for High Quality Depth Maps. IEEE Trans. Pattern Anal. Machine Intell. 33, 1400–1414. Kuhnert, K., Stommel, M., 2006. Fusion of Stereo-Camera and
PMD-Camera Data for Real-Time Suited Precise 3D Environment Reconstruction, in:. IEEE/RSJ International Conference on Intelligent Robots and Systems, Beijing, China, pp. 4780–4785.
Lange, R., Seitz, P., 2001. Solid-state time-of-flight range camera. IEEE J. Quantum Electron. 37, 390–397. Lowe, D.G., 2004. Distinctive image features from
scale-invariant keypoints. International Journal of Computer Vision 60, 91–110.
Muhammad, N., Lacroix, S., 2010. Calibration of a rotating multi-beam lidar, IEEE/RSJ International Conference on Intelligent Robots and Systems, pp. 5648–5653. Murray, D., Little, J.J., 2005. Patchlets: Representing Stereo
Vision Data with Surface Elements. Seventh IEEE Workshops on Application of Computer Vision. Colorado, USA, Vol 1. , 192–199.
Muller, J-P., Anthony, A., 1987. Synergistic ranging systems for remote inspection of industrial objects Proc. 2nd Industrial & Engineering Survey Conference, held at University College London, 2-5 September 1987, pp270-291
Otto, G.P., Chau, T., 1989. “Region-growing” algorithm for matching of terrain images. Image and Vision Computing
7, 83–94.
Romero, L., Núñez, A., Bravo, S., Gamboa, L., 2004. Fusing a Laser Range Finder and a Stereo Vision System to Detect Obstacles in 3D, in: Lemaître, C., Reyes, C., González, J. (Eds.), Lecture Notes in Computer Science. Springer Berlin Heidelberg, pp. 555–561.
Shin, D., Muller, J.-P., 2012. Progressively weighted affine adaptive correlation matching for quasi-dense 3D reconstruction. Pattern Recognition 45, 3795–3809. Song, Y., Glasbey, C., Heijden, G.A.M., Polder, G., Dieleman,
J.A., 2011. Combining Stereo and Time-of-Flight Images with Application to Automatic Plant Phenotyping, in: Heyden, A., Kahl, F. (Eds.), Lecture Notes in Computer Science. Springer Berlin Heidelberg, pp. 467–478.
Thornhill, G., Rothery, D., Murray, J., Cook, A., Day, T., Muller, J., & Iliffe, J., 1993. Topography of Apollinaris-Patera and Maadim-Vallis -Automated Extraction Of Digital Elevation Models. Journal of Geophysical Research-Planets, 98(E12), 23581–23587 Zhang, Z., 2000. A flexible new technique for camera
calibration. IEEE Trans. Pattern Anal. Machine Intell. 22, 1330–1334.