isprs archives XLI B3 475 2016
Teks penuh
Gambar
Dokumen terkait
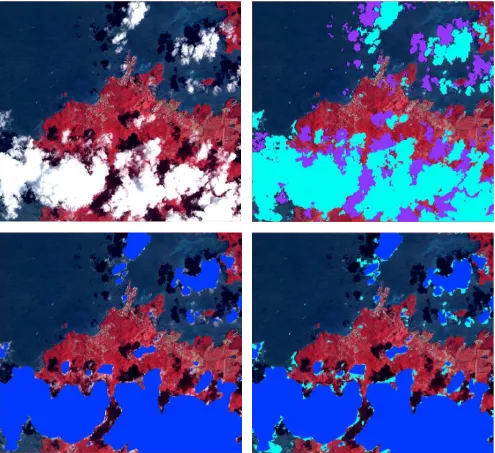
For the background suppressed haze thickness index (BSHTI) and improvement background suppressed haze thickness index (IBSHTI) have the characteristics of thoroughly cloud
There are multiple methods of segmentation and classification of urban point clouds, but we can at first distinguish between meth- ods using a 2D information (either by projecting
Moreover, we in- troduced two new segment features for airborne point clouds de- scribing the distance and the orientation of each segment with re- spect to the closest road..
generation of point cloud from imagery using semi-global image imaging technology, detection of buildings from the generated point cloud, classification of
The perspective intensity image is generated directly from the point cloud by using the collinearity equation, therefore three dimensional coordinates of the tie points
In this study, we propose a processing of point cloud data by extracting geometrical features of 3D point cloud using Fast Point Feature Histogram (FPFH) and a classification of
This method implies a mainly planar scene to avoid mismatches; (ii) coregistration of both the dense 3D point clouds from RGB images and from TIR images by coregistering 2D
Specifically, terrestrial laser scanning (TLS) collects high resolution 3D point clouds allowing more accurate monitoring of erosion rates and processes, and thus, quantify the
