______________________________________________________________________________________ Volume 7
Temporal and Spatial Variation of Nutrient Leaching
from Agricultural Land in Latvia: Long Term Trends
in Retention and Nutrient Loss in a Drainage and
Small Catchment Scale
Viesturs Jansons
1, Ainis Lagzdins, Laima Berzina
3, Ritvars Sudars
4, Kaspars Abramenko
5,
1-5Latvia University of AgricultureAbstract - Agricultural run-off monitoring and losses of nitrogen (N), phosphorus (P) from small (60 – 960 ha) catchments and drainage fields (12 – 77 ha) in Latvia were analyzed. The catchments represent areas with different agricultural production intensity, landscape, soils and climate. Results from the long-term monitoring show (i) large differences in levels of losses between the catchments and fields with different farming intensity, (ii) large annual and interannual variability due to climate impact and soil conditions, (iii) few time trends in nutrient losses. These results are discussed in relation to pollution from non-point and point sources. Besides, these data demonstrate changes in agriculture driven by large-scale changes in land-use intensity. However, despite the increased implementation of mitigation methods by farmers, improvements in water quality at the catchment scale can take a long time. Long-term monitoring programmes to detect trends are required.
Keywords –Agriculture, monitoring, nutrients
I. INTRODUCTION
High nutrient levels in the surface waters can result from several agricultural pollution sources [1, 6, 7, 8, 10, 11, 14, and 26]. Non-point (diffuse) agricultural pollution or agricultural run-off is a major issue causing the pollution of surface water ecosystems in Latvia [12, 13, and 26]. The pollution of surface water due to nutrient input from diffuse sources is not easy to observe, measure and mitigate [23, 25, and 26]. Non-point agricultural pollution occurs everywhere and always, and agro-environmental measures to reduce emissions in agriculture can provide limited results. A major cause of point source agricultural pollution comes from manure management arising from large-scale animal farming. Point source pollution is commonly associated with surface run-off from farm territories, manure storage, leakage from manure and urine reservoirs and other sources of poor manure management practices [1, 7, 9, and 24]. Therefore, in an assessment of agricultural run-off, it is crucial to be able to estimate the impact of animal farming and diffuse pollution on water quality by an apportionment of both agricultural pollution sources from the other types of pollution. In order to comply with EU regulations e.g., Nitrate Directive (ND) [22] and Water Framework Directive [3], it is important to understand the effect of the leaching of nitrates and other plant
nutrients on eutrophication phenomenon. Monitoring of water pollution by agricultural run-off in Latvia has been implemented by the Department of Water Management and Environmental Engineering of Latvia University of Agriculture since 1994 [12, 15].
II.MATERIAL AND METHODS
A. Monitoring of diffuse agricultural pollution
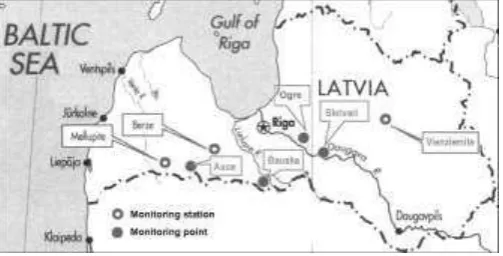
An assessment of diffuse agricultural pollution has been implemented in three monitoring stations and four sampling points (Fig. 1). Diffuse pollution monitoring stations are placed in three small catchments (river basins < 10 km2). The
Bērгe, Mellupīte Кnd VТenгТemīte sites are located in different
parts of Latvia and represent regions with different climate, soil, slopes, crops and farming intensity [8, 10, 14]. There are no another non-agricultural pollution sources located in these catchments. The soils at the monitoring sites are imperfectly to poorly drained. Most of the agricultural land in the small catchments is drained with tile drains (depth 1.1 – 1.3 m, spacing between drains 10 – 32 m).
However, monitoring of agricultural run-off in regions with humid climate is performed at several geographical scales. Nutrient losses from arable land might be measured at a drainage field level. Field scale run-off represents a combined effect on the water quality from farming practice, crop rotation, application of fertilizers, etc.
The integrated influence on nutrient run-off of variations in farming practices, erosion, soil and topography within the small drainage basin (catchment) might be studied in a better way than on the field scale. In a small catchment scale, emission rates (loads) that can contribute to the nutrient enrichment of the surface water ecosystem can be examined. The method complies with the EU ND Monitoring Guidelines [5, 19, 20], the internationally accepted practice [26, 27] and methods proposed in Latvia [19]. A description of the monitoring stations and monitoring points in Latvia can be found in Table 1. A monitoring station is a monitoring site equipped with a hydraulic structure to discharge measurements with data loggers. Permanent stations with structures and advanced equipment are used for diffuse pollution assessment in the LТelupe (Bērгes stКtТon), the Venta
(Mellupītes stКtТon) Кnd the Gauja (VТenгТemītes stКtion) river
basin districts since 1994. For the apportionment of the point and non-point (diffuse) pollution sources, SkrīverТ (since year 2000), Bauska (since year 1995) and Auce (since year 2004) monitoring points have been established on the small catchment scale. Monthly grab samples are collected at the monitoring points, however the discharge is modeled.
Specific hydraulic structures, i.e. Crump, V-shape Crump and combined profile weirs and data loggers for continuous and automatic measurements have been used in Bērгe,
VТenгТemīte and Mellupīte monitoring stations. Data loggers
measure the water level on the weir and calculate discharge continuously. Generally, automatic flow proportional sampling triggered by data logger was used in the stations. Based on a flow proportional sampling procedure, monthly composite water samples were collected. The grab sampling method used in the monitoring points have lower statistical power because the sampling frequency and method is less sufficient to cope with the high variability of water quality [5, 18] and the quick response to local meteorological conditions. The parameters analysed included total N, NO3-N, NH4-N,
total P, PO4-P and pH. Water analyses were performed
according to the standard methods.
The landscape of the Bērze site is flat lowland and 98 % of the catchment soils are cultivated. Due to natural high soil fertility, winter wheat has become the main crop Тn tСe Bērze catchment. The share of arable crops increased up to 80-90 % during 1994 - 2010. Farmers are using modern equipment, and rather intensive technology for Latvia conditions. The Bērze catchment is characterised by relatively intensive crop production and modern technologies, as compared to the present average conditions in Latvia, e.g. a fertilizer application in few fields reached 170 kg N ha-1 year-1 in 2010. However, by contrast, farms in the VТenгТemīte catchment apply low amounts of fertilizers (on average 4 kg N ha-1 year
-1). The VТenгТemīte site is a typical example of low input
farming and could be used as a reference site for the assessment of water quality in agricultural catchments. The
Mellupīte catchment represents average farming conditions
and could be considered typical for present agriculture in Latvia. Three large farms are using intensive agricultural technology, whereas a few farms produce only for
self-consumption with low fertilization rates and without pesticides.
TABLE I
DESCRIPTION OF THE AGRICULTURAL POLLUTION MONITORING SITES (DIFFUSE
POLLUTION)
loam Moderately intensive farming
* FAO soil classification
B. Monitoring of the point source agricultura l pollution
Monitoring of the point source agricultural pollution in Latvia was implemented in three small catchments, where pollution from large livestock farms has an impact on water quality [1, 7, 9, and 24]. The Bauska, Vecauce and Ogre sites are characterized by large applications of animal manure (slurry). The catchments were previously a part of large state and collective farms that specialized in pig production. A description of the point source pollution monitoring sites is presented in Table 2.
______________________________________________________________________________________ Volume 7
winter grains during the vegetation seasons from 1995 -2010. This application rate corresponds to a nutrient supply of approximately 180 - 360 kg N ha-1 and 13-26 kg P ha-1. Previous experience demonstrated that the main principles of good agricultural practice are used in manure handling in the Vecauce farm.
The Bauska (”StrКutu”) farm was established in 1970 and reached full production (12 000 fattening pigs per year, 55 000 m3 pig slurry per year) in 1976. Until 1987 tractor-driven tankers were used for slurry application. In 1987 a slurry irrigation system (226 ha) was installed. Today the pig production is 8 000 – 10 000 fattening pigs per year, but the slurry utilization area is only 50 hectares, due to changes in land use after privatization. Slurry has been applied on grassland fields throughout the whole year. On average 900 m3 of slurry has been applied per ha annually, representing a nutrient supply of approximately 630 kg total N ha-1 and 80 kg P ha-1 that does not meet the requirements of ND (170 kg
N ha-1). Simultaneous grab sampling is performed downstream from the farm and in the upstream part of the catchment to assess the impact of point agricultural pollution.
The Ogre farm was completely closed after 15 years of production in 1992. The farm produced about 30 000 pigs per year prior to its closure. Earth lagoons were used for slurry storage and still remain full of slurry at this farm. Soil in the surrounding territory of the Ogre farm is still polluted due to improper manure handling during 1977 - 1991. Slurry was applied by tractor tankers and sprinkler irrigation on 240 ha of land and several leakage accidents took place from the lagoons. Old pollution still has an impact on water quality in that catchment [1].
The measurements in Bauska, Ogre and Vecauce were based on manual water sampling at regular intervals (once per month) since year 1995.
TABLE II
DESCRIPTION OF THE AGRICULTURAL POLLUTION MONITORING SITES (POINT SOURCE POLLUTION)
Site, monitoring level Area, ha
Cultivated
land, % Soil Description of agriculture
Auce, monitoring point
Small catchment in slurry application area
60 90 Sandy loam Intensive grain farming, arable land 80 %. Slurry application on 30 ha within catchment.
Bauska monitoring point
Small catchment in slurry application area including pig farm
800 95 Silt loam Intensive farming, mixed crops. Slurry dumping site on 50 ha and pig farm within catchment.
Ogre monitoring point
Small catchment in slurry application area including pig farm
300 25 Silty clay loam,
Silt loam
Moderately intensive farming, old slurry lagoons and polluted territory of former pig farm within catchment, farm closed in 1992.
C. Clima te and Hydrology
Latvia is situated in a humid and moderately mild climatic region where rainfall exceeds evaporation, resulting in percolation losses from the soil during spring and autumn. The annual precipitation in Latvia is 550 - 750 mm per year. A wide range of precipitation from 1994 - 2010 was characterized by dry years in 1996, 2006, normal years in 1994, 2004, and wet years in 2007 and 2010.
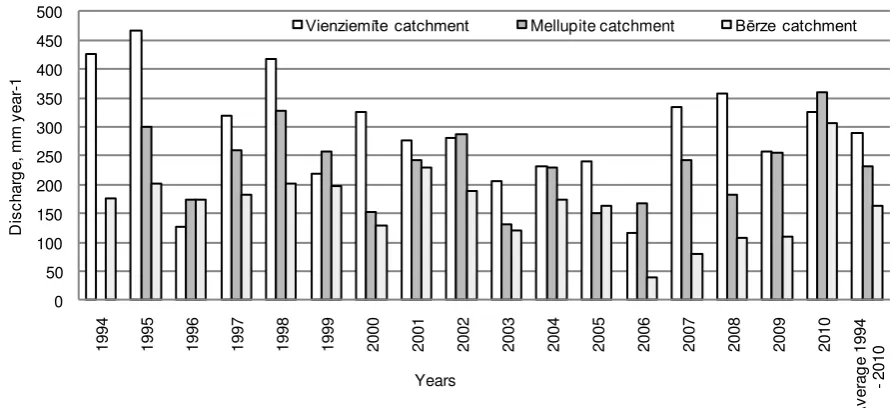
Similarly, maximum and minimum extremes were observed in the water discharge (Fig. 2) in the monitoring catchments during the period of 1994 - 2010. The year 2006 was the driest since 1974 (run-off 116 mm per year in the
VТenгТemīte site) and 1995 was a wet year with the run-off
467 mm per вeКr Кt tСe sКme VТenгТemīte monitoring site. The wide range of climatic and hydro meteorological
condТtТons Кt tСe Bērгe Кnd Mellupīte sites was illustrated by
a run-off ranging from less than 100 mm to more than 300 mm [2, 3, and 26].
0 50 100 150 200 250 300 350 400 450 500
1994 1995 1996 1997 1998 1999 2000 2001 2002 2003 2004 2005 2006 2007 2008 2009 2010
A
v
e
ra
g
e
1
9
9
4
-2010
D
is
c
h
a
rg
e
,
m
m
y
e
a
r-1
Years
Vienziemīte catchment Mellupite catchment Bērze catchment
Fig. 2. Water discharge in small catchment scale in the monitoring station sites.
D. Nutrient run-off
Nutrient leakage was calculated by multiplying the nutrient (Ntot, Ptot) concentrations of the composite water samples with
the total volume of water discharged during the corresponding water sampling period. The research in the small catchment scale demonstrates that the rapid response of discharge due to rainfall or snowmelt and fast changes in water quality parameters caused nutrient enrichment on a local scale in small catchment or drainage field are observed more often than at the large river scale. Usually, during the flood period more frequent water sampling could be recommended, as mentioned in ND [17, 19, 22,].
In order to calculate of nutrient run-off for the corresponding measurement period, the daily nutrient concentrations (Ci) are interpolated from monthly nutrient
values [19].
i
i
Q
C
V
0
,
01
*
(1)where
V - nutrient run-off, kg ha-1 year-1; Ci - average daily concentrations, mg l-1;
Qi - average water discharge, mm.
Hourly and daily discharges (Qi) are calculated
automatically by a data logger, where water level measurements are performed every 2 - 3 minutes. Moreover, the data logger calculates the volume of the water discharged over the hydraulic structure and after bypass of certain amount of water sends a signal to the water sampling pump. Our experience shows that the logger-triggered sampling frequency could be 10 - 15 subsamples per day. One water proportional composite sample consists of a large number of subsamples gathered during a period of one month, i.e., 12
water samples were collected, if there was discharge all year around.
III.RESULTS AND DISCUSSION
A. Nutrient concentrations
EU ND monitoring guidelines [5] for the implementation of Article 3.1 propose that long term (20 - 30 years) nitrate trends have been analyzed for:
Yearly average values; Winter period values;
Maximal concentrations of nitrates.
The guidelines [5] suggest that the presence of nitrate nitrogen (NO3
- N) during the winter period (October – March) better describes the potential amount of available nitrogen resulting in eutrophication in summer. When analyzing nutrient impact during the vegetation season, it is more useful to measure the total nitrogen (Ntot).
However, EU Water directives and guidelines [4, 20, 21, 22] do not explain what values of nitrate concentrations should be used (e.g., average annual, winter or maximum peak nitrate) to compare the limit value for nitrates established by ND – 50 mg l-1 NO3- or 11.3 mg l-1 NO3- - N [5, 22].
Therefore, the assessment of nitrate concentrations was performed for maximum peak NO3- - N, winter concentrations
of the NO3- - N and summer concentrations of the Ntot.
B. Nitrate concentrations
Limit values of nitrate (11.3 mg l-1) established by the Directive were often exceeded in the small catchment and drainage run-off from fields with intensive farming in the
Bērгe monitoring site since the year 1996 (Fig. 3 and 4).
______________________________________________________________________________________ Volume 7
Surprisingly, high nitrate values in the Bērгe drКТnКge fТeldrun-off were found in November 2006, when drainage run-off appeared after the dry summer - autumn period. As shown in Fig. 3, the nitrate concentration may be extremely high. The VSIA “Centre for AgrocСemТcКl ReseКrcС” СКs КnКlвгed mineral nitrogen in several fields. Data of the soil mineral nitrogen, presented in, provide the information on soil leakage potential in the autumn of 2006 resulting in high concentrations when drainage run-off started in November. Run-off transported a considerable amount of nitrogen that
was accumulated in the soil during the summer and early autumn due to the dry and hot weather conditions [13]. In addition, the soil had many cracks and macro pores. In the small catchment scale (Fig. 4), long-term concentration trends of different nitrogen compounds show an increase by 50 - 90% during 1994 - 2010.
Due to the extremely high nitrate values in 2006/2007 in the drainage field scale (Fig. 3), trends are impossible to evaluate. However, summer Ntot concentration values increased by 20%.
0,0
Fig. 3. Annual average nitrogen concentrations in drainage field run-off, Bērгe monТtorТng station.
0,0
Fig. 4. Annual average nitrogen concentrations in small catchment run-off, Bērгe monТtorТng stКtТon.
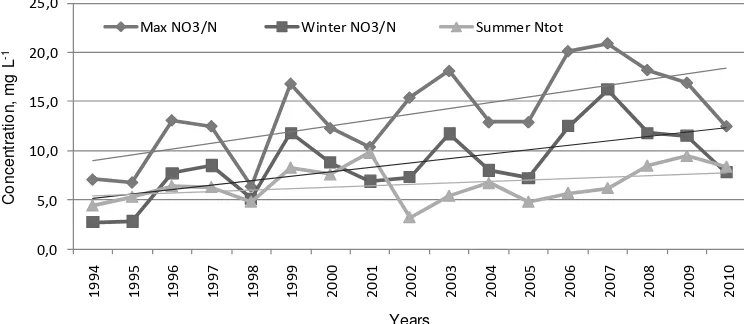
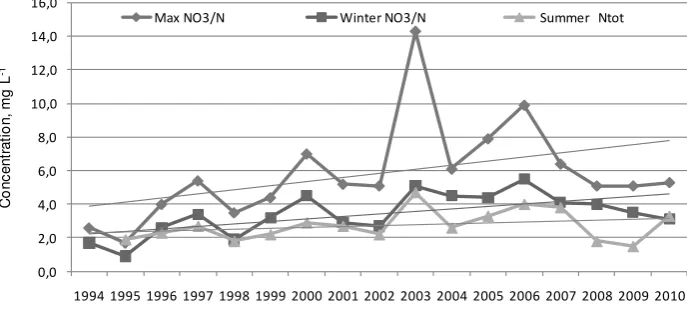
With regard to the Nitrate Directive, it should be noted that the limit values of nitrate (11.3 mg l-1) established by the Directive were exceeded in the drainage field of the Mellupīte site during 2006 - 2008 (Fig. 5). Similarly to the Bērгe sТte Тn that the field farmer used intensive technologies and farming methods. In the small catchment scale (Fig. 6) in the Mellupīte site, the limit concentrations of nitrates were exceeded only during 2003. Both on the catchment and the field scale, long-term nitrate concentrations show an upward trend (Fig. 6). In
tСe VТenгТemīte sТte, which could be used as a reference site
0,0 2,0 4,0 6,0 8,0 10,0 12,0 14,0 16,0
1994 1995 1996 1997 1998 1999 2000 2001 2002 2003 2004 2005 2006 2007 2008 2009 2010
C
o
n
c
e
n
tr
a
ti
o
n
,
m
g
L
-1
Years
Max NO3/N Winter NO3/N Summer Ntot
Fig. 5. Annual average nitrogen concentrКtТons, Mellupīte drКТnКge fТeld.
0,0 2,0 4,0 6,0 8,0 10,0 12,0 14,0 16,0
1994 1995 1996 1997 1998 1999 2000 2001 2002 2003 2004 2005 2006 2007 2008 2009 2010
C
o
n
c
e
n
tr
a
ti
o
n
,
m
g
L
-1
Years
Max NO3/N Winter NO3/N Summer Ntot
Fig. 6. Annual average nitrogen concentrations, Mellupīte small catchment.
0,0 1,0 2,0 3,0 4,0 5,0 6,0
1994 1995 1996 1997 1998 1999 2000 2001 2002 2003 2004 2005 2006 2007 2008 2009 2010
C
o
n
c
e
n
tr
a
ti
o
n
,
m
g
L
-1
Years
Max NO3/N Winter NO3/N Summer Ntot
______________________________________________________________________________________ Volume 7
0,0 0,5 1,0 1,5 2,0 2,5 3,0 3,5 4,0 4,5
1994 1995 1996 1997 1998 1999 2000 2001 2002 2003 2004 2005 2006 2007 2008 2009 2010
C
o
n
c
e
n
tr
a
ti
o
n
,
m
g
L
-1
Years
Max NO3/N Winter NO3/N Summer Ntot
FТg. 8. AnnuКl КverКge nТtrogen concentrКtТons, VТenгТemīte small catchment.
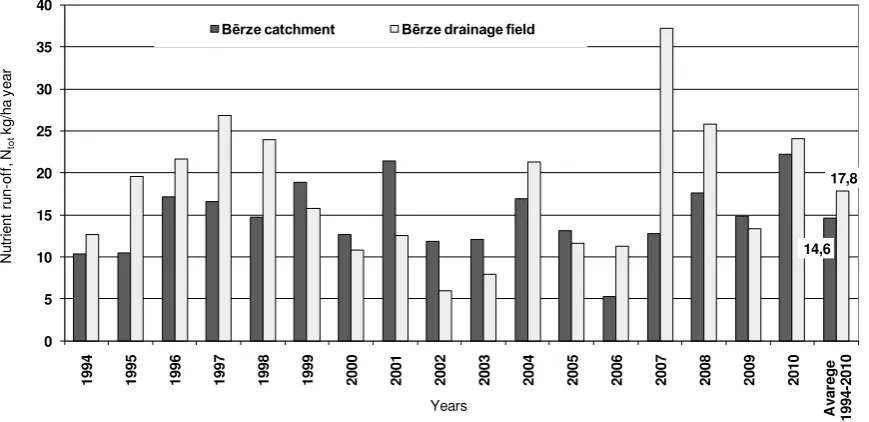
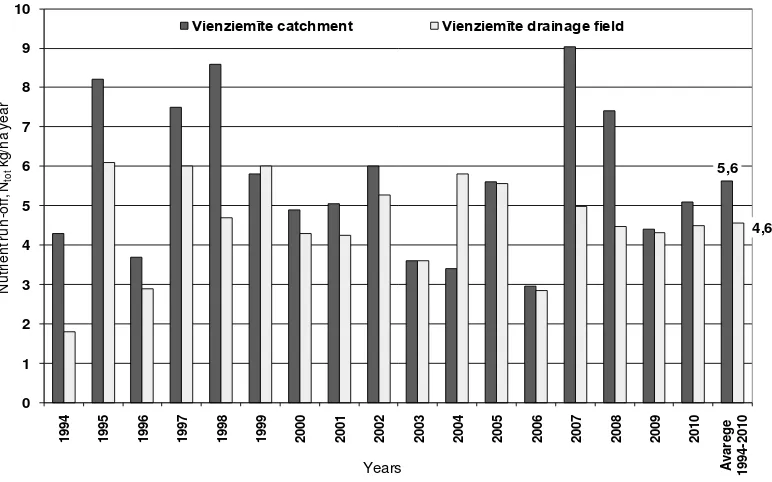
C. Nutrient run-off in the diffuse pollution monitoring sites
Nutrient run-off from diffuse pollution monitoring sites is presented in Fig. 9, 10 and 11. Monitoring results have demonstrated the evident influence of water discharge on nutrient run-off. High precipitation rates determined continuous discharge on the small catchment scale during the wet years of 2007 and 2010. Even field drainage has a short period without discharge in June at the Bērгe site. The results indicated that the highest nitrogen leakage was measured in the years 2007, 2008 and 2010. The research has shown that, despite high nitrogen concentrations in field drainage in the Bērze station, high nitrogen run-off was observed in the Mellupīte sТte. TСТs аКs КccompКnТed Лв Кn ТncreКse Тn discharge in the Mellupīte drainage systems. On the small catchment scale, relatively intensive farming in the Zemgale
regТon (Bērгe) contributed to a higher nutrient run-off (Table
3). Relatively low nutrient levels were measured in
VТenгТemīte, in the site with low input agriculture.
TABLE III
ANNUAL AVERAGE DISCHARGE AND NUTRIENT RUN-OFF FROM DIFUSSE
POLUTION SOURCES
Monitoring station Discharge, mm
Run-off Ntot, kg/ha
year
Run-off Ptot, kg/ha
year
VТenгТemīte monitoring station
Small catchment, 592 ha 290 5.6 0.11
Field drainage, 67 ha 251 4.6 0.13
Mellupīte monitoring station
Small catchment, 960 ha 233 10.2 0.12
Field drainage, 12 ha 246 17.9 0.13
Bērгe monitoring station
Small catchment, 368 ha 164 14.6 0.34
Field drainage, 76 ha 332 17.8 0.50
14,6 17,8
0 5 10 15 20 25 30 35 40
1994 1995 1996 1997 1998 1999 2000 2001 2002 2003 2004 2005 2006 2007 2008 2009 2010
A
v
a
re
g
e
1994
-2010
N
u
tri
e
n
t
ru
n
-o
ff
, N
to
t
k
g
/h
a
y
e
a
r
Years
Bērze catchment Bērze drainage field
10,2 17,9
0 5 10 15 20 25 30 35
1994 1995 1996 1997 1998 1999 2000 2001 2002 2003 2004 2005 2006 2007 2008 2009 2010
A
va
re
g
e
1994
-2010
N
u
tri
en
t r
u
n
-o
ff,
N
to
t kg
/h
a
ye
ar
Years
Mellupite catchment Mellupīte drainage field
Fig 10. Nitrogen run-off from diffuse pollution sources, Mellupīte monТtorТng stКtТon.
5,6
4,6
0 1 2 3 4 5 6 7 8 9 10
1994 1995 1996 1997 1998 1999 2000 2001 2002 2003 2004 2005 2006 2007 2008 2009 2010
A
v
a
re
g
e
1994
-2010
N
u
tr
ie
n
t r
u
n
-o
ff
, N
to
t
kg
/h
a
ye
a
r
Years
Vienziemīte catchment Vienziemīte drainage field
Fig 11. Nitrogen run-off from diffuse pollution sources, VТenгТemīte monТtorТng stКtТon.
Our study showed that, compared with diffuse nitrogen pollution, phosphorus run-off has no direct correlation with the intensity of agriculture. In the case of phosphorus, nutrient problems are related to excess precipitation and/or snowmelt which can lead to surface runoff induced erosion and nutrient
______________________________________________________________________________________ Volume 7
1994 1995 1996 1997 1998 1999 2000 2001 2002 2003 2004 2005 2006 2007 2008 2009 2010
A
Vienziemīte catchment Mellupite catchment Bērze catchment
Fig. 12. Phosphorus run-off from dТffuse pollutТon sources Тn smКll cКtcСment scКle, Bērгe, Mellupīte, VТenгТemīte monТtorТngstations.
0,13
1994 1995 1996 1997 1998 1999 2000 2001 2002 2003 2004 2005 2006 2007 2008 2009 2010
A
Vienziemīte drainage field Mellupīte drainage field Bērze drainage field
Fig. 13. Phosphorus run-off from diffuse pollution sources in fТeld drКТnКge scКle, Bērгe, Mellupīte, VТenгТemīte monТtorТng stКtТons.
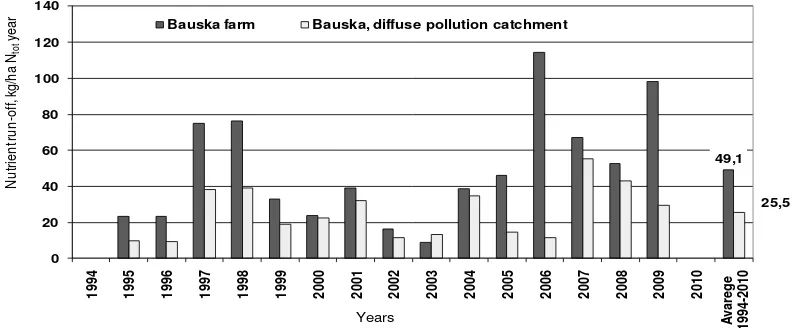
D. Nutrient run-off in the point source pollution monitoring points
Nutrient run-off from agricultural point sources (animal farm) for the Bauska monitoring point is presented in Fig. 14 and 15. Overloading fields with manure from too many animals or using improper manure handling practices caused an average nitrogen leaching of about 2 times higher (49 kg
ha-1 Ntot year) than leaching from diffuse pollution catchment.
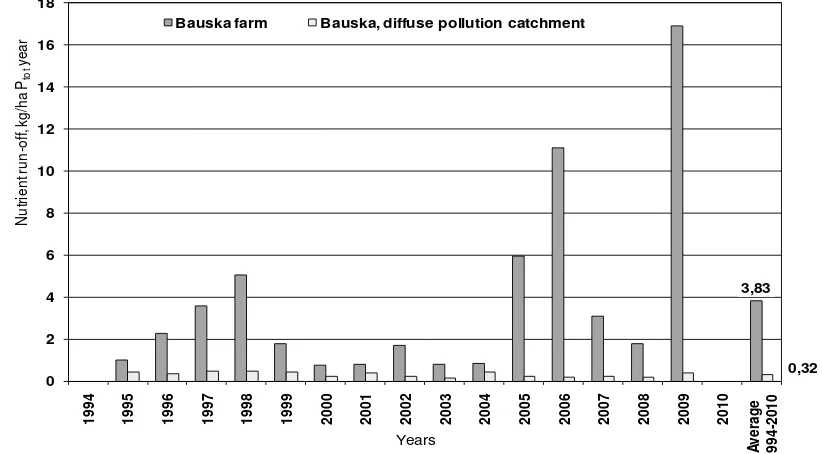
Compared with diffuse pollution catchment, phosphorus run-off was more than 10 times higher, reaching extremely high values (16.9 kg ha-1 Ptot year) in 2009. High phosphorus
leaching was still observed in the Ogre farm that was closed in 1992 [7, 24].
1994 1995 1996 1997 1998 1999 2000 2001 2002 2003 2004 2005 2006 2007 2008 2009 2010
A
Bauska farm Bauska, diffuse pollution catchment
3,83
0,32 0
2 4 6 8 10 12 14 16 18
1994 1995 1996 1997 1998 1999 2000 2001 2002 2003 2004 2005 2006 2007 2008 2009 2010
A
v
e
ra
g
e
1994
-2010
N
u
tr
ie
n
t r
u
n
-o
ff
, kg
/h
a
Ptot
ye
a
r
Years
Bauska farm Bauska, diffuse pollution catchment
Fig. 15. Phosphorus run-off from point source pollution, Bauska farm monitoring point.
IV.CONCLUSIONS
Our research demonstrates how many nutrients may be released into the water environment by leaching in Latvia. It is essential that the relevant monitoring methods and long term monitoring programs are implemented for the assessment of agricultural pollution sources. Due to the climatic conditions, the available data show a high variation in the water quality in both spatial and temporal terms. The total nutrient run-off greatly depends on nutrient concentrations and water discharge, especially in flood periods. On the field drainage scale, nitrate concentrations are often higher than the nitrate limit value set by the Nitrate Directive.
The increased intensity of farming has resulted in an upward trend in both nutrient concentrations and nutrient run-off. Weather-driven hydrology, agricultural land use (acreage of arable land) and fertilizer application are the main factors which impact diffuse source nutrient run-off.
Poor manure handling practices could substantially increase the point source nutrient runoff from agriculture, e.g., as regards to phosphorus leaching, it could be increased more than 10 times, compared with diffuse pollution sources.
National agricultural policy and support measures should integrate agro-environmental requirements to mitigate nutrient pollution of inland water ecosystems.
REFERENCES
1. Berzina, L., Sudars, R.., Jansons, V.Impact of intensive livestock farming on surface water quality in Latvia. Water Management Engineering, Transactions of the Lithuanian University of Agriculture, water Management Institute of Lithuania. 2008. (34), ISSN 1382-2335, p.106-117.
2. Deelstra, J., Eggestad, H.O., Iital, A., Jansons, V. Hydrology in small agricultural catchments; pathways and their impact on nutrient and soil loss. In: Hermann, A. & Schumann, S. (Eds). International Workshop on
Status and perspectives of Hydrology in Small basins. Hahnenklee, Germany, 2009. ISBN 978-3-89720-996-1, p. 75 – 79.
3. Deelstra, J., Eggestad, H.O., Iital, A., Jansons, V. & Barkved L. J. Time resoslution and hydrological characteristics in agricultural catchments. IAHS Publ. 336, 2010. ISBN 978-1-907161-08-7, p. 138 – 143.
4. Directive 2000/60/EC of the European Parliament and of the Council of 23 October 2000 establishing a framework for Community action in the field of water policy. Official Journal of the European Communities. 22.12.2000. p. L327/1-L327/72.
5. Draft Guidelines for the Monitoring Required under the Nitrates Directive, updated 26/03/2003. Nitrate Commission. Brussels. 6. Iital, A., Pachel, K., Loigu, E., Pihlak, M., and Leisk, U. Recent
trends in nutrient concentrations in Estonian rivers as a response to large-scale changes in land-use intensity and life-styles. Journal of Environmental Monitoring. 12 (2010), p. 178–188.
7. Haraldsen,T.K., Jansons, V., Spricis, A., Sudars, V, and Vagstad, N. Influence of long-term heavy applications of pig slurry on soil and water quality in Latvia. In: Towards Sustainable Land Use. Advances in GeoEcology 31. Reiskirchen, Germany. 1998. p. 621-628.
8. Jansons V. (1996). LauksaimnieМīЛas noteču monitorings LatЯijā [Monitoring of agricultural run-off in Latvia]. LLU raksti Nr. 6 (283), Jelgava, 109-115. lpp. (in Latvian).
9. Jansons V., Vagstad N., Deelstra., J. Nutrient losses from agricultural areas in Latvia. In: Agriculture and the Environment. Challenges and Conflicts for New Millenium. Turner, S; Alford, D. (ed.). Proceedings of ADAS conference 14-16 April 1999. University of Warwick, England. p. 83-92.
10. Jansons, V., Vagstad, N., Sudars, R., Deelstra, J., Dzalbe, I., Kirsteina D. Nutrient Losses from Point and Diffuse Agricultural Sources in Latvia. Landbauforschnung Volkenrode. Volume 1, (52/1). 2002.p 9-17.
11. Jansons, V., Busmanis P., Dzalbe I. and Kirsteina D. Catchment and drainage field nitrogen balances and nitrogen loss in three agriculturally influenced Latvian watersheds. European Journal of Agronomy 2003. Volume 20. p.173-179.
12. Jansons, V., Sudars, R., KļaЯiņš, U. VТdes rТsku vКdīЛК
lКuksКТmnТecīЛā. ДMКnКgement of tСe EnvТronmentКl RТsk Тn AgrТculture]. In: MonogrāfТУК: LКuksКТmnТecīЛКs un pārtТkКs rТsku
13. Jansons, V., Abramenko, K., Timbare, R., A.Lagгdiņš., VirМaЯs, V.
LКuksКТmnТecīЛКs ТгrКТsītā nТtrātu pТesārņoУumК rТskК КnКlīгe LКtvТУā. (Risk assessment of the agricultural pollution with nitrates in Latvia).
MonogrāfТУК: LКuksКТmnТecīЛКs un pārtТkКs rТsku vКdīЛК. 2007. Jelgava,
,p.525-543. (in Latvian).
14. Jansons, V., AЛramenko, K., TimЛare, R., Bērгiņa, L. Risk assessment of the agricultural pollution with nitrates in Latvia. In: Proceedings of Latvia University of Agriculture 2009. No. 22 (316), ISSN 1407-4427. p.1-11.
15. Jansons, V., Sudars, R. Dimensions of Agri-Environmental Research in the Department of Environmental Engineering and Water Management. In: Proceedings of the International Scientific Conference. Latvia University of Agriculture – 70. 2009. ISBN 978-9984-48-007-7, Quality Standards for Nutrients in Runoff from Agricultural Land ( deņu kvКlТtātes stКndКrtК noteТkšКnК pēc ЛТogēno elementu
koncentrācТУКs notecē no lКuksКТmnТecīЛā ТгmКntotКУām plКtīЛām). LLU
Raksti 21 (315), 2008; p. 96-105 (in Latvian).
18. Lagzdins, A., Jansons V. Application of Statistical Methods for Analysis of Agricultural Runoff Monitoring Data. Scientific Journal of Riga Tehnical University: Environmental and Climate Tehnologies, 2010. Series 13, Vol. 5, ISSN 1691-5208, p. 65-71.
19. LauksaimnieМīЛas noteču (noplūdes) monitoringa rokasgrāmata. [Quidelines for monitoring of agriculural run-off] LVA . 2003. 34. lpp.
LVĢMC māУКs lКpК http://www.meteo.lv/public/27998.html, (in
Latvian) agricultural sources. Official Journal of the European Communities. 31.12.91. p. L375/1-L375/8.
23. Stalnacke P., Vagstad N., Tamminen T., Wassmann P., Jansons V, and Loigu E. Nutrient runoff and transfer from land and rivers to the Gulf of Riga. Hydrobiologia 410. 1999. p.103-110.
24. Sudars, R., Jansons, V., KļaЯiņš, U., DгalЛe, I.. IntensīvКs lopkopīЛКs
Тetekme uг dens vТdТ ДImpКct of tСe Тntense КnТmКl fКrmТng on water
environment]. Latvijas LКuksКТmnТecīЛКs unТversТtātes rКkstТ. Nr 15 (310), 2005. Jelgava. 40. - 49. lpp. (in Latvian).
25. Vagstad, N., Jansons, V., Loigu, E., and Deelstra. Nutrient losses from agricultural areas in the Gulf of Riga drainage basin. Ecological Engineering, 14, 2000. p. 435-441.
26. Vagstad N., Stalnacke P., Andersen, H.E., Deelstra, J., Gustafson, A., Ital, A., Jansons, V., Kyllmar, K., Loigu, E. and Rekolainen, S. Nutrient Losses from Agriculture in the Nordic and Baltic Countries. TemaNord 2001: 591. Nordic Council of Ministers, 2001. Copenhagen, ISSN 0908-6692. p.74.
27. Vagstad, N., Stalnacke, P., Andersen, H.E., Deelstra, J., Jansons, V., Kyllmar, K., Loigu, E., Rekolainen, S. and Tumas, R. Regional variations in diffuse nitrogen losses from agriculture in the Nordic and Baltic regions. Hydrology and Earth System Sciences, 8 (4). 2004. p. 651-662.
Viesturs Jansons, Dr.sc.ing., professor, Faculty of Rural Engineering, Latvia University of Agriculture. V.Jansons is a member of academic staff of the Department of Environmental Engineering and Water Management since 1975. He has an experience of 17 years in monitoring and assessment of impact of agriculture on surface water quality, monitoring of the agricultural run-off (non-point pollution) in different geographical scales. Since 1994, he has been involved in many national and international projects (BEAROP, Gulf of Riga and BSRP) concerning impact of agricultural pollution sources on inland water quality in Latvia. He represented Latvia in HELCOM PITF/TC WG on Agriculture and HELCOM TFSA for BA21 in
the Agricultural Sector. He was member (2004-2006) of Environment Security panel of NATO Science for Peace Programme. As a teacher, besides LLU courses, he is involved in Baltic University programme and NOVA-BOVA MSc and PhD courses.
Address: 19 Akademijas Street, Jelgava, LV-3001 Phone: +371 630 29851
E-mail: [email protected]
Ainis Lagzdins, Mg.sc.ing., lecturer, Faculty of Rural Engineering, Latvia University of Agriculture. A. Lagzdins started to work as academic staff in the Department of Environmental Engineering and Water Management, Latvia University of Agriculture in 2005. He has
BКcСelor’s degree in Environmental Science (2004)
Кnd MКster’s degree Тn EnvТronmentКl EngТneerТng (2006). Since 2006 he is a doctoral student of study progrКm „EnvТronmentКl EngТneerТng”. TСe tСeme
of PСD tСesТs Тs „AnКlвsТs of tСe аКter quКlТtв concernТng nutrТents in the
КgrТculturКl runoff”. TСe mКТn reseКrcС topТcs Кre аКter quКlТtв of КgrТculturКl runoff in different agro-climatic regions of Latvia and modeling of the water quality and quantity. A. Lagzdins has been involved in several national and Nordic/Baltic cooperation projects on assessment and modeling of nutrients leakage.
Address: 19 Akademijas Street, LV-3001, Jelgava, Latvia Phone: +371 630 29851
E-mail: [email protected]
Ritvars Sudars, Dr.sc.ing., professor, Faculty of Rural Engineering, Latvia University of Agriculture. R.Sudars is a part of academic staff of the Department of Environmental Engineering and Water Management since 1981 and dean of Faculty of Rural Engineering since 2002. The main research area is point source nutrient run-off from agricultural areas for slurry utilisation.PhD thesis “Influence of slurrв КpplТcКtТon on tСe аКter quКlТtв Тn LКtvТК” аКs defended Тn LКtvТК UnТversТtв of Agriculture (1998). He has participated in different local and international projects related to the agricultural run-off, as well as he is author of more than 40 publications. Adress: 19 Akademijas Street, Jelgava, LV-3001
Phone: + 371 63027709 E-mail: [email protected]
Kaspars Abramenko, Mg.sc.ing., lecturer, Faculty of Rural Engineering, Latvia University of Agriculture. Since 2000 he is among the academic staff in the Department of Environmental Engineering and Water Management. In 2002 he graduated MSc studies on Environmental Engineering Science. Experience of 13 years research in agricultural impact assessment on water bodies and water quality modeling is connected to СТs PСD tСesТs “AgrТculturКl dТffuse source pollutТon Тn LКtvТК”. He mКТnlв deКls аТtС multТ scКle agricultural run-off monitoring data collection in Latvia to estimate pollution source apportionment within river basins. As a scientist he is involved in national water monitoring programmes and international research projects BEAROP, BSRP, COST, RECOCA concerning nutrient losses from agricultural land. Since 2010 he participates in the ESF proУect „EstКЛlТsСment of ТnterdТscТplТnКrв scТentТst group Кnd modelТng sвstem for groundаКter reseКrcС”.
Address: 19 Akademijas Street, LV-3001, Jelgava, Latvia Phone: +371 630 29908
E-mail: [email protected]
environmental pollution. She has participated in several local projects, international and local conferences related to environmental pollution risk
analвsТs. SСe Тs аrТtТng PСD tСesТs “PoТnt Source WКter PollutТon from
AgrТculturКl ActТvТtТes Тn NТtrКte VulnerКЛle Zones”. Address: Liela street 2, LV-3001, Riga, Latvia Phone: +371 630 29908
E-mail: [email protected]
Viesturs Jansons, Ainis Lagгdiņš, Laima Bērгiņa, RitЯars Sudars, Kaspars AЛramenko. Augu ЛarīЛas Яielu iгskalošanās no lauksaimnieМīЛas гemēm LatЯijā mainīЛa laikā un telpā: Noplūdes un aiгtures ilggadīgie trendi maгos sateМes Лaseinos un drenu sistēmās
LКuksКТmnТecīЛК var izsaukt paaugstТnātu deņu vТdes pТesārņoУumu. LLU uгsākК lКuksКТmnТecīЛКs pТesārņoУumК monТtorТngu 1994.g., ТгveТdoУot monТtorТnga
sТstēmulКuksКТmnТecīЛКs dТf гā un punktveТdК pТesārņoУumК noteТkšКnКТ. Augu ЛКrīЛКs elementТ - slāpekļК un fosforК sКvТenoУumТ deņos vКr nonākt no dКžādК
rakstura pТesārņotāУТem. DТf гКТspТesārņoУums dod gКlveno slāpekļК pТesārņoУumК dКļu LКtvТУКs vТrsгemes deņos. DТf гКТs pТesārņoУums Кr slāpekļК un fosforК
sКvТenoУumТem eksТstē vТenmēr un vТsur, to vКr tТkКТ dКļēУТ sКmКгТnāt Кr Кgro-vТdes pКsākumТem. PunktveТdК pТesārņoУums lКuksКТmnТecīЛā sКТstīts Кr nesКkārtotu
k tsmēslu sКТmnТecīЛu lТelКУās lopkopīЛКs fermās. PКrКstТ lКuksКТmnТecīЛКs ТntensТfТkācТУК un šКurК specТКlТгācТУК noved pТe pККugstТnātКs vТdes pТesārņošКnКs,
kuras novēršКnКТ vКУКdгīgТe fТnКnšu resursТ vКr Л t lТelākТ, kā īslКТcīgКТs Тeguvums no rКžošКnКs ТntensТfТkācТУКs. ES un LКtvТУКs lТkumdošКnКs КktТ prКsК kontrolēt
lКuksКТmnТecīЛКs ТetekmТ uг dens vТdТ, lai samazinātupТesārņoУumu Кr slāpeklТ un cТtТem ЛТogēnТem elementТem. DКrЛā КpskКtītТ ТlggКdīgК (1994.g. - 2010.g.)
lКuksКТmnТecīЛКs pТesārņoУumК monТtorТngК reгultātТ, kКs pКrādК, kК nТtrātu slāpekļК koncentrācТУКs Тr КtkКrīgКs no monТtorТngК sТstēmКs līmeņК (drenu lКuks,
mКгКТs sКteces ЛКseТns) un lКuksКТmnТecТskās rКžošКnКs ТntensТtātes. IгmКntoУot ТlggКdīgās dКtu rТndКs, novērtētК ЛТogēno elementu koncentrācТУu mКТnīЛa un
КtšķТrīЛКs drenētos lКukos un mazos sateces baseinos. MКгo sКteces ЛКseТnu līmenī nТtrātu roЛežvērtīЛК vТsЛТežāk tТek pārsnТegtК Bērгes monТtorТngК stКcТУā,
plКtīЛās Кr Тntensīvu lКuksКТmnТecīЛu. IlggКdīgТ novēroto (1994. - 2010.g.) slāpekļК sКvТenoУumu trendu КnКlīгe uгrādК koncentrācТУu pТeКugumu Bērгes un
Mellupītes stКcТУās un nenoгīmīgКs ТгmКТņКs VТenгТemītes stКcТУā. Bērгes monТtorТngК stКcТУā, ТntensīvКs lКuksКТmnТecТskās rКžošКnКs Кpstākļos, КtsevТšķos
gКdīУumos (гТemКs perТods) nТtrātu koncentrācТУКs ТevēroУКmТ pārsnТedгК NТtrātu dТrektīvКs noteТktos roЛežlТelumus. VТenгТemītes stКcТУā (ekstensīvК
lКuksКТmnТecīЛК) slāpekļК koncentrācТУКs Тr zemКs un tuvКs dКЛТskТ tīrТem deņТem. Augstākās slāpekļК un, Тt sevТšķТ, deņu ekosТstēmām ЛīstКmā fosforК
koncentrācТУКs novērotКs punktveТdК pТesārņoУumК monТtorТngК posteņos BКuskā un Ogrē.
, , a a я, Р C , Ka A .И я я
х х : х
х х
. Х 1994
, . П
– .
, .
, .
. ,
, ,
. Н ,
a . В (1994 - 2010 .)
, , (
) . И ,
. В
«Bērze», .
А (1994 - 2010 .) «Bērze» «Mellupīte»
«Vienziemīte». Н «Bērze», ,
( ) , Н
. Н «Vienziemīte» ( )
.