FUSION OF LANDSAT- 8 THERMAL INFRARED AND VISIBLE BANDS WITH
MULTI-RESOLUTION ANALYSIS CONTOURLET METHODS
F. Farhanja, M.Akhoondzadehb
School of Surveying and Geospatial Engineering, College of Engineering, University M.Sc. Student, Remote Sensing Department,
a
of Tehran, North Amirabad Ave., Tehran, Iran - [email protected]
ege of Engineering, Assistant Professor, Remote Sensing Department, School of Surveying and Geospatial Engineering, Coll
b
University of Tehran, North Amirabad Ave., Tehran, Iran - [email protected]
KEY WORDS: Fusion, Contourlet, Non-subsampled Contourlet, Sharp Frequency Localization Contourlet, Feature Mutual Information, Land Surface Temperature.
ABSTRACT:
Land surface temperature image is an important product in many lithosphere and atmosphere applications. This image is retrieved from the thermal infrared bands. These bands have lower spatial resolution than the visible and near infrared data. Therefore, the details of temperature variation can't be clearly identified in land surface temperature images. The aim of this study is to enhance spatial information in thermal infrared bands. Image fusion is one of the efficient methods that are employed to enhance spatial resolution of the thermal bands by fusing these data with high spatial resolution visible bands. Multi-resolution analysis is an effective pixel level image fusion approach. In this paper, we use contourlet, non-subsampled contourlet and sharp frequency localization contourlet transform in fusion due to their advantages, high directionality and anisotropy. The absolute average difference and RMSE values show that with small distortion in the thermal content, the spatial information of the thermal infrared and the land surface temperature images is enhanced.
1. INTRODUCTION
Thermal infrared (TIR) bands are used to retrieve land surface temperature (LST) images. LST is the thermodynamic temperature of the uppermost layer of the earth’s surface. It depends on the albedo, the vegetation cover and different types of land covers (Kumar et al., 2013). Thermal infrared bands are important data in climate research, weather forecast, hydrologic, ecological, urban climate, agricultural, geothermal and many other studies (Jin and Han, 2017).
The thermal infrared bands have relatively lower spatial resolution than the visible (VIS) bands. Clarity and sharpness of the objects in TIR bands can be enhanced by fusing these data with high spatial resolution bands e.g., visible and panchromatic images (Liao et al., 2015). Spatial enhancement in TIR bands can help us to identify the detailed variations of LST, more accurately (Wang et al., 2014).
The objective of this paper is spatial enhancement in the TIR bands with the minimum possible distortion in thermal characteristics of these images.
Many methods have been proposed in image fusion. It can be categorized into following three levels: pixels, features and decision levels. In this paper, pixel level image fusion is applied. Multi-resolution analysis is part of transform domain methods in pixel level image fusion, including discrete wavelet (DWT), curvelet (CVT), contourlet (CT), nonsubsampled contourlet (NSCT) and sharp frequency localization contourlet transforms (SFLCT) (Li et al., 2010).
Jin and Han (2017) fused Landsat 7 panchromatic and thermal infrared images. They did this using sparse representation technique. According to Landsat spectral response, a sparse representation relation between low and high resolution images was created. They concluded that their method improved spatial
resolution and preserved the thermal properties of LST image (Jin and Han, 2017). Li et al. (2010) compared curvelet and contourlet methods in image fusion. They merged three categories of images: multi-focus, infrared-visible and medical images. They concluded that the shift invariant property is important for image fusion. The experimental results indicated that the nonsubsampled contourlet transform outperformed the existing methods (Li et al., 2010).
Wavelet transforms are not optimal in detecting the smoothness along curves and edges, which these are found a lot in remote sensing images such as roads and smooth boundaries of the objects (Choi et al., 2013). Therefore we utilize and compare the three latest developed MRA techniques, contourlet, nonsubsampled contourlet and sharp frequency localization contourlet transforms, which they have not wavelet disadvantages.
2. METHODOLOGY
2.1 Pre-processing
First of all, the TIR and the VIS bands should be registered together. Then, we convert digital numbers of these data to top of atmosphere radiance values. Surface leaving radiances for TIR bands can be calculated using atmospheric correction parameters and emissivity values of the surface by equation 1
Ld = downwelling or sky radiance
τ, Lu and Ld are atmospheric parameters computed by atmospheric profiles. The ε values are estimated by normalized difference vegetation index (NDVI). These values are defined by equation 2 (Mobasheri and Amani, 2016).
{ to multi-scale decomposition and directional filter bank (DFB) is used to multi-direction decomposition. Because of downsampling in the multi-scale stage in the CT, this transform is not shift invariant and exhibits spatial distortions, ringing and aliasing effects in the fusion results (Aiazzi et al., 2004). The nonsubsampled contourlet transform is shift invariant version of contourlet transform used two channel nonsubsampled 2-D filter banks in multi-scale and multi-directional levels. The filters used in DFB stage are not ideal and exhibit aliasing components at locations far away from desired support frequency regions. The mentioned drawback is solved by sharp frequency localization version of CT. In this transform, a new pyramidal structure is used for the multi-scale decomposition (Choi et al., 2013).
2.3 Coefficient Combination
The results of mentioned transforms applied on the input TIR and the VIS bands contain a low frequency component and multiple detail coefficients at different scales. In this paper, we choose the low frequency components of fused image from TIR approximation coefficients, so that the characteristics of thermal information are kept. The high frequency coefficients are chosen from either TIR or VIS components by comparing the local energy computed in 5×5 window.
2.4 Spectral and Spatial Quality Assessment
Absolute average difference (AAD) and non-reference image fusion metric based on mutual information of image features, which is called feature mutual information (FMI) are used for spectral and spatial quality assessment, respectively (Alparone et al., 2008) (Haghighat et al., 2011).
2.5 Retrieval of Land Surface Temperature
We retrieve LST from standard and sharpened TIR bands and then compared their results by root mean square error (RMSE), Mean Bias (MB) and R-squared values. LST can be computed
Where T= land surface temperature in kelvin
k and k = plank constants (k =774.89, k =1321.08 resolution of 100 m. The tested data was acquired on 29 March 2013 from 166/038 (path/row) in the world refrence system-2 (WRS-2). The test data covers Ilam in southwest of Iran. We selected 512×512 pixels of TIR band 10 and VIS band 4 (red) Landsat-8. These images are presented in Figure 1.
(a) (b)
Figure 1. (a) VIS band 4, (b) TIR band 10
4. RESULTS AND DISCUSSION
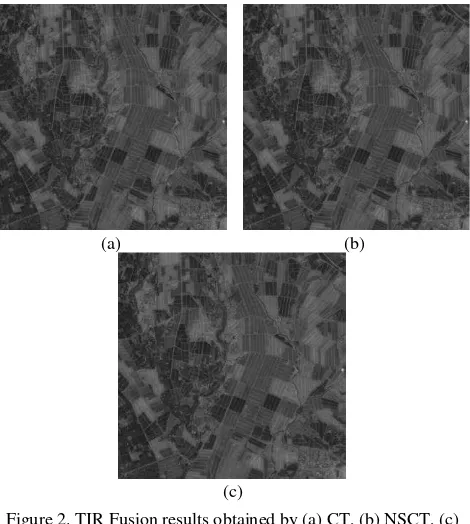
Three variants of contourlet methods are carried out with [2,3,3,4] parameter decomposition levels. The Cohen-Daubechies-Feauveau 9/7 and pkva filters are used as pyramidal and directional decomposition filters, respectively. The fusion results obtained by CT, NSCT and SFLCT are given in Figure 2.
(a) (b)
(c)
Figure 2. TIR Fusion results obtained by (a) CT, (b) NSCT, (c) SFLCT
better spatial observations and SFLCT preserves better thermal information.
Indexes/Methods CT NSCT SFLCT
AAD 0.2522 0.2441 0.2370
FMI 0.7754 0.7761 0.7738
Table 1. Spectral and spatial quality assessment
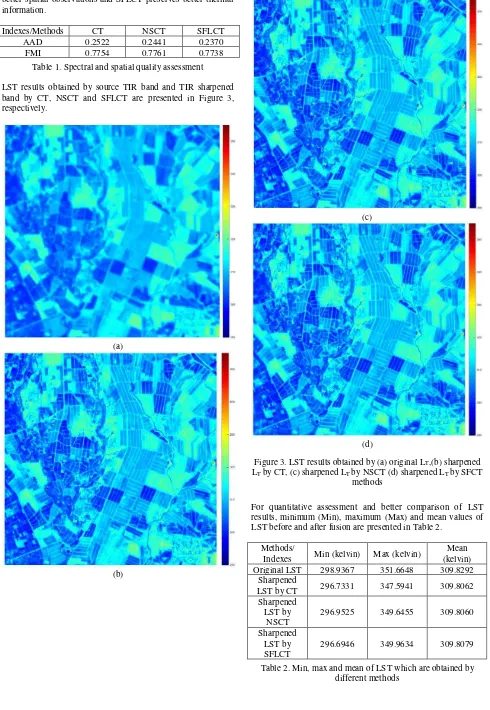
LST results obtained by source TIR band and TIR sharpened band by CT, NSCT and SFLCT are presented in Figure 3, respectively.
(a)
(b)
(c)
(d)
Figure 3. LST results obtained by (a) original LT,(b) sharpened LT by CT, (c) sharpened LT by NSCT (d) sharpened LT by SFCT
methods
For quantitative assessment and better comparison of LST results, minimum (Min), maximum (Max) and mean values of LST before and after fusion are presented in Table 2.
Methods/
Indexes Min (kelvin) Max (kelvin)
Mean (kelvin) Original LST 298.9367 351.6648 309.8292
Sharpened
LST by CT 296.7331 347.5941 309.8062 Sharpened
LST by NSCT
296.9525 349.6455 309.8060
Sharpened LST by SFLCT
296.6946 349.9634 309.8079
The MB, RMSE and R-squared indexes between original and sharpened values of LST are given in Table 3.
Methods/
R-Squared 0.78553 0.79725 0.80631
Table 3. MB and RMSE calculated between original and sharpened LST
From Table 2 and 3, we can conclude that spatial enhancement in TIR bands using SFLCT method leads to less discrepancy in thermal contents of LST than the other methods.
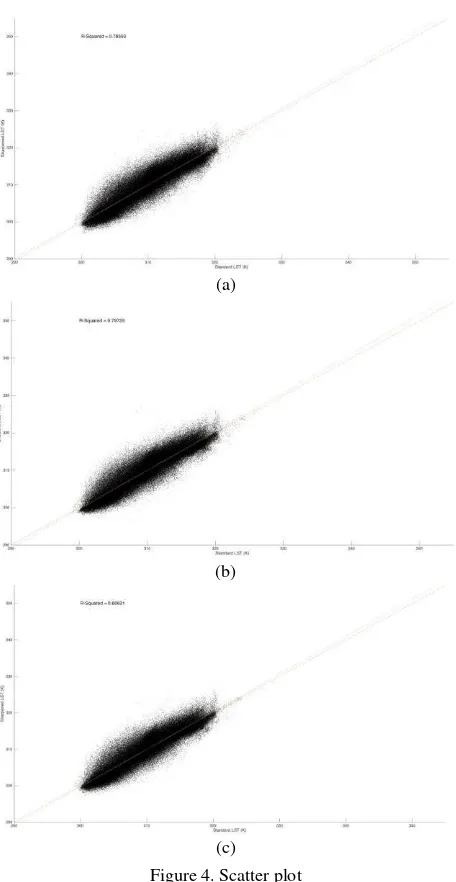
For additional comparison of original (standard) and sharpened values of LST, scatter plots between these values are presented in Figure 4. As we see that in Figure 4 (c), the gain of plot obtained by SFLCT is closer to 1 than the others.
(a)
(b)
(c)
Figure 4. Scatter plot
5. CONCLUSIONS
The thermal infrared bands have relatively lower spatial resolution than the VIS bands. Because of the importance of TIR bands in many applications specially retrieving land surface temperature, we attempted to fuse these data with VIS bands. CT, NSCT and SFLCT are utilized for fusion of VIS band 4 and TIR band 10 of Landsat-8. The experimental results indicate that the SFLCT preserves better thermal characteristics in TIR fused band and keeps more surface temperature properties in LST sharpened, while NSCT transforms more spatial details to the fused band and improves better object observability in LST image. Analysing the other filters in pyramidal and directional decompositions and the other fusion rules are suggested in future work.
REFERENCES
Aiazzi, B., Alparone, L., Baronti, S., Garzelli, A., Nencini, F., & Selva, M. (2004). Spectral information extraction by means of MS+ PAN fusion. Proceedings of ESA-EUSC, 20-1.
Alparone, L., Aiazzi, B., Baronti, S., Garzelli, A., Nencini, F., & Selva, M. (2008). Multispectral and panchromatic data fusion assessment without reference. Photogrammetric Engineering & Remote Sensing, 74(2), 193-200.
Barsi, J. A., Schott, J. R., Palluconi, F. D., & Hook, S. J. (2005, August). Validation of a web-based atmospheric correction tool for single thermal band instruments. In Optics & Photonics 2005 (pp. 58820E-58820E). International Society for Optics and Photonics.
Chen, Yanfei, and Nong Sang. (2015). "Attention-based hierarchical fusion of visible and infrared images." Optik-International Journal for Light and Electron Optics 126.23: 4243-4248.
Haghighat, M. B. A., Aghagolzadeh, A., & Seyedarabi, H. (2011). A non-reference image fusion metric based on mutual information of image features. Computers & Electrical Engineering, 37(5), 744-756.
Jin, H. S., & Han, D. (2017). Multisensor Fusion of Landsat Images for High-Resolution Thermal Infrared Images Using Sparse Representations. Mathematical Problems in Engineering, 2017.
Li, Shutao, Bin Yang, and Jianwen Hu. (2011). "Performance comparison of different multi-resolution transforms for image fusion." Information Fusion 12.2: 74-84.
Liao, W., Huang, X., Van Coillie, F., Gautama, S., Pižurica, A., Philips, W., Liu, H., Zhu, T., Shimoni, M., Moser, G. and Tuia, D., (2015). Processing of multiresolution thermal hyperspectral and digital color data: Outcome of the 2014 IEEE GRSS data fusion contest. IEEE Journal of Selected Topics in Applied Earth Observations and Remote Sensing, 8(6), pp.2984-2996.
Mobasheri, M. R., & Amani, M. (2016). Soil moisture content assessment based on Landsat 8 red, near-infrared, and thermal channels. Journal of Applied Remote Sensing, 10(2), 026011-026011.


