DOI 10.1007/s10640-007-9091-x
Carbon leakage revisited: unilateral climate policy
with directed technical change
Corrado Di Maria · Edwin van der Werf
Received: 13 January 2006 / Accepted: 9 February 2007 / Published online: 27 March 2007 © Springer Science+Business Media B.V. 2007
Abstract Using a stylized theoretical model, we argue that current economic anal-yses of climate policy tend to over-estimate the degree of carbon leakage, as they abstract from the effects of induced technological change. We analyse carbon leak-age in a two-country model with directed technical change, where only one of the countries enforces an exogenous cap on emissions. Climate policy induces changes in relative prices, that cause carbon leakage through aterms-of-trade effect. However, these changes in relative prices also affect the incentives to innovate in different sec-tors. This leads to a counterbalancinginduced-technology effect, which always reduces carbon leakage. We therefore conclude that the leakage rates reported in the liter-ature may be too high, as these estimates neglect the effect of price changes on the incentives to innovate.
Keywords Climate Policy ·Carbon Leakage · Directed Technical Change ·
International Trade.
JEL Classification F18·O33·Q54·Q55
1 Introduction
An important threat to climate policy is that actions undertaken without universal participation may prove to be ineffective: any partial agreement to reduce emissions, of carbon dioxide (CO2) for example, may be undermined by the behaviour of coun-tries outside the agreement. Indeed, increases in CO2 emissions by unconstrained
C. Di Maria (
B
)University College Dublin, Richview, Clonskeagh, Dublin 14, Ireland e-mail: [email protected]
E. van der Werf
countries can off-set the reductions secured by the agreement participants, a phenom-enon known ascarbon leakage.1
The behaviour of unconstrained countries in reaction to a reduction of CO2 emis-sions of other countries is mainly driven by two economic mechanisms. First, when the production of energy-intensive goods is reduced in constrained countries due to the introduction of an emission constraint, the international prices of such goods will increase. This gives countries outside the abating coalition incentives to expand their production of these goods and export them to signatory countries (theterms-of-trade
effect). Clearly, this implies an increase in emissions by countries outside the agree-ment. The second mechanism of carbon leakage works through the price of fossil fuels: as the price of fossil fuels decreases following the reduction in demand on the part of the constrained countries, countries outside the agreement might decide to substitute other inputs with fossil fuels, thus increasing their emissions (the energy-marketeffect).
In sum, climate change policy affects the relative prices of both goods and factors, thus inducing the leakage of carbon emissions. These price changes, however, also modify the incentives for innovation, changing the level and, most importantly, the direction of technological change (i.e. how technology levels develop across indus-tries). This effect, known as induced technological change, was already postulated by Hicks(1932), and has since been the focus of many influential contributions, both theoretical and empirical.2Once the available technology changes as a result of cli-mate policy, however, so do the responses of the unconstrained countries. Yet, this additional mechanism has to date been almost completely ignored in the climate change policy literature.3
In this paper, we study the consequences of induced (directed) technological change on carbon leakage using a stylized theoretical model of the interactions between con-strained and unconcon-strained countries, which focuses on transmission mechanisms based on terms-of-trade effects. In order to be able to highlight the effects of induced technological change, we model two countries that are perfectly symmetric as refers to preferences, technology and endowments. In this way we rule out any other potential source of carbon leakage, which would cloud the effects of technological change.
1 Estimates of the size of this effect rely on Computable General Equilibrium (CGE) models. The
leakage rates for the Kyoto Protocol (the percentage of the reduction in emissions offset by the increase in emissions by countries outside the Protocol) reported in the literature range from 2 to 41% (see, for example,Burniaux and Oliveira-Martins 2000;Light et al. 2000).Babiker(2005) even finds a leakage rate of 130% for one of his scenarios. These differences in the estimates stem from widely differing assumptions with respect to the degree of international market integration, substitution and supply elasticities, and market structure.
2 For early contributions, seeKennedy(1964) andDrandakis and Phelps(1965). Recently,
Acemo-glu (1998;2002) has provided a tractable theoretical framework to investigate the issue. Among the empirical contributions,Newell et al.(1999) study the effect of energy prices and government regu-lations on energy-efficiency innovation. They show that changes in energy prices affect the direction of innovation for some products, and induce changes in the subset of models offered for sale. They conclude that ‘the endogeneity of the direction, or composition of technological change is surely at least as significant [as] the overall pace of technological change’ (p. 971).Popp(2002) shows that changes in energy prices (including the effects of environmental policy) positively and quickly affect environmentally friendly innovations.
3 Grubb et al.(1995) first noted the importance of induced technological change for carbon
Indeed, we only allow the two countries to differ in one crucial respect: one country imposes a binding emission cap, while the other remains unconstrained. As the coun-tries are symmetric before the imposition of the cap, the adjustment process represents a pure response to policy. In this sense, the paper analyses a ‘policy-induced pollution-haven effect’.
To single out the contribution of technological change in the adjustment process, our analysis proceeds in two steps. We start from a situation of complete symmetry and analyse the effect of introducing an exogenous emission cap. The first step refers to analysing a model where unilateral climate policy induces trade (in either energy-intensive goods, or directly in energy), but (the composition of) technology does not change. This is what we call the ‘undirected technical change’ scenario, where purely trade effects are at work. We then compare this benchmark to the case where tech-nology levels of the labour- and energy-intensive industries are allowed to develop at different rates, i.e. the ‘directed technical change’ scenario. We show that, when (the composition of) technology is allowed to adjust endogenously, induced technological change always leads to a reduction in the degree of carbon leakage. We refer to this as theinduced-technologyeffect.
Our paper contributes to the theoretical literature on carbon leakage by highlighting the role of directed technical change in this framework. The early literature on the topic addressed asymmetric international environmental policy from a public economics point of view (e.g.Hoel 1991;Barrett 1994;Carraro and Siniscalco 1998). Stressing the roles of free-riding incentives and strategic behaviour among nations, but abstracting from both technical change and international trade, this literature concludes that emissions among countries are strategic substitutes and that unilateral climate policy will lead to leakage of emissions. More recently, however,Copeland and Taylor (2005) show that in the presence of international trade and environ-mental preferences, a country’s response to a rest-of-world emissions reduction is ambiguous: emissions among countries can be either strategic complements or substi-tutes depending on key elasticities in the model. In their static two-good, two-factor, K-country model without technical change, this result follows from allowing for income and substitution effects on the consumption side to offset the terms-of-trade effect on the production side. The mechanism underlying their result therefore differs from ours, both in terms of modelling and in terms of economic content.
Closer in spirit to our work,Golombek and Hoel(2004) study the effect of interna-tional spillovers of abatement technology on leakage, using a static partial equilibrium two-country, one-good model with transboundary pollution. In each country a cen-tral planner chooses research and development (R&D) expenditures and abatement levels to minimize total costs that include environmental damages. Research activities lead, by assumption, to reductions in abatement costs, while international technology spill-overs allow technology to diffuse across borders at no cost. Hence, the authors effectively build in their model a mechanism that counteracts the free-riding incen-tives underlined by previous literature. In our model, on the other hand, the nature of technical change is endogenous, as it is itself driven by profit incentives, and depends on the characteristics of production.
induced-technology effect changes the previous results. In Sect.5, we discuss how our results relate to the existing literature and conclude, pointing at possible extensions.
2 The Model
Our economy consists of two countries,candu, that have identical production tech-nologies and endowments, while only differing in their environmental policies. We focus on a situation of free trade noting that, as long as the two countries do not differ in environmental policies, there will be no actual scope for trade.
We assume that countryc(forconstrained) imposes an exogenously imposed bind-ing cap on pollutbind-ing emissions. By imposbind-ing an exogenous constraint, rather than mod-elling asymmetries in (environmental) preferences, we are able to identify the pure effect of technological change on carbon leakage. If we were, instead, to assume differ-ences in preferdiffer-ences across countries, we would introduce additional (asymmetric) effects through income and substitution mechanisms. In this case, however, it would be impossible to isolate and emphasize the role of directed technical change in the final outcome. Since the focus of this paper is on carbon leakage, we do not discuss economic growth or welfare, as such we do not need to solve explicitly for the interest rate. Moreover, consumption only occurs in terms of the final good and hence does not affect the relative demand for the intermediate goods, thus, we can abstract from the consumer’s side of the economy altogether.
In each country, final outputYis obtained as a CES aggregate of two (intermediate) goods,YEandYL, with an elasticity of substitution equal toε:
Yr= (E) and a specialized set of differentiated machines. The range of types of machines available to produce energy intensive goods is indicated byNE. Instead,YLis pro-duced using labour (LL) and a different set of machines, whose range is indicated by
NL. FollowingAcemoglu(2002), the production functions for the intermediate goods are as follows:
To produce each type of machine, producers need a blueprint invented by the R&D sector, as will be discussed below. We assume that machines developed to complement
4 For simplicity, we set the share parameters in the CES to one, as they will only introduce an
one factor of production cannot be usefully employed in the other sector and that blueprints can be traded internationally. Accordingly,NE andNLrepresent global levels of technology and producers in each country can use all machine types globally available for their sector.
We assume that in each country an amount of labour equal toLis inelastically sup-plied at each point in time, and that it is immobile across countries. Labour can either be employed in the production of the labour intensive goodYL, or in the production of energy:
L=LrL+LrE, (4)
whereLrEis the amount of labour in energy production in countryr. As inBabiker (2005), we assume that energy has to be produced using labour and some fixed factor. Consequently there are decreasing returns to labour in energy production:
Er=LrEφ, (5)
whereφ∈(0, 1). Energy generation causes emissions of carbon dioxide. We assume that CO2emissions,Z, are proportional to the amount of energy produced, so that
Z=E.
When countrycintroduces a binding constraint on the amount of carbon dioxide emitted, itde factoimposes a cap on the amount of labour allocated to energy produc-tion. Indeed, whenZcis the maximum amount of emissions permitted at any point in time, the allocation of labour in countrycmust satisfyLcE=(Zc)1/φ.
The last part of our model consists of the process of technical change. As men-tioned in the introduction, in our analysis we aim at comparing the outcomes obtained under two alternative technology regimes: ‘directed’ and ‘undirected’ technical change (DTC and UTC, respectively, henceforth).
Underdirectedtechnical change, prospective innovators decide on the amount of their R&D outlays, and are also able to choose the sector they want to target their innovation efforts to. They know from the onset which intermediate sector will use their innovation. Hence, they will invent new machines for the sector that promises the highest returns. Using a lab-equipment specification5for the process of technical change, we assume that investing one unit of the final good in R&D generatesνnew innovations in any of the two sectors. Thus, the development of new types of machines takes place according to the following production functions:6
˙
NE=νRcE+RuE
and (6)
˙ NL=ν
RcL+RuL, (7)
whereRrj indicates R&D expenditure in countryr, and sectorj, while a dot on a variable represents its time derivative, i.e.x˙=dx/dt.
In order to have a meaningful comparison for the DTC regime, we model the following variant, that we call UTC. In this case, prospective innovators invest in the development of blueprints whenever it is profitable to do so, yet they cannot choose the sector they want to develop a new machine for. We are thus able to emphasize the effect of the ‘directedness’ of technical change on carbon leakage, while technological
5 SeeRivera-Batiz and Romer(1991).
6 For simplicity, we assume that R&D is equally productive in the two sectors. Relaxing this
change is endogenous in both versions. We imagine that with UTC the outcome of the R&D investment is uncertain in the sense that innovators are not sure in which sector their blueprint will find utilization, and hence they maximize expected, rather than certain, profits from R&D. To keep matters simple, we assume that the newly developed blueprint will be energy-complementing with probabilityγ ∈(0, 1), and labour-complementing with probability(1−γ ). Consequently, the (expected) relative marginal productivity is constant, as is common in traditional (one-sector) models of endogenous growth.7As innovators can only determine the total outlays in R&D activities, but not the sectoral split, the total number of innovations develops according to:
˙
N=νRc+Ru, (8)
whereRrindicates total R&D investment by countryr.
In both versions of the model, a new blueprint must be developed before the innovator can sell it to producers, thus the costs of R&D are sunk. Hence, machine producers must wield some monopoly power in the market for machines, in order to recoup the development costs. For this we assume that an innovator is awarded a global patent for her invention and that patents are perfectly enforced in both coun-tries. Thus, each innovation takes place only once, and no international overlap in blueprints occurs.8
Finally, we simplify the analysis by assuming that machine production is local, that is innovators license their blueprints to one producer in each region, so that blueprints are traded across countries, but machines are not.
3 Equilibrium
The main focus of the paper is on the level of carbon emissions in both countries. As emissions are proportional to the amount of energy produced in each region, the key to derive the results in the following section is to understand the allocation of labour between production of the labour-intensive goodYL, and energy. Appendix A presents the complete solution of the model, here we only highlight some key elements of the solution.
In the intermediate goods’ sectors, profit maximization entails the following first-order conditions:
wrE= β
1−β
prE1/βNEand (9)
wrL= β
1−β
prL1/βNL, (10)
7 With undirected technical change the relative level of technology in the two sectors,N E/NL, is
exogenous and constant. Moreover, sinceNE/NLequalsγ /(1−γ ), any value ofNE/NLcan be calibrated by an appropriate choice of the probabilityγ.
8 Our focus in the current paper is on the interaction between two highly developed countries, or
wherewrj is the price of inputj, andprj is the price of intermediateYj, in countryr. These equations allow a brief discussion of international trade in our model. Consid-ering (9) and (10), it is immediate that goods’ and factors’ price equalization always obtains in our model. Consider first the case where no emission ceiling is imposed. Trivially, in this case the two countries are identical and all prices are the same across regions. Now, consider what happens when countryc introduces an emission cap. The prices of both energy and the energy-intensive good tend to increase, creating the scope for trade. The constrained country exports the labour-intensive good,YL, against imports ofYE and/orE. However, it is immaterial which of these goods is actually imported. Indeed, from (9) and (10), as long aspLandeither pEor wEare the same across countries, which follows from the law of one price, all prices equalize. In this sense, it makes no difference to allow for trade in energy-intensive goods, or directly in energy. Since prices always equalize, we drop the country index when this does not induce confusion.
Taking the ratio of the first-order conditions above, and using the expression for equilibrium prices—(A.5) in Appendix A—we get the following expression for the relative factor rewards,w≡wE/wL, for given technology
w=N(σ−1)/σSw−1/σ, (11)
whereN≡NE/NLis the ‘technology ratio’,Sw≡(Ec+Eu) /LcL+LuLis the global (or world, hence the superscriptw) relative factor supply, andσ ≡1+(ε−1)β. Solving (11) forSwgivesSw=Nσ−1w−σ, elucidating the role ofσas the elasticity of relative factor demand with respect to their relative price. Hence, the relative price of energy decreases with energy supply, while, as will be discussed later, the effect of changes in the technology ratioNon relative factor rewards depends on whether the relative energy demand is elastic or inelastic.9
In the energy sector, producers employ labour,LrE, so as to satisfy the first-order condition for profit maximizationw =LrE1−φ/φ. Equating this to (11) yields the following expression:
φ−σN1−σLEφ(1−σ )+σ+LE=L. (12)
HereLE=LcE=LuEis the amount of labour employed in energy production in each country, when both countries are unconstrained, and technologyNis given.
When countrycfaces a binding emission constraint, its emissions, energy generation and amount of labour in energy production are determined by the cap:LcE=(Zc)1/φ. In the unconstrained country however, energy producers still choose the amount of labour so as to maximize profits. Taking the value of the cap into account, we find the following expression representing the equilibrium allocation of labour in countryu, for givenNandLc
E:
φ−σN1−σLcEφLuEσ (1−φ)+LuEφ(1−σ )+σ +LcE+LuE=2L. (13)
So far we have assumed thatN is constant, in accordance with our definition of undirected technical change. When technical change is directed, instead, innovators choose (the amount and) the direction of their innovation efforts. They will invest in
9 Sinceσ ≡1+(ε−1)β, it follows thatσ ≷1⇔ε≷1. Thus, the relative factor demand is elastic
(σ >1) if and only if intermediate goods are gross substitutes in the production of the final good
the sector which is expected to yield the highest rate of return. In Appendix A, we show that the relative profitability of innovations in the two sectors,π =πE/πLis given by:
π=p1/βSw,
wherep≡pE/pL. At each point in time, the direction of innovation will be determined by relative profits. Whenπ >1 innovators will concentrate on energy-complementing research activities andNincreases, while whenπ <1 labour-complementing activities are more profitable, andNdecreases. The expression above shows that the entrepre-neurs’ choice of the sector to invest in is determined by the relative price of the intermediate goods (theprice effect) and by the relative amount of factors to which a machine type is complementary (themarket-size effect). In particular, for given tech-nology, a decrease in energy supply leads to a reduction in relative profits through the market size effect and to an increase through the price effect, see (A.5). Which of the two effects prevails depends on the elasticityσ, as will be discussed later. In equilibrium, however, both types of innovation occur at the same time, leading to the no-arbitrage expression:π=1.
Using this no-arbitrage relation, we can solve for the equilibrium level of the technology ratio,N:
N=(Sw)σ−1. (14)
As noted above, the effect of a decrease in energy supply on the direction of technical change, that is on whetherNincreases or decreases, depends on the size ofσ. When labour- and energy-intensive goods are gross complements in final goods production (σ < 1), the price effect outweighs the market size effect and a decrease in energy supply induces an increase in the range of energy complementary machines. How-ever, whenσ >1 the result is reversed, and the reduction in energy supply induces an increase in the range of labour-complementary machines.
Substituting the expression for the equilibrium value ofNin (12) and (13) provides the key expressions for the equilibrium allocation of labour under directed technical change:
φ1/(σ−2)LE(φ(σ−1)−1)/(σ−2)+LE=L (15)
for the case when both countries are symmetric, and
φ1/(σ−2)LcEφLuE(φ−1)/(σ−2)+LuE(φ(σ−1)−1)/(σ−2) +LcE+LuE=2L (16)
when countrycfaces a binding ceiling on its CO2emissions.
Thus, (12) and (13) summarize the long-run equilibrium of our model with and without unilateral climate policy under undirected technical change, while the last two equations do the same for the case of directed technical change.
4 Unilateral climate policy and carbon leakage
countries are unconstrained, Eq.12. This baseline is characterized by the (symmetric) equilibrium level of labour devoted to energy generationLEand by the corresponding (endogenous) technology ratioN. In order to have comparable baselines across tech-nology regimes, we need to choose γ, the probability for an innovator to end up with an energy-complementing blueprint, such thatγ /(1−γ )=Nequals the level prevailing under directed technical change (see Sect.2).
Starting from this common equilibrium, we introduce an emissions constraint in one of the countries and study the degree of carbon leakage that occurs along the balanced growth path. We first study carbon leakage when technical change is undirected. Then we move on to the model with directed technical change and discuss how and why the results from this model differ from the model with ‘traditional’ endogenous growth.
4.1 Carbon leakage under undirected technical change
Carbon leakage occurs when the unconstrained region increases its emissions in reac-tion to a reducreac-tion in emissions by the other country (i.e. whenLuE>LE). Intuitively it would seem clear that there should always be some carbon leakage: when a country exogenously reduces its supply of energy by introducing a limit to the amount of emis-sions, the energy intensive good becomes scarcer on its domestic market, giving rise to an increase in its relative price. This creates some scope for trade: the unconstrained economy now enjoys a comparative advantage in the production of the dirty good and will expand its production thereof. As a consequenceLuEand hence emissionsZu
increase. We call this theterms-of-trade effectof a unilateral emission constraint. This result indeed holds in the case of undirected technical change, as formalized by the following proposition.
Proposition 1 When technical change is undirected, carbon leakage will always be positive along the balanced growth path.
Proof Take the ratio of (12) and (13) and rearrange to find:
LφE
LuEφ+LcEφ
−1/σ
2L−LcE−LuE L−LE
−1/σ =
L
E
LuE
1−φ
.
Assume thatLuE≤LE. Then the right-hand side is larger than or equal to one while the left hand side is smaller than one. So we have a contradiction, henceLu
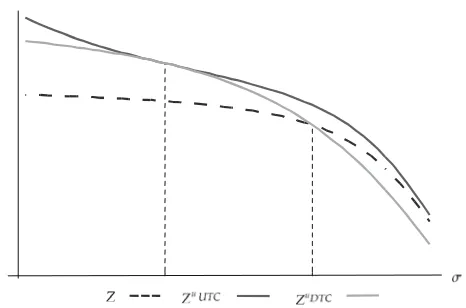
E>LE.⊓⊔ We illustrate this result in Fig.1, where the dark dashed line represents emissions (or equivalently energy production) in each country when both are unconstrained. The amount of emissions by the unconstrained country when the other country faces a binding emission constraint, under undirected technical change is represented by the solid black line.10 The figure clearly shows that emissions in the unconstrained region always increase following the introduction of the cap. In addition, we see that the amount of energy produced in the unconstrained region is declining withσ, the elasticity of relative demand for energy with respect to its relative price. The higher
10 The figures in this paper are obtained from numerical simulations, using as baseline parameters
Fig. 1 Country U’s Emissions in the unconstrained model (Z), in the constrained model under undirected technical change (ZuUTC), and under directed technical change (ZuDTC)
this elasticity, the lower the demand for energy in the constrained economy following the imposition of the constraint, hence the lower the export-led increase in energy generation.
When technical change is endogenous but undirected, unilateral climate policy is undermined by emission increases by unconstrained countries. However, it seems intuitively clear that changes in relative pricescœteris paribus will not lead to an increase in global emissions. Climate policy will shift production to the unconstrained country (Proposition1), but the increase in the relative price of the carbon intensive good will at the same time lead to a reduction in global energy demand. To address this formally, we look at the impact of a change in the level of the cap on total emissions,
LcEφ+LuEφ , and derive the following result:
Proposition 2 When technical change is undirected, global emissions will always decrease following a tightening of the emission constraint.
Proof By total differentiation of (13), we get:
dLuE
dLcE = −
A(LuE)σ (1−φ)φ (Lc
E)φ−1+1
A(LuE)σ (1−φ)φ (Lu
E)φ−1+σ (1−φ)
(LcE)φ+(Lu E)φ
(LuE)−1+1, (17)
where A ≡ φ−σN1−σ. Let Ew ≡ Lc E
φ
+LuEφ be total emissions. Thus, Ew decreases with a tightening of the cap whenever dEw/dLc
E> 0. DifferentiatingEw, and rearranging terms shows that dEw/dLcE>0 requires:
dLuE
dLcE >−
(LcE)φ−1 (LuE)φ−1.
This and (17) in turn imply that total emissions decline whenever
A(LuE)σ (1−φ)φ (LcE)φ−1+1
A(LuE)σ (1−φ)φ (Lu
E)φ−1+σ (1−φ)
(LcE)φ+(Lu E)φ
(LuE)−1+1 <
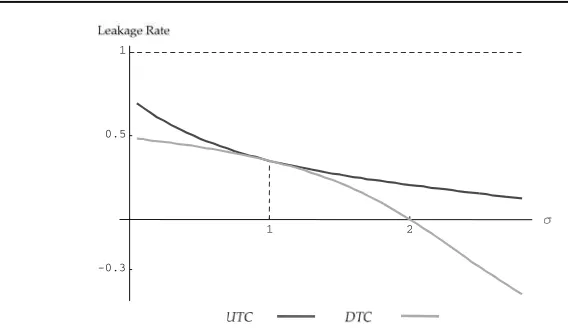
Fig. 2 Leakage rate under undirected (UTC) and directed (DTC) technical change
Straightforward calculations show this to be equivalent to:
−A(LuE)σ (1−φ)(LcE)φ+(LuE)φ(LuE)−1−(LcE)φ−1+(LuE)φ−1<0.
SinceLcE<LuEandφ∈(0, 1), the above inequality is always true. ⊓⊔
To illustrate this result, we present the leakage rate, the ratio of the induced increase in emissions in the unconstrained country and the emission reduction in the constrained region, i.e. LuEφ−(LE)φ
(LE)φ−
LcEφ , as a function of σ in Fig.2. The leakage rate for the case of undirected technical change is represented by the dark line. As the figure shows, the leakage rate is always positive, but less than 1.
4.2 Carbon leakage under directed technical change
In this section, we focus on the central point of our analysis and derive our main results comparing the effects of an emission cap across regimes of technical change. We start by noting that allowing for directed technical change effectively provides the economy with an additional instrument to cope with the consequences of the introduction of a binding cap in the constrained country. Changes in the compo-sition of technology may enable the unconstrained country to meet the increased demand for energy intensive goods while diverting less labour from its relatively more productive use in theYLsector. This is what we call theinduced-technology effectof a unilateral emission constraint. We will show that this effect has the opposite sign to the terms-of-trade effect introduced above and hence tends to reduce carbon leakage. We can compare the two versions of the model using the Le Chatelier principle (see, e.g.Silberberg 1990). Taking the total differential of (13) and rearranging we can write the total effect of a change in the cap on emissions in the unconstrained country as:
∂LuE
∂LcE
DTC
= ∂L
u E
∂LcE
UTC
+∂L
u E
∂N
dN
dLcE, (18)
allowing for directed technical change (the left-hand side) can be decomposed in aterms-of-trade effect, represented by the first term at the right-hand side, and an
induced-technology effect. Whether these two effects act in the same direction or not ultimately determines under which regime we can expect leakage to be higher. In order to draw any conclusion, we need to sign the components of the above equation, thus getting the following result:
Proposition 3 Forσ=1carbon leakage will be smaller with directed technical change than with undirected technical change. Forσ =1it will be identical across regimes.
Proof From Proposition1we know that∂LuE/∂LcEUTC<0.
As for∂LuE/∂N·dN/dLcE, consider first the case whereσ <1. From (14), it is imme-diate that dN/dLcE <0. Moreover, from (13), whenN(and henceN1−σ) increases,
LuEmust decline to satisfy the equation,cœteris paribus. Thus,∂LuE/∂N <0. Hence
∂LuE/∂N·dN/dLcE>0.
Consider nowσ > 1. By symmetric arguments, dN/dLcE > 0 and∂LuE/∂N > 0, implying once more∂Lu
E/∂N·dN/dLcE>0.
Finally, considerσ = 1. In this caseN equals 1, irrespective of the value ofSw,
hence dN/dLcE=0. ⊓⊔
This result shows that the induced-technology effect works against the standard terms-of-trade effect of Proposition1. It thus lowers the amount of carbon leakage that would occur if technical change were not directed. Figure1shows the two effects. The pure terms-of-trade effect can be read from the upwards shift of emissions from the dashed dark line (the model without a cap) to the dark solid line (the model with a cap and undirected technical change). The induced technology effect is summarized by the move from the solid black line to the light gray one (the model with a cap and directed technical change). Indeed, the amount of emissions is lower when technical change is directed, with the exception of the case whereσ = 1. This is due to the fact that whenσ = 1 our CES specification in (1) reduces to a Cobb–Douglas pro-duction function, in which case technical change will always be neutral to the inputs concerned.11
The key mechanism at work here, is that the type of technical change induced by the emission constraint proves to be always energy-saving. To show this, we first analyse how the composition of technology is affected by the introduction of the cap. Successively we address the interaction between changes inNand the level ofσ, to explain the impact of technical change on the evolution of the relative factor shares in our economy.
The composition of technology evolves according to the relative profitability of R&D in the different sectors. As noted in Sect.3, the final effect of introducing a cap (i.e. a change inSw) on relative profits depends both on changes in the relative market size and in relative prices. Climate policy reduces the amount of energy produced, and hence decreases the potential size of the market for new energy-complementing inno-vations. At the same time, it makes energy scarcer, thereby rising the price of energy and making an innovation for the energy intensive good more valuable. Whether the negative market size effect or the positive price effect dominates depends onσ, the elasticity of the relative demand for energy with respect to its relative price. Since in
11 Notice that, formally, we would need share parameters summing up to one in (1) to obtain a
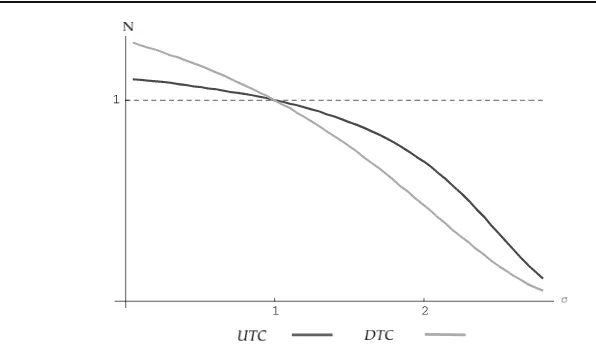
Fig. 3 Technology ratios (N) under undirected and directed technical change
the long-run equilibrium the technology ratio is given by (14), we see that whenever
σ <1 the price effect dominates and the introduction of a cap induces an increase in
N. Whenσ >1 on the other hand, the market size effect dominates andNdecreases. This relation betweenNandσis plotted in Fig.3, where the dark line represents the ratio of technology under undirected technical change, while the lighter one depicts the case of directed technical change.
Recalling the expression for relative factor productivity from (11), we can write the relative value share of energy to labour in countryuas,
wEEu
wLLuL
≡wSu=N(σ−1)/σ(Sw)−1/σSu.
We see that, for givenN, the effect of the introduction of the cap (a decrease inSw) is to unambiguously increase the share of energy in the unconstrained country. We know from the result in Proposition1that, whenNis constant, leakage is always positive. Once we allowNto change in response to economic incentives, however, some form of induced energy-saving technical change occurs. The expression above shows how the effect of a change in the technology ratio on relative factor shares depends onσ. As discussed above, whenσ <1,Nis higher than in the case of undirected technical change (see Fig.3). Thus,N(σ−1)/σ is lower, and the increase in the energy share due
to the cap is counteracted by the induced change in technology. The same is true when
σ > 1. In this case, however, bothNandN(σ−1)/σ are below their baseline levels.
Thus, irrespective of the level ofσ, the effect of the induced change in technology (N(σ−1)/σ) is to mitigate the terms-of-trade effect (which works through(Sw)−1/σ).
We can conclude that the technical change induced by the introduction of unilateral climate policy reduces the share of energy. Thus, technical change is endogenously energy-saving in our model. As shown in Proposition3, directed technical change unambiguously leads to lower rates of carbon leakage.
light curve) dips below the graph of the baseline case (the dashed curve), asσ gets larger. The following proposition makes it formal using a log-linearized version of our model, derived in Appendix B:12
Proposition 4 When technical change is directed, carbon leakage due to a marginal tightening of the emission constraint will be positive forσ < 2, zero forσ =2, and negative forσ >2.
Proof In Sect.B.2of the Appendix we use a log-linearized version of the model to show that, around the equilibrium, we may write:
LuE
Lc E
=
(σ−2)
(1−η) φ+χL
c E Lu E
(2−σ ) (ηφ+χ )+1−φ . (19)
As discussed in Appendix B.2, a necessary condition for a stable equilibrium is that the term at the denominator be positive. Moreover, the second term in parenthesis at the numerator is always positive. Hence, around a stable equilibrium, we have
LuE/LcE0 wheneverσ2. ⊓⊔
This proposition shows that, when technical change is directed, the induced-tech-nology effect can outweigh the terms-of-trade effect, provided that the elasticity of the relative demand for carbon-based energy is ‘sufficiently large’. Whetherσlarger than two is a plausible case, however, is difficult to assess from the available litera-ture. In our model energy,E, implicitly stands for energy generated from fossil fuels rather than energytout-court, as its generation directly causes the emissions of car-bon dioxide. Where long-run own-price elasticities for ‘broad’ energy are estimated in the range 0.2–1.76 (see, e.g.Pindyck and Rotemberg 1983;Popp 2001;Gately and Huntington 2002), the estimates for fossil fuel products have values of up to 2.72 (see, e.g.Bates and Moore 1992;Espey 1998;Taheri and Stevenson 2002). Sinceσcan be interpreted as the price elasticity foraggregatedfossil fuels, the former estimates may provide a lower bound forσwhile the latter may be seen as an upper bound. In this respect, a long-run value for the demand elasticity of fossil fuels of around 2 does not seem implausible.
5 Discussion and conclusions
The refusal of the United States to ratify the Kyoto Protocol is seen by many as a seri-ous threat to the Protocol’s effectiveness. If a coalition of technologically advanced (and hence fossil-fuel dependent) economies decides to voluntarily reduce its emis-sions of carbon dioxide, this will increase the price of dirty goods within this coalition. Unconstrained countries, such as the US, might benefit from increasing their produc-tion of dirty goods and exporting them to coaliproduc-tion members, thereby offsetting the decrease in emissions by the ratifying countries (carbon leakage).
However, environmental policy affects relative prices, and hence it modifies the relative profitability of inventing for the clean or dirty goods industry. The effects of changes in the direction of technical change on carbon leakage cannot be ignored. In
12 Although this proposition represents a local result, all our simulations confirm this pattern for the
this paper, we studied these effects taking explicitly into account that a technologically advanced country is outside the coalition. We presented a stylized theoretical model, which compares the results of a scenario where technology in the clean and dirty sectors is allowed to develop differently (directed technical change), to those derived from a model of ‘traditional’ endogenous technical change. We have shown that taking into account the endogeneity of the direction of technical change always leads to lower leakage rates than when this induced technology effect is ignored. We have also dis-cussed the possibility that the sign of carbon leakage be reversed. When the elasticity of demand for carbon-based energy is sufficiently high, the change in technology due to the emission constraint is such that it becomes optimal for the unconstrained country to cut back on its emissions.
In order to emphasize the role of technical change on carbon leakage as clearly as possible, we had to abstract from several other mechanisms that play a role in determining the degree of leakage. Clearly, preferences, endowments and production possibilities all play a role in determining the global effect of unilateral climate policy. However, by abstracting from these aspects, we were able to highlight the effect of profit incentives on innovation and ultimately on carbon leakage. Comforted by the empirical literature (see footnote2), we believe that our results highlight a general and relevant mechanism: energy-saving technical change in the presence of climate policy. Indeed, when technology is given, the global ratio of energy to other inputs decreases (see Proposition2), a result that has been found in virtually all of the CGE literature. This, in turn, induces energy-saving technological change, as we discussed in Sect.4.2. Relative to a situation without directed technical change, the global demand for carbon-based energy, the demand for fossil fuels in the unconstrained country, and hence the degree of carbon leakage, will all be lower.
Of course reality is more complicated than our stylized model. As mentioned in the introduction, there is at least one other important channel through which emis-sions leak from one country to the other. This we can broadly label theenergy-market channel. When an emission cap is introduced, the price of carbon intensive fuels tends to decrease relative to cleaner ones, due to the decreased demand by constrained countries. As dirtier inputs become cheaper, countries outside the climate agreement tend to increase their demand, leading to additional carbon leakage.13The strength of this mechanism depends on the ease of inter-fuel substitution (whether it is tech-nically possible to substitute natural gas for coal, for example), on the elasticity of supply of the different fuels, and on the possibility of trading different types of fuel internationally. The technical possibility to substitute one fuel for the other affects the size of the shift in demand following a change in the relative price. On the other hand, changes in relative prices also depend crucially on the decision of fuels producers whether to reduce supply as the price falls, and to what extent. Finally, if fuels (or some of them) are not easily traded internationally, the scope for substitution (and for carbon leakage through this channel) might also be limited.
The sensitivity of carbon leakage rates to changes in the key elasticities determining substitution, supply responses and trading flows have been comprehensively analysed byBurniaux and Oliveira-Martins(2000). They conclude that the rate of leakage is higher, the higher the inter-fuel elasticity of substitution, the lower the elasticity of
13 Given the differences in model assumptions for CGE models (see footnote 1), it is hard to say
anything about the relative sizes of the energy market channel and the channel that works through trade in CO2-intensive goods. According toKuik(2005), CGE modelers seem to agree that the former
supply, and the higher the Armington elasticities among different fuels. Any of these elements could be the focus of possible extensions to our model. However, as long as the elasticities of supply are not too small (as seems reasonable, given the long-run perspective of our analysis), and as long as trade in coal is limited (which seems sen-sible, given that coal is a very bulky fuel which requires expansive infrastructures and entails high transport costs), the degree of carbon leakage will be lower than 100%. Recalling the discussion above on energy-saving technical change, this suggests that also in this more complex framework, the same mechanism would be preserved and carbon leakage would be lower when the direction of technical change is endogenous. Our results lend some support to the position of those who advocate the Kyoto Protocol, and other forms of unilateral climate policy as effective means to reduce car-bon emissions. We have shown that the leakage rates that inform the current debate might prove overestimated, since the available quantitative literature neglects the role of endogeneity in the direction of technical change. As a consequence, unilateral climate policy might be more effective than generally claimed. Moreover, we also hint at the (theoretical) possibility that, when the demand for carbon-based energy is sufficiently elastic, ratifiers’ efforts could be compounded by emissionreductionsby unconstrained countries.
Finally, we should note that the quantitative impact of the mechanisms we have highlighted in this paper depends on the key elasticities of the model. Thus, our theoretical conclusions need to be assessed through quantitative methods, first and foremost using CGE models that incorporate directed technical change. The calibra-tion of such a model, however, would require reliable sector-specific data on technical progress. Building such a model, and finding the necessary data, constitutes a formi-dable challenge for future research.
Appendix A: model solution
A.1 Undirected technical change
Profit maximization in the final good sector implies
YEdr
YLdr =
p
E
pL
−ε
, (A.1)
wherepj is the price of goodYj,j= E,L. The superscriptdindicates demand and avoid confusion with supply in (2) and (3).
Producers of the intermediate goodYj maximize profits taking prices and tech-nology as given. The first-order conditions for sectorj= E,Land countryr=c,u
read:
krj(i)=
pj
pkj(i)
1/β
Srj and (A.2)
wj=
β
1−βpj
Nj
0
krj(i)(1−β)di
Srjβ−1, (A.3)
Local licensees of blueprints act as monopolists. Assuming constant marginal costs equal toω units of the final good, profit maximization impliespkj(i) = ω/(1−β). Lettingω=1−β, the price of machines in both sectors equals 1. As all machines are equally productive in production, and all entail the same cost, the demand of each machine will be the same,kjsay.
Using this, and substituting from (A.2) into (2) and (3), we obtain the following expression for the relative supply of intermediate goods:
Yw=p(1−β)/βSwN, (A.4)
whereN≡NE/NL,Sw≡(Ec+Eu) /
LcL+LuL, andYw≡Yc E+YEu
/YcL+YLu. Equating (A.4) to (A.1) yields the market clearing relative price as
p=NSw−β/σ, (A.5)
whereσ ≡1+(ε−1)β.
Substituting (A.2) into (A.3), taking ratios and using (A.5), we get the relative factor rewards, for given technology (expression (11) in the main text):
w=N(σ−1)/σSw−1/σ,
wherew≡wE/wL.
Energy producers choose their labour input to maximize profits:
w= 1
φLrEφ−1
.
Equating this to the previous expression gives (implicitly) the equilibrium alloca-tion of labour, for givenN(expression (12) in the main text):
φ−σN1−σLEφ(1−σ )+σ+LE=L. (A.6)
Under the cap, the amount of labour in energy production is determined asLcE=
(Zc)1/φ. Using this, and solving as before, gives the equilibrium allocation in the
unconstrained country, for givenNandLc
E(expression (13) in the main text):
φ−σN1−σLcEφLuEσ (1−φ)+LuEφ(1−σ )+σ +LcE+LuE=2L. (A.7)
A.2 Directed technical change
Potential innovators maximize the net present value of the stream of expected future profits. In standard dynamic programming equations:
r(t)Vj(t)− ˙Vj(t)=πj(t),
whereVjis the value of an innovation in sectorjandr(t)is the interest rate at timet. Along the balanced growth path (BGP) of the economy, i.e. a situation in which the prices are constant, andNEandNLgrow at the same constant rate—profits do not change over time, so thatV˙j=0. Since entry is free in the R&D sector, the value
of an innovation cannot exceed its cost, i.e.Vj≤1/νin each sector. Moreover, along the BGP both types of innovation must occur at the same time, henceVj = 1/ν in both sectors, leading to the no-arbitrage equation:
Using (A.2), the instantaneous profits of machine produces are:
πE=βp1E/βEw and πL=βp1L/βLwL.
Plugging this into the no-arbitrage equation above, yields,
p1/βSw=1.
Using (A.5), we solve this last expression for N, obtaining (expression (14) in the main text):
N=(Sw)σ−1. (A.8)
Substituting this into (A.6) yields the following expression for the equilibrium under DTC and in the absence of climate policy (expression (15) in the main text)
φ1/(σ−2)LE(φ(σ−1)−1)/(σ−2)+LE=L.
Using (A.8) and (A.7), instead, provides the same expression for the case when coun-trycimposes a ceiling to its CO2emissions (expression (16) in the main text).
φ1/(σ−2)LcEφLuE(φ−1)/(σ−2)+LuE(φ(σ−1)−1)/(σ−2) +LcE+LuE=2L.
Appendix B: the log-linearized model
In this appendix we (log-)linearize the model around the steady state and derive several results.
B.1 Deriving the log-linearized model
The linearized version of the goods market equilibrium condition (13) reads:
(σ−1)N=(1−φ) σ+ηφ+χ LuE+
(1−η) φ+χL
c E
LuE
LcE, (B.1)
where a tilde,, over a variable denotes a small percentage change, and where we have used the following definitions:
η≡
LuEφ
LuEφ+LcEφ ∈(0, 1), and χ≡
LuE
2L−LcE−LuE. (B.2)
The percentage changes inLuE andLcE denote any marginal change in the respec-tive variable. For example, a decrease inLc
E(that is aLcE<0) fromLcE=LEwould represent the introduction of a marginal emissions cap in the country, while a decrease from anyLcE<LEwould represent any marginal tightening of an existing cap.
When we linearize the equilibrium condition for the market for innovations, (14), we find:
N=(σ−1)
(1−η) φ+χL
c E
LuE
B.2 Appendix to Proposition4
To find (19), substitute (B.3) into (B.1) and rewrite to find:
The denominator of this expression will be positive around any stable equilibrium. Indeed, the dynamics of the system require that at any stable equilibrium the slope of the goods market equilibrium condition be steeper than the R&D equilibrium condition in the(LE,N)space. The relevant slopes can be easily derived from (B.1) to (B.3). Forσ <1 the stability condition discussed above requires:
where the subscripts GME and R&DE indicate the goods markets and the R&D mar-ket equilibrium conditions, respectively. The sign of the inequality is reversed for the case whenσ >1. Since in both cases one can easily verify that the stability condition simplifies to
(2−σ ) (ηφ+χ )+1−φ >0
we have established our claim.
Acknowledgements We are greatly indebted to Sjak Smulders, Emiliya Lazarova and Maurizio Zanardi for fruitful discussions. We would also like to thank Erwin Bulte, Henk Folmer, Cees Withagen, Aart de Zeeuw, conference participants in Zurich, Bremen and Amsterdam, and two anonymous referees for useful comments.
References
Acemoglu D (1998) Why do new technologies complement skills? Directed technical change and wage inequality. Q J Econ 113:1055–1089
Acemoglu D (2002) Directed technical change. Rev Econ Stud 69:781–809 Acemoglu D (2007) Equilibrium bias of technology. Econometrica forthcoming
Babiker MH (2005) Climate change policy, market structure and carbon leakage. J Int Econ 65:421–445
Barrett S (1994) Self-enforcing international environmental agreements. Oxf Econ Pap 46:878–894 Bates RW, Moore EA (1992) Commercial energy efficiency and the environment. World Bank
Work-ing Paper Series 972, World Bank
Burniaux J, Oliveira-Martins J (2000) Carbon emission leakages: a general equilibrium view. OECD Economics Department Working Paper 242, OECD Economics Department
Carraro C, Siniscalco D (1998) International environmental agreements: incentives and political economy. Eur Econ Rev 42:561–572
Copeland BR, Taylor MS (2005) Free trade and global warming: a trade theory view of the KYOTO PROTOCOL. J Environ Econ Manage 49:205–234
Di Maria C, Smulders S (2004) Trade pessimists vs technology optimists: induced technical change and pollution havens. Adv Econ Anal Policy 4(2) article 7
Drandakis E, Phelps E (1965) A model of induced invention, growth and distribution. Econ J CXXVI:823–840
Espey M (1998) Gasoline demand revisited: an international meta-analysis of elasticities. Energy Econ 20:273–295
Golombek R, Hoel M (2004) Unilateral emission reductions and cross-country technology spillovers. Adv Econ Anal Policy 4(2) article 3
Grubb M, Chapuis T, Ha Duong M (1995) The economics of changing course: implications of adapt-ability and inertia for optimal climate policy. Energy Policy 23(4/5):417–432
Hicks J (1932) The theory of wages. Macmillan, London
Hoel M (1991) Global environmental problems: the effects of unilateral actions taken by one country. J Environ Econ Manage 20:55–70
Kennedy C (1964) Induced bias in innovation and the theory of distribution. Econ J LXXIV:541–547 Kuik O (2005) Climate change policies, international trade, and carbon leakage: an applied general
equilibrium analysis. Ph.D. thesis, Free University, Amsterdam
Light M, Kolstad CD, Rutherford TF (2000) Coal markets, carbon leakage and the KYOTO PROTOCOL. Center for Economic Analysis Working Paper 23, University of Colorado at Boulder
Newell R, Jaffe A, Stavins R (1999) The induced innovation hypothesis and energy-saving technolog-ical change. Q J Econ 114:941–976
Pindyck RS, Rotemberg JJ (1983) Dynamic factor demands and the effects of energy price shocks. Am Econ Rev 73(5):1066–1079
Popp D (2001) The effect of new technology on energy consumption. Resour Energy Econ 23:215–239 Popp D (2002) Induced innovation and energy prices. Am Econ Rev 92:160–180
Rivera-Batiz LA, Romer PM (1991) Technological differences. Q J Econ CXVI:531–555
Silberberg E (1990) The structure of economics: a mathematical analysis. 2nd edn. MacGraw Hill, London