201
AGRIVITA VOLUME 36 No. 3 OCTOBER - 2014 ISSN : 0126 - 0537
http://dx.doi.org/10.17503/Agrivita-2014-36-3-201-209
GROWTH AND PHYSIOLOGICAL CHARACTERISTICS OF SOYBEAN GENOTYPES
(Glycine max L.) TOWARD SALINITY STRESS
Nurul Aini 1*), Syekhfani 1), Wiwin Sumiya Dwi Yamika 1), Runik Dyah P. 2) and Adi Setiawan 1) 1)
Faculty of Agriculture University of Brawijaya Jl. Veteran Malang 65145 East Java Indonesia 2)
Indonesian Legumes and Tuber Crops Research Institute Jl. Raya Kendalpayak Malang East Java Indonesia *)
Corresponding author Phone: +62-341-570471 E-mail: [email protected]
Received: October 7, 2014/ Accepted: January 6, 2015
ABSTRACT
The research aimed to determine the tolerance limit of soybean genotypes toward salinity stress, plant growth and physiological characteristics. It was conducted in green house, from April to August 2013. The study involved two activities. The first activity for evaluating a salinity stress, consisted of four levels of soil salinity (EC): 0.9; 4; 7; 10 dS m-1 and eleven genotypes. The second one to obtain information about changes in physiological and morphological characteristics of soybean affected by salinity stress. The second activity consisted of two soil salinity levels (EC): 1.52 dS m-1 and 8.58 dS m-1. The results showed that at salinity 10 dS m-1, all varieties/genotypes were not able to survive until the age of 43 days after sowing (DAS). At salinity 4 dS m-1, total plant dry weight of most genotypes soybean decreased by 48.14%, while the salinity of 7 dS m-1 total plant dry weight of all soybean decreased by 64.89%. Concentration of K and Na in soybean leaves were higher than those in soybean root tissue. The content of K and Na in leaves and roots of most soybean genotypes increased as soil salinity increased from 1.52 to 8.58 dS m-1, except for genotype G11.
Keywords: leaf chlorosis, necrosis, salinity tole-rant, soybean genotype, K and Na content
INTRODUCTION
National demand of soybean is higher than its supply. In the last three years (2010-2012) the average demand was 2 million tons, while the average production was 867,157 tons, or only
40% of the soybean national demand (CBS, 2013). Increasing soybean production by planting in arable land is limited, because the arable land is mainly used for staple food crops such as rice and corn. The chance of extending production area of soybean is by planting the crop in saline soil. However, problem with the saline land is that it contains fairly high salt content which inhibits plant growth due to ion toxicity, nutritional imbalances, osmotic effect and oxidative stress (Leigh and Jones, 1984). Land with salinity stress requires special technologies that support soybean plants to be able to grow and produce, such as providing soybean varieties that are tolerant to salinity. Chinusamy et al. (2005) found that the salinity threshold for soybean is at 5.0 dS m-1. While Katerji et al. (2003) reported that soybean grain yield decreased by 20% at a salinity of 4.0 dS m-1 and 56% at 6.7 dS m-1 salinity compared to 0.8 dS m-1. Reduction in crop productivity due to salinity stress is usually caused by an imbalance of ions, toxicity due to high salt concentrations, or due to osmotic stress (Ashraf and Foolad, 2007; Ashraf, 2009). Furthermore, Aini et al. (2012) found that the response of plants to salinity stress was influenced by species or genotypes.
Saline land in Indonesia is estimated to 440,300 ha consisting of 304 000 ha land with slightly saline (electrical conductivity of saturated soil extract water more than 4 dS m-1) and 140 300 ha of saline land (Rachman et al., 2007). So far not many researches have been done on salinity tolerance of soybean varieties. Soybean is relatively sensitive to salinity (Katerji et al., 2003; Taiz and Zeiger, 2002), but is more tolerant compared to Arachis hypogaea, Vicia faba, Vigna unguiculata and Phaseolus vulgaris. Germination and growth of soybean sprouts
significantly decreased when soil ECe was about faba, Vigna unguiculata and Phaseolus vulgaris
respectively (Landon, 1984). Soybean species have different physiological response to salinity stress. Glycine soja is the most sensitive, G. tabacina intermediate and G. tomentella light sensitive to NaCl treatment. Grown under salinity condition for two months, the rate of photo-synthesis, leaf area, and plant biomass of G. soja
were lower than those of the crop planted in the control treatment (Kao et al., 2006). Other studies showed that G. soja was not sensitive to Cl-toxicity compared to G. max, so it might be possible using G. soja to improve tolerance of G. max to salinity (Luo et al., 2005).
Many studies reveals that soybean genotypes respond differently to high Cl content absorbed by the plant. Soybean Genotypes of Williams, Clark and HBK R4924 were catego-rized as the Cl includer on interveinal chlorosis, while the soybean genotypes of S-100, Lee 68 and HBK R5525 were grouped in Cl excluders because there were no symptoms of chlorosis at 120 mM NaCl (Valencia et al., 2008). Increasing concentrations of NaCl up to 8 g l-1 (equivalent to 12 dS m-1) also increased cortical parenchyma and stele in Wilis variety, but it decreased those of Kipas Putih and Lokon varieties (Lubis, 2005).
Soybean genotype tolerant to salinity stress might be developed on saline land. It is necessary to identify critical limits of salinity and some physiological and morphological characteristics of soybean genotypes that could be used as a basis for the development of soybean in saline land. The study aims to determine the critical limits of tolerance, growth and some physiological characteristics of soybean genotypes toward salinity stress conditions. This information will help farmers to develop soybean cuture system Tuber Crops Research Institute, Malang,
Indonesia, from April to August 2013. First experiment was done to obtain critical threshold of tolerance to salinity and growth of several soybean genotypes. Critical salinity level is the level of salinity which can reduce grain yield by 50%. The experiment was designed using a factorial randomized complete block design with three replicates and two treatments. The first treatment was 4 levels of soil salinity, i.e (L1) 0.9 dS m-1, (L2) 4 dS m-1, (L3) 7 dS m-1 and (L4) 10 dS m-1. The second treatment was eleven varieties/ genotypes of soybean, namely (G1) Willis, (G2) Tanggamus, (G3) Echo, (G4) LK/3474-403, (G5) -SU 7-1014, (G6) MLG 2805-962, (G7) MLG 3474-991, (G8) IAC, 100/Bur// Malabar 10-KP-21-50, (G9) IAC, 100/Bur//Malabar 10-KP-27-67, (G10) IAC, 100/Bur//Malabar 10-KP-3075 and (G11) Argopuro//IAC, 100.
The experiment was conducted using a polybag with 500 g soil/pot. Soybean seed was planted until the salt toxicity symptoms. Salinity treatment was done with seawater by diluting it into tap water with electrical conductivity (EC) of about 0.3 dS m-1. The seawater was taken from the South Coast in Malang. Salinity was made with the following composition: (L1) tap water (EC = 0.3 dS m-1) was used as control; (L2, EC = 4 dS m-1): 10% seawater and 90% tap water (L3, EC = 7 dS m-1): 20% and 80% seawater and tap water (L4, EC = 10 dS m-1): 30% sea-water and 70% tap water.
Soil with low salinity levels less than 1.0 dS m-1 was used as a growing medium. Phonska fertilizer was applied when planting with a dose of 300 kg ha-1 as a basic fertilizer. Watering was done by using tap water until it reached field capacity, which was given from planting to V3 phase. Salinity treatment was given after phase V3 by immersing polybags which have been perforated at the bottom (double-pot method) with diluted seawater. The maintenance of plant such as pest control, pathogens and weeds was carried out intensively. Data observations included salt toxicity scores using the method of Dong Lee et al. (2008) and total plant dry weight.
203 Nurul Aini et al.: Growth and Physiological Characteristics of Soybean Genotypes (Glycine max L.)……….
EC 1.52 dS m-1 (as a control) and (2) EC 8:58 dS m-1 (critical point of soybean which was obtained from the first study). The second factor consisted of eleven soybean genotypes as they were tested in the first experiment. Data were collected from morphological and physiological characters. The morphological characters included plant dry weight, yield components, and grain yield. The physiological characteristics observed were absorption of Na, K and Cl leaf and root content. The both of morphological and physiological characters were collected at the same time while research was carried out.
Data were analyzed by analysis of variance using GENSTAT software 15th edition. Data of all characters analyzed at the same time. If there was a significant effect of treatment, the analysis was followed by Least Significant Difference test at 5% level.
RESULTS AND DISCUSSION
Tolerance of Soybean Genotypes to Salinity Stress
Tolerant level of soybean genotypes due to salt toxicity was observed on day 33, 36 and 43 after sowing (DAS) in the first experiment. On 33 DAS, there were no toxicity symptoms found in all varieties/genotypes. Initially, salt toxicity symptoms were observed on 36 DAS as indicated by the leaves which turned into yellow (chlorosis), leaf edges started to burn and stunted the growth of the plant.
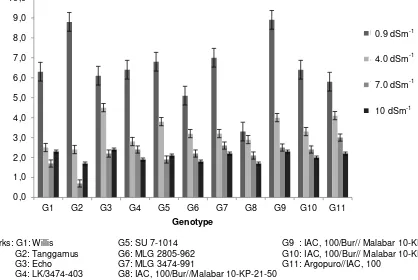
On 36 DAS, varieties Willis (G1) and Tanggamus (G2) had symptoms of toxicity when they were grown on salinity level of 4 dS m-1. At a salinity of 7 dS m-1, symptoms of toxicity were found in most varieties/genotypes. However, at such a salinity level, there were no toxicity symptoms found in genotypes of MLG 3474-991 (G7); IAC, 100/Bur//Malabar 10-KP-21-50 (G8); IAC, 100/Bur//Malabar 10-KP-27-67 (G9); IAC, 100/Bur//Malabar 10-KP-3075 (G10) and Argopuro//IAC, 100 (G11). In salinity level of 10 dS m-1, almost all varieties/genotypes had indicated the toxicity symptoms, except the genotypes of IAC, 100/Bur//Malabar 10-KP-21-50 (G8) and Argopuro//IAC, 100 (G11) (Figure 1).
On 43 DAS observations, some varieties/ genotypes had toxicity symptoms at a salinity level of 4 dS m-1, such as Willis (G1) and Tanggamus (G2) (Figure 1a, 1b.). It seems likely that the IAC, 100/Bur//Malabar 10-KP-21-50 (G8)
and Argopuro//IAC, 100 (G11) genotypes could be classified as tolerant genotypes and slightly tolerant to salinity levels of 7 dS m-1. At 10 dS m-1 salinity, almost all varieties/ genotypes were not able survive except genotype of Argopuro//IAC, 100 (G11), which appeared to be the most tolerant genotype (Figure 1c, 1d) grown on salinity level of 10 dS m-1. These results indicate that theearly vegetative growth can be used to see the response of soybean plants to salinity. It aims for efficiency in screening soybean plants.
Effect of Soil Salinity on Plant Growth
Based of the research plant growth was affected by soil salinity and general condition of planting site. Salinity was disadvantages condi-tion for plant growth and plant development. Genotypes will give specific response to soil salinity but in other side the respond depend on the genetic characters.
http://dx.doi.org/10.17503/Agrivita-2014-36-3-201-209
Figure 1. Effect of salinity levels (L1 = 0.3 dS m-1, L2 = 4 dS m-1, L3 = 7 dS m-1, L4 = 10 dS m-1) on a susceptible varieties: (a) G1 (Variety of Willis) and (b) G2 (Variety of Tanggamus) and tolerant genotypes (c) G8 (IAC, 100/Bur//Malabar 10-KP-21-50) and (d) G11 (Argopuro//IAC, 100)
et a
l.:
G
ro
wth
a
nd
P
hy
sio
lo
gic
al C
ha
ra
cte
ris
tic
s o
f So
yb
ea
n Gen
oty
pe
s (Gl
yc
in
e m
ax
L
205 Nurul Aini et al.: Growth and Physiological Characteristics of Soybean Genotypes (Glycine max L.)……….
Figure 2. Total plant dry weight of soybean genotypes with different salinity level
Figure 3. Seed yield of soybean genotypes with different salinity levels 0,0
1,0 2,0 3,0 4,0 5,0 6,0 7,0 8,0 9,0 10,0
G1 G2 G3 G4 G5 G6 G7 G8 G9 G10 G11
To
ta
l
Pl
a
nt
Dr
y
We
ig
ht
(g
pl
a
nt.
-1)
Genotype
0,9 dS m-1
4,0 dS m-1
7,0 dS m-1
10 dS m-1
0 2 4 6 8 10 12
G1 G2 G3 G4 G5 G6 G7 G8 G9 G10 G11
1.52 dS m-1 8.58 dS m-1
Genotype
Seed
Y
ie
ld
(g
pl
a
nt
-1)
Remarks: G1: Willis G5: SU 7-1014 G9 : IAC, 100/Bur// Malabar 10-KP-27-67 G2: Tanggamus G6: MLG 2805-962 G10: IAC, 100/Bur// Malabar 10-KP-3075
G3: Echo G7: MLG 3474-991 G11: Argopuro//IAC, 100 G4: LK/3474-403 G8: IAC, 100/Bur//Malabar 10-KP-21-50
Remarks: G1: Willis G5: SU 7-1014 G9 : IAC, 100/Bur// Malabar 10-KP-27-67 G2: Tanggamus G6: MLG 2805-962 G10: IAC, 100/Bur// Malabar 10-KP-3075
G3: Echo G7: MLG 3474-991 G11: Argopuro//IAC, 100 G4: LK/3474-403 G8: IAC, 100/Bur//Malabar 10-KP-21-50
0.9 dSm-1
4.0 dSm-1
7.0 dSm-1
10 dSm-1
http://dx.doi.org/10.17503/Agrivita-2014-36-3-201-209 At soil salinity level of 8.58 dS m-1, the
average reduction in seed weight of all genotypes was 88.77%. Grain weight of Willis (G1) and Tanggamus (G2) decreased by 99.22% and 99.13%, respectively. At the same salinity level, seed weight of the tolerant genotypes (IAC, 100/Bur//Malabar 10-KP-21-50 (G8) and Argopuro//IAC, 100 (G11)) decreased by 52.19% and 64.79%, respectively. These results might be consistent with the findings of other studies which imply that elevation levels of NaCl decrease the total dry weight of soybean plants (Wang and Shannon 1999; Valencia et al., 2008; Dolatabadian et al., 2011).
Effects of Soil Salinity on K, Na and Cl Contents of Leaves and Roots
The ionic concentration of shoot or leaf can be used as indicator of plant performance under salinity. This reseach results showed that K, Na
and Cl contents of leaves and roots of soybean were significantly affected by genotype and soil salinity. The means of K, Na and Cl of leaf and root content are presented in Table 1, Table 2 and Table 3, respectively. The results showed that the concentration of K, Na, and Cl in leaf and root tissues of soybean varied with the variety or genotype. In general, the concentrations of K and Na in soybean leaves were higher than those in soybean root tissue (Table 1 and Table 2, respectively).
According to Asch et al. (2000), that leaf ion concentration can be used to distinguish between sodium-includers and sodium-avoiders. High sodium concentrations in the leaf blades indicate includers, and if accompanied by high K/Na ratio, a high potassium uptake. In contrast, sodium avoiders require less potasium to achieve high K/Na ratios in the leaf blades, and therefore have low leaf sodium concentration.
Table 1. Effects of Soil Salinity (dS m-1) on K Uptake of Soybean Genotype
Genotype
K Contents (mg g-1)
Leaves Root
Salinity level (dS m-1)
1.52 8.58 1.52 8.58
Willis (G1) 24.26 a 36.85 fg 18.48 a 29.96 fg
Tanggamus (G2) 32.84 c 36.11 ef 25.86 c 29.72 fg
Echo (G3) 35.11 d 38.85 j 28.36 e 30.78 hi
LK/3474-403 (G4) 35.43 de 37.96 hi 28.68 e 31.41 j
SU 7-1014 (G5) 29.63 b 36.52 fg 21.39 b 29.44 f
MLG 2805-962 (G6) 33.32 c 38.14 ij 26.67 d 30.86 ij
MLG 3474-991 (G7) 35.47 de 40.88 l 28.30 e 34.24 m
IAC, 100/Bur//Malabar 10-KP-21-50 (G8) 38.37 ij 36.47 f 32.06 k 30.09 g IAC, 100/Bur//Malabar 10-KP-27-67 (G9) 38.18 ij 37.30 gh 30.82 ij 30.19 gh IAC, 100/Bur//Malabar 10-KP-3075 (G10) 34.73 d 36.70 fg 28.33 e 30.05 g
Argopuro//IAC, 100 (G11) 40.09 kl 39.89 k 32.67 l 32.55 kl
LSD 5% 2.307 1.258
207 Nurul Aini et al.: Growth and Physiological Characteristics of Soybean Genotypes (Glycine max L.)……….
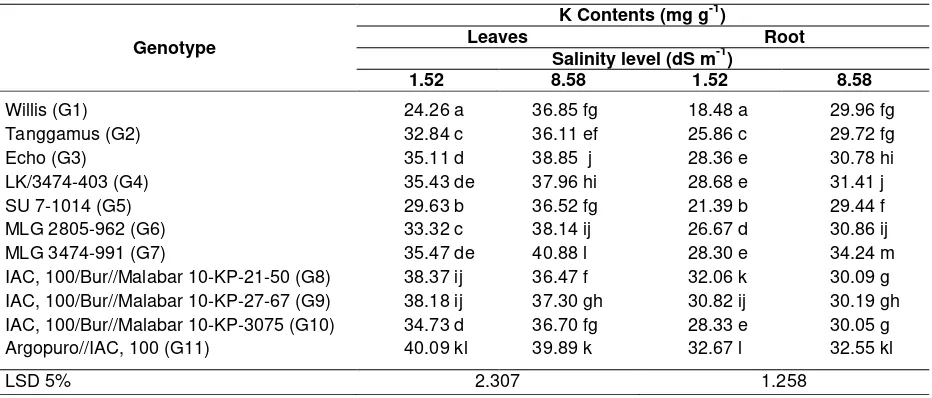
http://dx.doi.org/10.17503/Agrivita-2014-36-3-201-209 The content of K and Na in leaves and roots
of most soybean genotypes/varieties increased as soil salinity increased from 1.52 to 8.58 dS m-1, except for genotype of Argopuro//IAC, 100 (G11). This was slightly different from the results of Safavi and Khajehpour (2007) who reported that an increase in soil salinity increased Na, but decreased K and the ratio of K/Na ratio of aerial parts of both borage and echium plants. In soybean genotypes that were sensitive to saline
conditions (Willis (G1) and Tanggamus (G2)), the concentration of K in the leaves and roots was lower than that of salinity tolerant soybean. The results ralated to the total dry weight of soybean genotype. In soil salinity level of 8.58 dS m-1, the concentration of K in the leaves and roots of Willis (G1) and Tanggamus (G2) was lower than that of Argopuro//IAC, 100 (G11) (the most tolerant genotype).
Table 2. Effects of Soil Salinity (dS m-1) on Na Uptake of Soybean Genotype
Genotype
Na Contents (mg g-1)
Leaves Root
Salinity level (dS m-1)
1.52 8.58 1.52 8.58
Willis (G1) 1.55 a 2.18 de 1.36 a 1.99 de
Tanggamus (G2) 2.07 c 2.17 cde 1.88 c 2.01 de
Echo (G3) 2.24 efg 2.38 hi 2.05 efg 2.06 efg
LK/3474-403 (G4) 2.29 efgh 2.31 fgh 2.07 efgh 2.13 fgh
SU 7-1014 (G5) 1.86 b 2.21 def 1.56 b 1.99 de
MLG 2805-962 (G6) 2.17 cde 2.26 efgh 1.93 cd 2.06 efg
MLG 3474-991 (G7) 2.29 efgh 2.44 i 2.05 efg 2.28 j
IAC, 100/Bur//Malabar 10-KP-21-50 (G8) 2.34 ghi 2.10 cd 2.26 ij 1.97 cde IAC, 100/Bur//Malabar 10-KP-27-67 (G9) 2.45 i 2.23 efg 2.18 hij 2.02 def IAC, 100/Bur//Malabar 10-KP-3075 (G10) 2.24 efg 2.27 efgh 2.02 def 2.04 ef
Argopuro//IAC, 100 (G11) 2.44 i 2.35 ghi 2.16 ghi 2.08 efgh
LSD 5% 0.055 0.043
Remarks: Mean values within the same column followed by the same letter do not differ significantly (0.05 level) according to the LSD test
Table 3. Effects of Soil Salinity (dS m-1) on Cl Uptake of Soybean Genotype
Genotype
Cl Contents (mg g-1)
Leaves Root
Salinity level (dS m-1)
1.52 8.58 1.52 8.58
Willis (G1) 1.11 a 1.54 cde 1.19 a 1.62 cde
Tanggamus (G2) 1.47 c 1.54 cde 1.54 c 1.63 cdef
Echo (G3) 1.58 efgh 1.67 ijk 1.65 defg 1.65 defg
LK/3474-403 (G4) 1.62 efghi 1.63 fghij 1.67 defg 1.71 efgh
SU 7-1014 (G5) 1.33 b 1.56 def 1.31 b 1.61 cd
MLG 2805-962 (G6) 1.48 cd 1.59 efghi 1.58 cd 1.65 defg
MLG 3474-991 (G7) 1.62 efghi 1.71 jk 1.65 defg 1.81 h
IAC, 100/Bur//Malabar 10-KP-21-50 (G8) 1.65 ghijk 1.48 cd 1.80 h 1.61 cd IAC, 100/Bur//Malabar 10-KP-27-67 (G9) 1.71 jk 1.57 efg 1.75 gh 1.63 cdef IAC, 100/Bur//Malabar 10-KP-3075 (G10) 1.58 efgh 1.57 efg 1.63 cdef 1.65 defg
Argopuro//IAC, 100 (G11) 1.72 k 1.66 hijk 1.73 fgh 1.67 defg
LSD 5% 0.024 0.035
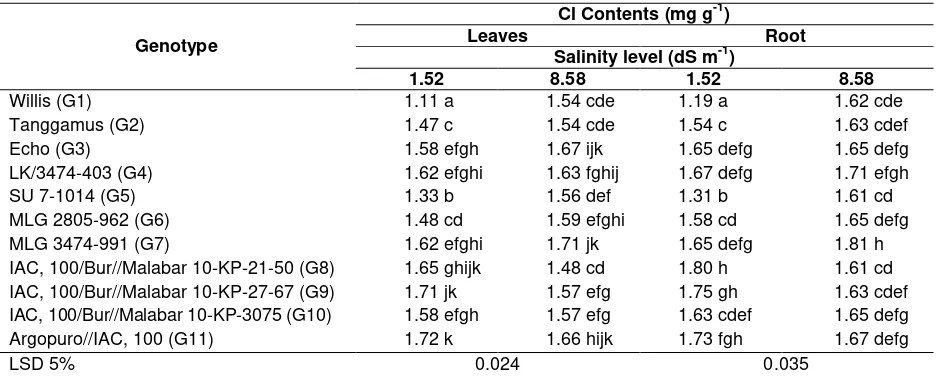
http://dx.doi.org/10.17503/Agrivita-2014-36-3-201-209 Na concentration in the leaves and roots of
the sensitive soybean genotypes increased, whereas the concentration tended to decrease in the tolerant genotypes. Similarly, at soil salinity level of 8.58 dS m-1, the concentration of Cl- in sensitive soybean genotypes tended to absorb more Cl- than that of tolerant genotypes (Table 3). Asch et al. (1997) stated that cultivars may absorb the same high amount of sodium in the leaves, but differ strongly in potassium status of the leaves and the yield loss.
CONCLUSION
Wilis (G1) and Tanggamus (G2) could be classified as susceptible varieties to soil salinity. The genotypes of IAC, 100/Bur//Malabar 10-KP-21-50 (G8) and Argopuro//IAC, 100 (G11) were grouped as tolerant and medium tolerant to the salinity level of 12.68 dS m-1. At salinity level of 18.82 dS m-1 all varieties / genotypes were not able to survive except G11 (Argopuro//IAC, 100). At salinity levels of 3.91 dS m-1, total dry weight of plant varieties/genotypes decreased by 48.14%, while the levels of salinity of 12.68 dS m -1
total dry weight of plant varieties/genotypes decreased by 64.89%. Concentrations of K and Na in soybean leaves were higher than those in soybean root tissue. The content of K and Na in leaves and roots of most soybean genotypes or varieties increased as soil salinity increased from 1.52 to 8.58 dS m-1, except for genotype of G11 (Argopuro//IAC, 100).
ACKNOWLEDGMENT
This research was funded by Directorate of Higher Education through the Competitive Research Grant Program for Decentralization Research University of Brawijaya with contract number: 551 131/UN10.21/PG/2013.
REFERENCES
Aini, N., E. Mapfumo, Z. Rengel and C. Tang. 2012. Ecophysiological responses of Melaleuca species to dual stresses of water logging and salinity. International Journal of Plant Physiology and Biochemistry 4 (4): 52 – 58.
Asch, F., M. Dingkuhn, and K. Dӧrffling. 1997. Physiological stresses of irrigated rice caused by soil salinity in the Sahel. In:
K.M. Miezan, M.C.S. Wopereis, M. Dingkuhn, J. Deckers and T.F. Randolph (Eds,), Irrigated Rice in the Sahel. Prospects for Sustainable Development, p.247-273. West Africa Rice Development Association, Bouake,
Ashraf, M. and M.R. Foolad. 2007. Improving plant abiotic-stress resistance by exogenous application of osmoprotectants glycine-betaine and proline. Environ. Exp. Bot. 59: 206-216.
Ashraf, M. 2009. Biotechnological approach of improving plant salt tolerance using antioxidants as markers. Biotechnol. Adv. 27: 84–93. 2005. Understanding and improving salt tolerance in plants. Crop Sci. 45: 437-448.
Dolatabadian, A., S.A.M. M. Sanavy and F. Ghanati. 2011. Effect of salinity on growth, xylem and anatomical charac-teristics of soybean. Not. Sci. Biol. 3: 41-45.
Dong Lee, J., S.L. Smothers, D. Dunn, M. Villagarcia, C.R. Shumway, T.E. Carter Jr., and J.G. Shannon. 2008. Evaluation of simple method to screen soybean genotypes for salt tolerance. Crop Sci. 48: 2194-2200.
Greenway, H and R. Munns. 1980. Mechanism of salt tolerance in non-halophyte. Ann Rev Plant Physiol 31: 149-190.
Katerji, N., J.W. van Hoorn, A. Hamdy and M. Mastrorilli. 2003. Salinity effect on crop development and yield, analysis of salt tolerance according to several classification methods. Agricultural water Management (63): 37-66.
209 Nurul Aini et al.: Growth and Physiological Characteristics of Soybean Genotypes (Glycine max L.)……….
Landon, J.R. 1984. Booker tropical soil manual. A handbook for soil survey and agricultural land evaluation in the tropics and subtropics. Longman Inc. New York. USA. pp. 230.
Leigh, R.A. and R.G.W. Jones. 1984. A hypothesis relating critical potassium concentrations for growth to the distri-bution and functions of this ion in the plant cell. New Phytol. 97: 1-13.
Luo, Q.Y., B.J. Yu and Y.L. Liu. 2005. Differential sensitivity to chloride and sodium ions in seedlings of Glycine max
and G. soja under NaCl stress. Journal of Plant Physiology. 162: 1003-1012 Lubis, K. 2005. Ultrastructural morphology of
embryos cultured roots of some varieties of soybean (Glycine max L. Merr) at various concentrations of NaCl. (in Indonesian). J. llmiah Pert. Kultura. 40 (2): 84-88.
Rachman, A., I.G.M., Subiksa and Wahyunto. 2007. The expansion of soybean acreage of land to be suboptimal. (in Indonesian). In Sumarno, Suyamto, A. Widjono, Herman, H. Kasim (Editor) Soybean production techniques and development. AARD. Puslitbangtan. p.185-204.
Taiz, L. and E. Zeiger. 2002. Plant physiology, third edition. Sinauer Associates. pp. 690.
Valencia, R., P. Chen, T. Ishibashi and M. Conatser. 2008. A Rapid and Effective method for screening salt tolerance in soybean. Crop Sci (48) Sept-Oct 2008: 1773-1779.

![Similarity:Phosphorus and Boron Application on Growth, Yield, and Quality of
Soybean Seeds (Glycine max [L.] Merril)](data:image/gif;base64,R0lGODlhAQABAIAAAP///wAAACH5BAEAAAAALAAAAAABAAEAAAICRAEAOw==)