Contents lists available atScienceDirect
Case Studies in Thermal Engineering
journal homepage:www.elsevier.com/locate/csite
Study on the performance of natural vacuum desalination system
using low grade heat source
Himsar Ambarita
Mechanical Engineering, University of Sumatera Utara, Jl. Almamater, Medan 20155, Indonesia
A R T I C L E I N F O
Keywords: Desalination Vacuum Natural Low Grade Heat
A B S T R A C T
In the present work characteristics and performance of a natural vacuum desalination system using low grade heat source is studied numerically and experimentally. In the numerical work, a program to solve the governing equations in forward time step marching technique is developed. In the experimental work a lab scale natural vacuum system using electric heater as a heat source is designed and tested. The surface area of seawater in the evaporator is 0.5 m. The numerical and experimental results show a good agreement. By using numerical simulations effect operating conditions such as heat source temperature, condenser temperature, heating coil surface area, and the present of heat recovery unit are explored. The simulation showed that, the present system with evaporator surface area of 0.2 m2, operation time of 9 h and source
temperature of 80 °C will produce 6.63 L of fresh water ant thermal efficiency is 70.4%. The main conclusion can be drawn here is that the performance of the natural vacuum desalination system is mainly affected by maximum temperature in evaporator and minimum temperature in condenser. On the other hand, the surface area of heating coil and the heat recovery unit showed only a small effect.
1. Introduction
Demand for fresh water is increasing due to industrialization, life standard, depletion of natural resources, etc. According to United Nation Organization that by the year of 2025, almost 1800 million people around the world will be under severe water scarcity[1]. Desalination of seawater can be used tofill this demand. The desalination system is not a new technology. In the present, many regions in world such as countries in the Middle East, Arabic countries, North America, some of Asian countries, Europe, Africa, Central America, South America and Australia have been doing desalinations to meet their need on fresh water[2]. There several methodologies of desalination such as multi-stageflash, multi-effects distillation, vapor compression, reversal osmosis, and electro-dialysis are already known. The conventional desalination systems in services mainly use fossil fuel. According to a study by Kalogirou[3], about 10,000 t of fossil fuel was burn to power desalination systems in the world.
Those facts motivate researchers to perform research on desalination systems in order to develop a more efficient system and or to enhance the using of renewable resources or waste heat[4]. Renewable energy resources that usually used to power desalination are solar energy, wind power, and geothermal energy. Among these three, the most used is solar energy which is up to 57%[2]. It is predicted that in the future, desalination powered by solar energy (named as solar desalination), will be more popular. Even the countries with big oil producer such as Saudi Arabia are enhancing the use of solar energy to power their desalination systems in order to develop the sustainable desalination system. Several researchers have published their work on the innovations of desalination powered by renewable and waste heat. Gude et al.[5]reported a feasibility study of a new two-stage low temperature
http://dx.doi.org/10.1016/j.csite.2016.09.005
Received 11 July 2016; Received in revised form 16 August 2016; Accepted 9 September 2016 E-mail address:[email protected].
desalination. Thefield test results showed that the two-stage desalination process has potential for standalone small to large scale applications in water and energy scarce rural areas with specific energy consumption of 15,000 kJ/kg of fresh water. If it is operated by solar energy the desalination costs are less than $ 7/m3fresh water. Li et al.[6]proposed a system that combines multi effect
distillation desalination with a supercritical organic Rankine Cycle and an ejector. Their system works like a combined heat, power and condensation. The thermal performance of the system is analyzed theoretically. The results show overall exergy efficiency close to 40% for salt concentration of 35 g/kg using a low temperature heat source at 150 °C.
Araghi et al.[7]reported an analytical study on the performance of a new combined vacuum desalination and power system as a heat recovery. The system is claimed can run on waste heat and an organic workingfluid. The results show that the overall performance of the introduced system is comparable with the discharge thermal energy combined desalination system utilizing ammonia mixture. However in term of desalination, the proposed system produces more fresh water. Gao et al.[8]performed an experimental study on water separation process in a novel sprayflash vacuum evaporator with heat-pipe (HP). Parametric studies are carried out, such as cold source and heat source temperature, spray temperature, and sprayflow. The results show that the maximum heatflux density reaches 32 W/cm2on evaporator bland plate. The HP absorbs energy effectively from low grade heat
source then transfer the energy to the droplets alreadyflashed, so as to maintain or even increase the superheat degree of droplets during the evaporation process. Some conclusions of the study are the heat source temperature is determinant of fresh water yield. The higher heat source temperature is the more heat that droplets can obtain and the faster evaporation process will be. And the cooling water temperature is an important factor of fresh water yield. Dow et al.[9]report an experimental study on a pilot plant of direct contact membrane distillation (DCMD) driven by low grade waste heat: membrane fouling and energy assessment. The pilot plant was located at a gasfired power station which provided the heat source (lower than 40 °C) and waste water to the DCMD system with 0.67 m2of membrane area. Based on the available energy for a continuously operating 500 MW (electric) rated power station, the treatment potential was estimated at up to 8000 kL/day.
Christ et al.[10]report a study on the comparison of a boosted multi-effect distillation (MED) for sensible low-grade heat source with feed pre-heating multi-effect distillation. The results show that for most operational conditions germane to sensible waste heat source and renewable energies, the boosted MED system offers both thermodynamic and economic superior performance, especially when low heating media temperatures prevail. Gude[11] discusses current energy storage options for different desalination technologies using various renewable energy and waste heat source with focus on thermal energy storage system. Bundschuh et al. [12]identify different types and low-cost low-enthalpy (50–150 °C) geothermal heat sources and evaluate their potentials and their suitability for water desalination and treatment using conventional technologies for different scales and situation. The results suggest that geothermal option is superior to the solar option if low-cost geothermal option is available because it provides a constant heat source in contrast to solar. Ciocolanti et al.[13]performed an experimental study on the performance behavior of small scale single effect thermal desalination plant. The prototype consists of a 1 kWe Stirling engine coupled with a single effect thermal desalination plant for the simultaneous production of electricity and > 150 L/day of fresh water.
One of the promising solar desalination is natural vacuum desalination system. In the system seawater is placed in a container which is vacuumed naturally by using the gravity of the water. The advantage of using the vacuum is that a low grade heat source such as solar energy can be used efficiently. Several researches of natural vacuum desalination have been reported in literature. Al-Kharabsheh and Goswani[14,15]reported the research on preliminary experimental and theoretical analysis of a natural vacuum water desalination system using low-grade solar heat. The effects of several various operating conditions were studied. Simulation for Gainesville, Florida, the daily output from a system of 1 m2of evaporator area with 1 m2of solar collector area could reach 6.5 kg
fresh water. In order to increase the performance of the natural vacuum desalination system several modifications have been proposed. Gude et al.[16]reported a study on vacuum desalination system and it was coupled with solar collector of 18 m2and
thermal energy storage with a volume of 3 m3. The system is capable of producing 100 L/day fresh water. Gude and Nirmalakandan [17]use the same solar desalination system and combined it with a solar-assisted air-conditioning system. The results showed that cooling capacity of 3.25 kW and distillate yield of 4.5 kg/hour can be obtained. Maroo and Goswani[18]proposed natural vacuum flash desalination system operation using in single stage mode and two stage mode. With a solar collector of 1 m2area, the proposed
system produces nearly 5.54 kg and 8.66 kg of distillate while operating in single stage and two stage modes with a performance ratio of 0.748 and 1.35, respectively. Ayhan and Al-Madani[19] proposed a natural vacuum desalination that consists of evaporator column exposed to solar radiation and shaded condenser column. Here a blower is proposed to move the vapor from evaporator to condenser.
Those reviewed studies showed that study on the desalination has come under scrutiny. Among those desalination technologies, the present paper focuses on the natural vacuum system. However, the performance of the natural vacuum solar needs to be increased. Thus several modifications are extremely needed. To propose a good modification the mechanism and characteristics of the natural vacuum desalination should be explored more. In this work numerical and experimental study on a lab scale natural vacuum desalination will be carried out. The main objective is to explore the operational characteristics of the natural vacuum desalination system. The numerical method will be used to perform a case study in order to explore the main parameter that affect the performance of the system. The results of the present study are expected to supply the necessary information in the developing high performance solar desalination system.
2. Problem formulation
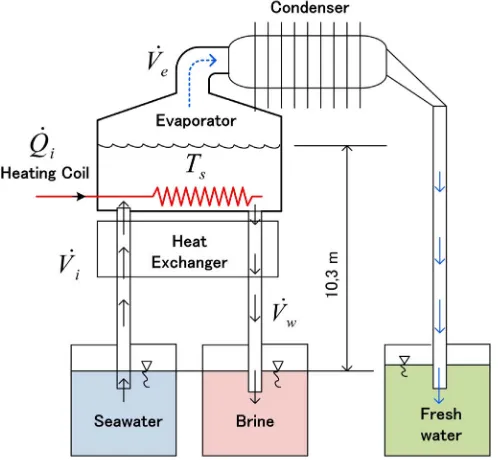
easy control of the heat input, in this study it is replaced by an electric heater. In can be seen from thefigure, in order to get natural vacuum in the system the evaporator and condenser will be placed at a location 10.3 m above the water level of seawater tank. When the electric heater supplies an amount of heat into the evaporator, the seawater temperature will raise. It results in evaporation of water with a rate ofVė [m3/s]. The vapor will be condensed in the condenser and becoming fresh water. Since the water content
decreasing, salinity of seawater in the evaporator will increase. The increasing salinity of seawater will decrease the evaporation rate in the evaporator. To avoid this, brine water in the evaporator will be withdrawn with a rate ofVẇ [m3/s]. Thus the new seawater will
be injected to the evaporator with a volume rate ofVi̇[m3/s]. As a note, the withdrawn brine water will be at a temperature equal to
evaporator. It is necessary to recover the heat from it. The recovered heat will be used to heat the seawater injected to the evaporator. Here a heat exchanger will be installed. The type of the heat exchanger is annulus counterflow. The seawater willflow in the inner tube and the withdrawn brine water will be in the annular space.
2.1. Governing equations
In order to simulate the characteristics and performance of the system, the governing equations will be developed. The mass conservation in the evaporator will give:
d
dt(ρV) =s ρ Vi i̇ −ρ Vw ẇ −ρ Ve ė (1)
whereV[m3] andρ[kg/m3] is volume and density of seawater in the evaporator, respectively. The subscripts ofs,i, anderepresent
seawater, injected, and evaporation, respectively. Solute conservation in the evaporator gives the following equations: d
dt(ρCV) = (s ρC V) ̇ − (i i ρC V) ̇s w (2)
whereC[%] is the solute concentration. It is assumed that no stratification of the seawater temperature in the evaporator. Thus, conservation of energy in the seawater gives the following equation:
d
dt(ρc VTp ) = ̇ + (s Qin ρc T Vp ) ̇ − (i i ρc T Vp ) ̇ − ̇ − ̇s w Qe Qwall (3)
where,Q̇in[Watt] andcp[J/kgK] is the heat transfer rate from heater and specific heat capacity, respectively. In the present study,
the heater is made of cylindrical heater and it is immersed horizontally into the seawater. Heat transfer from the electric heater to the seawater is assumed to be free convection and give by:
Q Nu k
DA T T
̇ = ( − )
i sur s
h
sur sur s
(4) whereDh[m],Asur, andTsuris diameter, surface area, and surface temperature of the heater. The Nusselt number on the heater
surface is given by[20]:
Nu = 0.6 + 0.387Ra
where Pr is Prandtl number. The Rayleigh number is calculated using equation:
Ra ρgβ T T D The heat evaporation in the evaporator can be calculated using the following equation:
Q̇ =e ρV hė fg (7)
wherehfg[J/kg] is latent heat evaporation of seawater.
In the present study, the evaporator material temperature is divided into bottom, side wall and top wall. The heat capacity of the evaporator material is taken into account. The energy conservation in the bottom plate of the evaporator gives:
t ρc T where the subscriptbandarefer to bottom of the evaporator and ambient air, respectively. While, the subscriptiandorefer to inside and outside surfaces, respectively. AndLis the characteristic length of the surface. The Nusselt number on the inside surface (Nub i,) and outside (Nub o,) of the bottom plate are calculated by the following equations, respectively[21,22]:
Nub i, = 0.27RaLb1/4 (9)
Nub o, = 0.15RaLb1/3 (10)
Application of the energy conservation to the side wall of the evaporator gives the following equation:
t ρc VT where the subscriptdrefers to side wall of the evaporator. The Nusselt number on outer surface of the wall (Nd o, ) is given by[20].
N = 0.68 + 0.67Ra
The same equation will be used to calculate the Nusselt number on the inner surface of the wall (Nud i,), but with differentfluid properties. Here, the seawater properties will be used. Application energy conservation to the top wall of the evaporator gives:
t ρc VT where the subscripttrefers to top wall. As a note,fluid in the inside the top wall is water vapor (shown by subscriptv) at a pressure close to vacuum. The properties of the vapor at low temperature will be used to calculate the Nusselt number on the inner surface of the top wall (Nut i,). Even though the top wall is a conical surface, here it is assumed to be horizontal wall. The Nusselt numbers on the inner and outer surfaces of top wall are calculated using the following equations, respectively.
Nut i, = 0.15RaLt1/3 (14)
Nut,0= 0.27Ralc1/4 (15)
The condenser used in this study is a horizontal tube with circular fins. It is assumed all of vapor at temperature ofTs is
condensed into fresh water at temperatureTf which is equal to condenser inside temperature of the (Tc i,). The inside temperature of the condenser is strongly affected by ambient temperature. The following equations are used to calculate the temperature inside the condenser. Application of the energy conservation gives:
ρV h πl k T T
where the subscriptcrefers to condenser andris the radius of the condenser. The modified latent heat of condensationh*fg[J/kg] is
given by[23]:
h* =fg hfg+ 0.68cpf( −Ts Tf) (17)
The heat transfer rate from the surface of the condenser will be used to calculate outside surface temperature of the condenser. Q̇ = [c hco tip, NAf tip f, η +h NAco f sides f, η +h Aco base] (Tco−Ta) (18)
whereQ̇cis heat transfer rate from the condenser. The subscript f,tip, andbaserefer tofin, tip surface, and base surface of the
condenser.
evaporator is given by:
where the subscript0and min refer to initial condition of the seawater and minimum value of heat capacity of thefluid stream. The effectiveness of the counterflow heat exchanger (ε) is calculated by:
ε UA ρVc C
whereU[W/m2K],A[m2], andCris overall heat transfer coefficient, heat transfer surface area and ratio of maximum and minimum
heat capacity offlow in the heat exchanger.
2.2. Evaporation rate
The evaporation rate between two chambers, one contains seawater and the other fresh water, which is connected via a vacuum channel, it can be calculated by equation proposed by Bemporad[24].
V A α
empirical coefficient which is developed from experiments. Al-Kharabsheh and Goswani[15]suggested the following value. α
10 ≤−7 m≤ 10−6 (22)
In this study, several calculations and experimental data are used to develop a suitable value ofαm. The value ofαm=9×10⁻⁹is
suitable for the present experiments and simulation. Thus this value will be used for all simulations. Vapor pressureP[Pa] as a function of temperature is given by[14]:
P T( ) = 100 × exp[63.042 − 7139.6/( + 273) − 6.2558 ln( + 273)]T T (23) The correction factor of f C( )is calculated using the following equation:
f C( ) = 1 − 0.0054C (24)
2.3. Performance parameters
As a note the objective of natural vacuum desalination is to produce fresh water by using energy efficiently. Based on this objective, two parameters to show the performance of the system will be used. Thefirst parameter is amount of fresh water produced which is calculated using the following equation.
∫
whereVtoṫ [m3] andtend[s] is the total volume of the fresh water produced and time at the end of experiment/calculation. The secondparameter is thermal efficiency which is defined as ratio of useful energy to energy input.
∫
The governing equation, in the differential equation form, will be solved by a forward time step marching technique. The governing equations, Eqs.(2), (3), (8), (11)and(13), will be converted into the following equations, respectively.
T T t In the above equations, the superscript j refers to the present value and j+ 1is the value at the next tie step. Due to stability consideration the values ofΔt must be relatively low. In all simulation, the value ofΔt=1 s is used. This value shows stability.
The transport properties of thefluid are treated as a function of temperature and for seawater it is a function of temperature and solute concentration. The equations suggested by Sharqawy et al.[25]are used to calculate transport properties of seawater. The density of sea water is calculated by equations proposed by Bromley[26].
ρs= 1000(A F1 1+A F2 2+A F3 3+A F4 4) (32) The specific heat capacity of the seawater is given by[17]:
cp s, =A1+A T2( + 273) +A T3( + 273) +2 A T4( + 273)3 (33)
Thermal conductivity of the sea water is calculated by equation proposed by Jamieson and Tudhope[27].
k C C Dynamic viscosity is calculated using the correlation proposed by Isdale et al.[28].
μs=μf(1 +A C1 +A C2 2) (35)
where A1= 1.474 × 10 + 1.5 × 10⁻³ −5T− 3.927 × 10⁻⁸ 2T , A2= 1.073 × 10 − 8.5 × 10⁻⁵ −8T+ 2.23 × 10⁻¹⁰ 2T, and μf is dynamic
viscosity of pure water which is calculated by equation proposed by Korosi and Fabuss[29].
μ
T ln( ) = −10.7019 + 604.129
139.18 +
f (36)
A FORTRAN code program is written to solve the transient governing equations which are coupled with all of the heat transfer equations and thermal properties equations.
3. Experimental apparatus
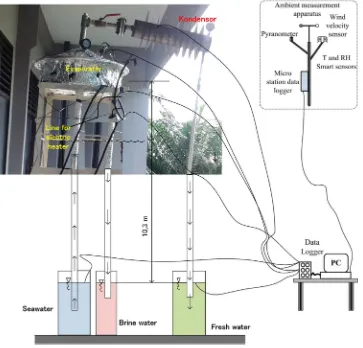
In order to perform a better analysis experiments are also carried out. An experimental apparatus consists of a lab scale natural vacuum desalination is designed and fabricated. Evaporator of the system is a hollow cylinder with conical cover on the top made of Stainless steel 304 with a thickness of 5.8 mm. The diameter and the height of the evaporator are 500 mm and 150 mm, respectively. The height of the conical top is 120 mm. In all experiments the depth of seawater in the evaporator is 80 mm. The condenser is a horizontal circular tube with circularfins and also made of Stainless steel 304 with a thickness of 2.54 mm. The inside diameter and the length of the condenser is 100 mm and 500 mm, respectively. The number offin is 10fins with a diameter and thickness of 254 mm and 0.6 mm, respectively. The distance betweenfins is 40 mm. The condenser and evaporator are connected by using a flange with a diameter and thickness of 128 mm and 15 mm, respectively. The evaporator and condenser are placed at a location 10.33 m above the ground. The containers for seawater, withdrawn brine water, and fresh water are placed on the ground. As a note the experiments are carried out on the top of a building in Medan city with an elevation of 20 m above the sea level.
Data acquisition system is also installed to the experimental apparatus. Temperatures are measured by using J-type thermocouples with uncertainly equal to 0.1 °C. The number of thermocouple is 20, which are four thermocouples placed in the evaporator, four in the condenser, four in the heat exchanger and the rests in pipe and water containers. Agilent 34972, multi channel data logger is used to record temperatures with interval of 1 min. Solar radiation is measured using HOBO pyranometer smart sensor. The ambient temperature and relative humidity (RH) is measured using HOBO temperature RH smart sensor with an accuracy of 0.2 °C and ±2.5% RH, respectively. The wind speed around the experimental apparatus is measured with HOBO wind speed smart sensor with accuracy±1.1 m/s. The schematic diagram, data acquisition system, and photograph of the experimental apparatus are shown inFig. 2.
To start up the system, it will be filled completely with water initially, and the water will then be allowed to fall under the influence of gravity, in order to establish the vacuum. The extraction rate of the brine water from the evaporator is controlled at a rate of 0.36 l per hour by using a valve.
4. Results and discussions
By using the program developed and experimental apparatus simulations and experiments are carried out. Three days of experiments are carried out. Every experiment performed for 8 h, it starts at 9.00 andfinishes at 17.00 of local time. In the experiments the electric heater is used to keep temperature in the evaporator at 50 °C. Here, the main objective of the experiments is to validate numerical simulations. The experimental data and numerical simulations are compared.
4.1. Numerical validations
Temperature history of the seawater inside the evaporator and the ambient temperature are shown inFig. 3. Thefigure shows that the ambient temperature starts from a minimum temperature and it increases gradually as time increases until at 14.30. After this, the ambient temperature decreases as time decreases. The minimum, maximum and the average ambient temperature is 25.96 °C, 31.49 °C, and 29.07 °C, respectively. In the beginning of the experiment, temperature of the seawater is 26 °C. It increases
significantly as time increases and reaches the maximum value of 50 °C at 9.45. Since the electric heater is set at 50 °C, the heater will be offand the heat input to the evaporator will be zero. During the absence of heat input, the temperature of the seawater will be decrease gradually. This is due to heat loss to the ambient and the heat for evaporation. After the temperature down to about 45 °C, the electric hater will be on again and the temperature will increase gradually to reach 50 °C and the heater will be offagain. The figure shows this phenomenon repeats 4 times in every experiment. This fact reveals that there is a temperature swing in the evaporator during experiments due to control mechanism of the electric heater.
Temperature history of the seawater from numerical simulation is also shown in thefigure. It can be seen that in the beginning the temperature increase significantly until reach the maximum value of 50 °C. After this, the temperature will be constant in the rest of the experiment. The comparison of temperature history from the experimental results and the numerical one shows some small discrepancies. It can be said that numerical and experimental results agree well. Temperature history from the other experiments also shows the same trend, but not shown in here.
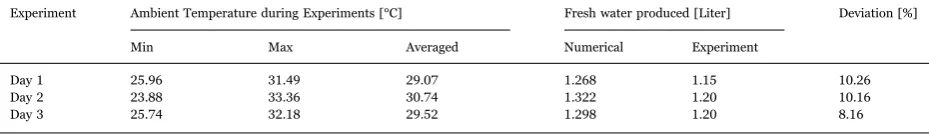
The fresh water produced is collected in a container and measured at the end of experiment. The fresh water resulted from three days of experiments are shown inTable 1. In the table the maximum, minimum, and averaged temperatures for every experiment are also shown. The fresh water produced is also calculated numerically and the results are also shown in the table. The table suggests that experimental and numerical results show small discrepancies. The difference varies from 8.16% to 10.26%. It can be said that numerical and experimental results agree well.“In addition, Al-Kharabsheh and Goswani[14,15]reposted that their proposed system can reach 6.5 kg/day.m2evaporator area. Gude et al.[16]reported their natural vacuum solar desalination system
can produced 6.5–7 kg of fresh water by using 1 m2evaporator and 1 m2solar collector areas. In the present work the averaged
productivity of the system in every 1 m2 evaporator area is 6.6 kg/day.m2. These results are comparable to those previous researchers”. Based on the above facts, present numerical method can be used to perform the case study.
4.2. Characteristics of the system
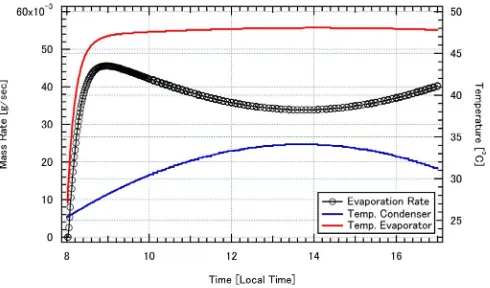
In order to explore the characteristics of the desalination system, temperature, heatflow, evaporation rate, and thermal efficiency will be discussed. A case with the heaterfixed at temperature of 50 °C is simulated. The measured ambient temperature is employed as ambient conditions to calculate temperature of the condenser and the heat loss from the evaporator. The simulation starts at 8.00 andfinishes 17.00 of local time. The seawater temperature, condenser temperature, and evaporation rate are shown inFig. 4. The figure shows that temperature of the condenser increases as time increases until about 14.00. After this, the temperature decreases as time increases. This suggests that condenser temperature strongly affected by ambient temperature. In other words, ambient and condenser temperatures show the same trend.
Thefigure also shows that in the beginning, the seawater temperature increases significantly to reach its maximum value and finally constant at 48 °C. This is known as temperature equilibrium. As a note, in this simulation temperature of the heater isfixed at 50 °C. The maximum seawater temperature is lower than 50 °C. This temperature difference is a driving force of the heat transfer from heating coil and the seawater. In thefigure, the evaporation rate is shown by black line with circle marks. Thefigure shows that, the evaporation rate increase significantly in the beginning. This is because the seawater temperature increases significantly. At the same time, the condenser temperature is still low. These two factors make the evaporation rate increases significantly. After reaching
Fig. 3.Temperature history of seawater in evaporator and ambient temperature.
Table 1
Fresh water produced experimentally and numerically.
Experiment Ambient Temperature during Experiments [°C] Fresh water produced [Liter] Deviation [%]
Min Max Averaged Numerical Experiment
Day 1 25.96 31.49 29.07 1.268 1.15 10.26
Day 2 23.88 33.36 30.74 1.322 1.20 10.16
its maximum value, the evaporation rate decreases gradually until reaching a minimum value at 14.00. This is because the condenser temperature increases gradually and at that time temperature of the evaporator already constant. After reaching its minimum value, the evaporation rate will increase gradually as time increases. This is due to decreasing condenser temperature while seawater temperature in evaporator is constant already. These facts reveal that evaporation rate affected by seawater temperature in evaporator and condenser temperature. The higher evaporator temperature is the higher evaporation rate. The lower condenser temperature is the higher evaporation rate.
The history of heat injected to the seawater, heatflux from the seawater to the evaporator material (named as heat out), and thermal efficiency are shown inFig. 5. The heat out includes heat capacity of the evaporator material and heat loss to the ambient. Thefigure shows that heat injected to the system and heat out show the same trend. In the beginning, they decrease significantly as time increases. After reaching the seawater temperature equilibrium, they decrease gradually as time increase. After 14.00, both the heat injected and the heat out increase gradually. This is due to decreasing ambient temperature. In thefigure thermal efficiency of the system is shown by blue line. The thermal efficiency can be viewed as ratio of useful energy to energy input to the system. The figure shows that, during simulation thermal efficiency of the system increases as time increases. In the beginning it increases significantly due to increasing evaporation rate. For the rest, the efficiency increase very slow. The increasing value of thermal efficiency is caused by increasing value of evaporation rate. Thisfigure clearly shows that in the beginning thermal efficiency is relatively lower. But after reaching the steady state condition it is relatively constant at a higher value. This because in the beginning the heat injected is mainly used to heat the evaporator material and the seawater in the evaporator.
Fig. 6shows the heat loss from the evaporator wall to the ambient. The heat loss is divided into heat loss from the bottom, heat loss from the side wall, and heat loss from the conical top of the evaporator. Here is mentioned again, the heat loss include in the heat out from the system. The comparison of heat out from the system (shown by black circle marked inFig. 5) and total heat loss shown inFig. 6reveals that, the amount of energy to heat the evaporator material is very significant, in particular, in the beginning. After reaching the equilibrium temperature, the heat out almost similar with the heat loss. The comparison of heat loss from the bottom, side, and top wall reveals that the heat loss from the side wall is bigger than bottom and the top wall. The lowest heat loss is from the top of the evaporator. This is mainly because the water vapor in the top part of the evaporator is very rare or close to vacuum. The heat loss in the beginning increases significantly. This is because the temperature increases significantly while the ambient temperature is still lower. After reaching the equilibrium temperature, the heat loss decreases slowly until 14.00. Again after
Fig. 4.Temperatures of the system and evaporation rate with heaterfixed at 50 °C.
this, the heat loss increases again but slowly. This is because ambient temperature decreases slowly. It can be said that the main heat loss from the system is from the side wall and followed by the bottom wall.
4.3. Effects of the heat source temperature
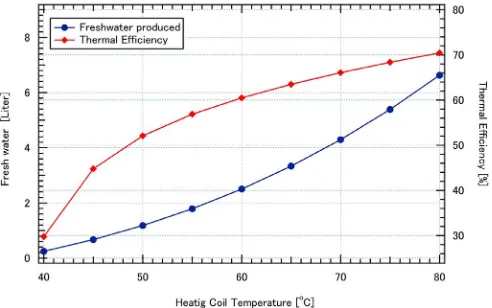
A case study is performed in order to explore effects of several parameters to the performance of the system. There are two performance parameters will be used in this case study. Thefirst parameter is the total volume of fresh water produced by the system. The more fresh water produced is the better performance. The second one is thermal efficiency. This parameter shows how efficient the energy input used to produce fresh water. The higher thermal efficiency is the better performance. As mentioned above, the present system is designed to be heated by a solar collector. Working temperature of a solar collector is very important. Thus the effect of the heater temperature should be explored. Thus performance of the system at different heater temperature is simulated. In the simulation, ambient temperature from the measurement will be imposed as boundary conditions. Temperature of the heater will be varied from 40 °C to 80 °C. The simulation will be started at 8.00 andfinished at 17.00 of local time. Thermal efficiency and fresh water produced are shown inFig. 7. Thefigure shows clearly that heating coil temperature strongly affects the performance of the system. The higher heating coil temperature can produce more fresh water with a higher thermal efficiency. However the rate of efficiency and fresh water improvement decreases as heating coil temperature increases. For instance, if heating coil temperature increases from 50 °C to 55 °C, the fresh water produced and thermal efficiency increase from 1.182 to 1.789 L and from 52.09% to 56.87%, respectively. This suggests that improvement of fresh water and thermal efficiency is 51% and 9.17%, respectively. And if heating coil temperature increases from 55 °C to 60 °C, the fresh water produced and thermal efficiency increase from 1.789 to 2.503 L and from 56.87% to 60.49%, respectively. This suggests that improvement of fresh water and thermal efficiency is 39.9% and 6.36%, respectively. These values reveal that the improvement decreases as heater temperature increases. In this simulation the maximum thermal efficiency and fresh water produced can be reach is 70.44% and 6.63 L, respectively. These facts reveal that the maximum temperature in the evaporator plays an important role of the system performance.
4.4. Effects of the condenser temperature
A simulation has been performed in order to explore effects of the condenser temperature to the performance of the system. In the simulation heating coil temperature isfixed at 50 °C and temperature of the condenser is alsofixed at constant temperature. In
Fig. 6.History of the heat loss from the system with heaterfixed at 50 °C.
other words, the measured ambient temperature is not used this simulation. The effect of the condenser temperature to the performance of the system is shown inFig. 8. The figure shows that the lower condenser temperature results in the higher performance. For instance, thermal efficiency and fresh water produced at condenser temperature of 40 °C is 51.79% and 1.831 L, respectively. If the condenser temperature increases to 45 °C, thermal efficiency and fresh water produced will be 42.08% and 1.281 L, respectively. In other words, the thermal efficiency and fresh water produced will be decreased in order of 18.7% and 30%, respectively. This fact suggests that condenser temperature strongly affects the performance of the system. The lower condenser temperature is the better. However, in thefield there is strict limitation of the condenser temperature. It is strongly affected by ambient temperature. In order to get a better performance of the system the condenser must be designed to make condensing temperature close to ambient temperature.
4.5. Effects of the heater surface area
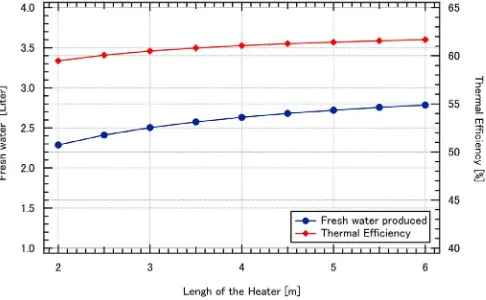
The effect of the surface area of the heating coil is also simulated. As a note in the present work, the heating coil is made of cylindrical heater with diameter of 1 cm and the total length is 3 m. In order to simulate the effects of heater surface area, the length of the heating coil will be varied from 2 m to 6 m, while the temperature of the surface isfixed at 50 °C. The ambient temperature from the measurement will be imposed as boundary conditions. The effects of the heater surface area are shown inFig. 9. In the figure, instead of using surface area, the length of the heating coil is used. Thefigure shows that thermal efficiency and fresh water produced increase as surface area of the heating coil increases. However, the rate of improvement is very low. As an example, if the heating coil is doubled from 3 m to 6 m, the thermal efficiency will be increased from 60.49% to 61.68%. At the same improvement, the fresh water produced will be increased from 2.503 to 2.786 L. These values suggest that the improvement of thermal efficiency and fresh water produced is 1.9% and 11.3%, respectively. Thus, even though there is an improvement, however, the effect is very low or not significant. In other words, the effect of the surface area of the heater is not very significant.
4.6. Effects of the heat exchanger
In the literature, it is common tofind the natural vacuum desalination system is coupled with a heat exchanger[14,15]. The heat exchanger is installed before the seawater injected to the evaporator. The main objective of installing the heat exchanger is to recover
Fig. 8.Effect of condenser temperature to the performance with heaterfixed at 50 °C.
the heat from the drawn brine water. The drawn brine water has a relatively high temperature same as seawater in the evaporator. Here, effect of the heat exchanger in the system will be explored.
Two simulations to the system will be carried out. Thefirst simulation is the system with a heat exchanger. The second simulation is without the heat exchanger. In the both simulation, the length of the heating coil isfixed constant at 3 m and temperature of ambient is used to calculate the condenser temperature. Here, heating coil temperature varies from 40 °C to 80 °C. The performances of the system with and without heat exchanger are shown inFig. 10. Thefigure clearly shows that there is no effect of installing heat exchanger on the fresh water produced. In other word, the productivity of the system is not affected by the heat exchanger. The thermal efficiency of the system with heat exchanger is slightly higher than without heat exchanger. At heating coil temperature of 40 °C and at of 80 °C, the difference of thermal efficiency is 2.8% and 0.6%, respectively. The higher heating coil temperature the effect is lower. The averaged difference is only 1%. This value reveals that there is no significant improvement of thermal efficiency by installing heat exchanger. This fact suggests that there is no effect of installing heat exchanger to the performance of the system.
5. Conclusions
In the present work experiments and numerical simulations of natural vacuum desalination system have been carried out. Three days of experiments have been carried out. In order to simulate the heat source an electric heater with an output power of 1500 W is used. Temperature of the evaporator wasfixed at 50 °C and the saline water was drawn from the system at 1/3 l per hour. In the experiments, governing equations are solved numerically by developing FORTRAN code program. The results of experiment and numerical simulation agree well. Thus the numerical method is used to perform case study in order to explore the operational characteristics and the main parameter that affects the performance of the system. The main conclusions are as follows.
•
The performance of the system, in term of thermal efficiency and fresh water produced, strongly affected by heating coil temperature. The higher heating coil temperature results in the higher thermal efficiency and high fresh water produced. Thus it can be said that maximum temperature in the evaporator is the main criteria for the performance of the system.•
The condenser temperature strongly affects the performance of the system. The lower condenser temperature results in the higher thermal efficiency and higher fresh water produced. However, this is strongly affected by ambient temperature.•
The surface area of the heating coil shows a small effect to the system performance. Even though the surface area of the heating coil is doubled the improvement of thermal efficiency and fresh water produced is only 1.9% and 11.3%, respectively.•
Installing a heat exchanger to recover the heat does not affect the fresh water produced by the system. However it only improves thermal efficiency slightly. The improvement is only 1% in averaged.Acknowledgments
The author gratefully acknowledges that the present research is supported by Research and Technology and Higher Education Republic of Indonesia. The support was under the research Grant Hibah-PUPT of Year 2016 No. 017/SP2H/LT/DRPN/II/2016, date 17 February 2016.
References
[1]H. Sharon, K.S. Reddy, A review of solar energy driven desalination technologies, Renew. Sustain. Energy Rev. 41 (2015) 1080–1118.
[2]M.A. Eltawil, Z. Zhengming, L. Yuan, A review of renewable technologies integrated with desalination systems, Renew. Sustain. Energy Rev. 13 (2009) 2245–2262.
[3]S. Kalogirou, Seawater desalination using renewable energy sources, Prog. Energy Combust. Sci. 31 (2005) 242–281.
[4]A. Subramani, M. Badruzzaman, J. Oppenheimer, J.G. Jacangelo, Energy minimization strategies and renewable energy utilization for desalination: a review, Water Res 45 (2011) 1907–1920.
[5]V.G. Gude, N. Nirmalakhadan, S. Deng, A. Maganti, Feasibility study of a new two-stage low temperature desalination process, Energy Convers. Manag. 56 (2012) 192–198.
[6]C. Li, D.Y. Goswami, A. Shapiro, E.K. Stefano, G. Demirkaya, A new combined power and desalination system driven by low grade heat for concentrated brine, Energy 46 (2012) 582–595.
[7]A.H. Araghi, M. Khiadani, K. Hooman, A novel vacuum discharge thermal energy combined desalination and power generation system utilizing R290/R600a, Energy 98 (2016) 215–224.
[8]W. Gao, C. Li, C. Xu, D. Wang, Experimental study on water separation process in a novel sprayflash vacuum evaporator with heat-pipe, Desalination 386 (2016) 39–47.
[9]N. Dow, S. Gray, Jd Li, J. Zhang, E. Ostarcevic, A. Liubinas, P. Atherton, G. Roeszler, A. Gibbs, M. Duke, Pilot trial of membrane distillation driven by low grade waste heat: membrane fouling and energy assessment, Desalination 391 (2016) 30–42.
[10]A. Christ, K. R-Lieb, H.T. Chua, Boosted multi-effect distillation for sensible low-grade heat sources: a comparison with feed pre-heating multi-effect distillation, Desalination 366 (2015) 32–46.
[11]V.G. Gude, Energy storage for desalination process powered by renewable energy and waste heat sources, Appl. Energy 137 (2015) 877–898.
[12]J. Bundschuh, N. Ghaffour, H. Mahmoudi, M. Goosen, S. Mushtaq, J. Hoinkis, Low cost low-enthalpy geothermal heat for fresh water production: innovative applications using thermal desalination process, Renew. Sustain. Energy Rev. 43 (2015) 196–206.
[13]L. Ciocolanti, A. Savoretti, M. Renzi, F. Caresana, G. Comodi, Comparison different operation modes of a single effect thermal desalination plat using waste heat from m-CHP unit, Appl. Therm. Eng. 100 (2016) 646–657.
[14]S. Al-Kharabsheh, D.Y. Goswami, Analysis of an innovative water desalination system using low-grade solar heat, Desalination 156 (2003) 323–332. [15]S. Al-Kharabsheh, D.Y. Goswami, Theoretical analysis of a water desalination system using low grade solar heat, J. Sol. Energy Eng. 126 (2004) 774–780. [16]V.G. Gude, N. Nirmalakandan, S. Deng, A. Maganti, Low temperature desalination using solar collectors augmented by thermal energy storage, Appl Energy 91
(1) (2012) 466–474.
[17]V.G. Gude, N. Nirmalakandan, Combined desalination and solar-assisted air-conditioning system, Energy Convers. Manag. 49 (2008) 3326–3330. [18]S.C. Maroo, D.Y. Goswami, Theoretical analysis of a single-stage and two-stage solar drivenflash desalination system based on passive vacuum generation,
Desalination 249 (2009) 635–646.
[19]T. Ayhan, H. Al-Madani, Feasibility study of renewable energy powered seawater desalination technology using natural vacuum technique, Renew. Energy 35 (2010) 506–514.
[20]S.W. Churchill, H.H.S. Chu, Correlating equations for laminar and turbulent free convection from a vertical plate, Int. J. Heat. Mass Transf. 18 (1975) 1323. [21] F.P. Incropera, DeWitt, Bergman, and Lavine, Fundamentals of Heat and Mass Transfer, 6th Ed., 2006
[22]J.R. Lloyd, E.M. Sparrow, Combined forced and free convectionflow on vertical surfaces, Int. J. Heat. Mass Transf. 13 (1970) 434.
[23]W.M. Rohsenow, J.P. Hartnett, E.N. Ganic, Handbook of Heat Transfer, third edition, McGraw-Hill Book Company, New York, 1985, pp. 6.31–6.41. [24]G.A. Bemporad, Basic hydrodynamic aspects of a solar energy based desalination process, Desalination 54 (1995) 125–134.
[25]M.H. Sharqawy, J.H. Lienhard V, S.M. Zubair, Thermophysical properties of seawater: a review of existing correlation and data, Desalin. Water Treat. 16 (2010) 354–380.
[26]L.A. Bromley, A.E. Diamond, E. Salami, D.G. Wilkins, Heat capacities and enthalpies of sea salt solutions to 200 °C, J. Chem. Eng. Data 15 (1970) 246–253. [27]D.T. Jamieson, J.S. Tudhope, Physical properties of sea water solutions–thermal Conductivity, Desalination 8 (1970) 393–401.