123
George Spanoudakis
Leszek Maciaszek (Eds.)
12th International Conference, ENASE 2017
Porto, Portugal, April 28–29, 2017
Revised Selected Papers
Evaluation of Novel Approaches
to Software Engineering
in Computer and Information Science
866
Commenced Publication in 2007 Founding and Former Series Editors:
Alfredo Cuzzocrea, Xiaoyong Du, Orhun Kara, Ting Liu, DominikŚlęzak, and Xiaokang Yang
Editorial Board
Simone Diniz Junqueira Barbosa
Pontifical Catholic University of Rio de Janeiro (PUC-Rio), Rio de Janeiro, Brazil
Phoebe Chen
La Trobe University, Melbourne, Australia Joaquim Filipe
Polytechnic Institute of Setúbal, Setúbal, Portugal Igor Kotenko
St. Petersburg Institute for Informatics and Automation of the Russian Academy of Sciences, St. Petersburg, Russia
Krishna M. Sivalingam
Indian Institute of Technology Madras, Chennai, India Takashi Washio
Osaka University, Osaka, Japan Junsong Yuan
University at Buffalo, The State University of New York, Buffalo, USA Lizhu Zhou
Leszek Maciaszek (Eds.)
Evaluation of Novel Approaches
to Software Engineering
12th International Conference, ENASE 2017
Porto, Portugal, April 28
–
29, 2017
Revised Selected Papers
Khalifa University Abu Dhabi
United Arab Emirates
George Spanoudakis City University London London
UK
Macquarie University, Sydney Wroclaw University of Economics Wroclaw
Poland
ISSN 1865-0929 ISSN 1865-0937 (electronic) Communications in Computer and Information Science
ISBN 978-3-319-94134-9 ISBN 978-3-319-94135-6 (eBook) https://doi.org/10.1007/978-3-319-94135-6
Library of Congress Control Number: 2018947449
©Springer International Publishing AG, part of Springer Nature 2018
This work is subject to copyright. All rights are reserved by the Publisher, whether the whole or part of the material is concerned, specifically the rights of translation, reprinting, reuse of illustrations, recitation, broadcasting, reproduction on microfilms or in any other physical way, and transmission or information storage and retrieval, electronic adaptation, computer software, or by similar or dissimilar methodology now known or hereafter developed.
The use of general descriptive names, registered names, trademarks, service marks, etc. in this publication does not imply, even in the absence of a specific statement, that such names are exempt from the relevant protective laws and regulations and therefore free for general use.
The publisher, the authors, and the editors are safe to assume that the advice and information in this book are believed to be true and accurate at the date of publication. Neither the publisher nor the authors or the editors give a warranty, express or implied, with respect to the material contained herein or for any errors or omissions that may have been made. The publisher remains neutral with regard to jurisdictional claims in published maps and institutional affiliations.
Printed on acid-free paper
This Springer imprint is published by the registered company Springer International Publishing AG part of Springer Nature
The present book includes extended and revised versions of a set of selected papers from the 12th International Conference on Evaluation of Novel Approaches to Soft-ware Engineering (ENASE 2017), held in Porto, Portugal, during April 28–29, 2017. ENASE 2017 received 102 paper submissions from 30 countries, of which 14% are included in this book. The papers were selected by the event chairs and their selection is based on a number of criteria that include the classifications and comments provided by the Program Committee members, the session chairs’ assessment, and also the program chairs’ global view of all papers included in the technical program. The authors of selected papers were then invited to submit a revised and extended version of their paper having at least 30% innovative material.
The mission of ENASE (Evaluation of Novel Approaches to Software Engineering) is to be a prime international forum for discussing and publishing researchfindings and IT industry experiences related to novel approaches to software engineering. The conference acknowledges an evolution in systems and software thinking due to con-temporary shifts of the computing paradigm to e-services, cloud computing, mobile connectivity, business processes, and societal participation. By publishing the latest research on novel approaches to software engineering and by evaluating them against systems and software quality criteria, ENASE conferences advance knowledge and research in software engineering, including and emphasizing service-oriented, business-process-driven, and ubiquitous mobile computing. ENASE aims at identifying the most hopeful trends and proposing new directions for consideration by researchers and practitioners involved in large-scale systems and software development, integra-tion, deployment, delivery, maintenance, and evolution.
The papers selected to be included in this book contribute to the understanding of relevant trends of current research on the evaluation of novel approaches to software engineering, including: meta-modelling and model-driven development (p. 111, p. 174, p. 212), cloud computing and SOA (p. 22, p. 134), business process management (p. 46, p. 67, p. 174), requirements engineering (p. 89, p. 174), user interface design (p. 3), formal methods (p. 150, p. 197), software product lines (p. 111), and embedded systems (p. 230).
We would like to thank all the authors for their contributions and the reviewers for ensuring the quality of this publication.
April 2017 Ernesto Damiani
Conference Chair
Leszek Maciaszek Wroclaw University of Economics, Poland and Macquarie University, Sydney, Australia
Program Co-chairs
Ernesto Damiani EBTIC-KUSTAR, UAE
George Spanoudakis City University London, UK
Program Committee
Frederic Andres Research Organization of Information and Systems, Japan
Guglielmo De Angelis CNR - IASI, Italy
Claudio Ardagna Universitádegli Studi di Milano, Italy Ayse Basar Bener Ryerson University, Canada
Jan Olaf Blech RMIT University, Australia
Markus Borg SICS Swedish ICT AB, Lund, Sweden Glauco Carneiro Salvador University (UNIFACS), Brazil
Tomas Cerny Baylor University, USA
Rebeca Cortazar University of Deusto, Spain
Bernard Coulette UniversitéToulouse Jean Jaurès, France
Ernesto Damiani EBTIC-KUSTAR, UAE
Mariangiola Dezani Universitádi Torino, Italy
Angelina Espinoza Universidad Autónoma Metropolitana, Iztapalapa (UAM-I), Spain
Vladimir Estivill-Castro Griffith University, Australia
Anna Rita Fasolino Universitàdegli Studi di Napoli Federico II, Italy Maria João Ferreira Universidade Portucalense, Portugal
Stéphane Galland Universitéde Technologie de Belfort Montbéliard, France
Juan Garbajosa Technical University of Madrid, UPM, Spain Frédéric Gervais UniversitéParis-Est, LACL, France
Atef Gharbi INSAT, Tunisia
Vaidas Giedrimas Siauliai University, Lithuania
Cesar Gonzalez-Perez Institute of Heritage Sciences (Incipit), Spanish National Research Council (CSIC), Spain José-María
Gutiérrez-Martínez
Universidad de Alcalá, Spain
Hatim Hafiddi INPT, Morocco
Jason O. Hallstrom Clemson University, USA
Mahmoud EL Hamlaoui IMS-ADMIR Team, ENSIAS, Rabat IT Center, University of Mohammed V in Rabat, Morocco Rene Hexel Griffith University, Australia
Benjamin Hirsch EBTIC/Khalifa University, UAE Robert Hirschfeld Hasso-Plattner-Institut, Germany Stefan Jablonski University of Bayreuth, Germany
Stanislaw Jarzabek Bialystok University of Technology, Poland Georgia Kapitsaki University of Cyprus, Cyprus
Heiko Kern University of Leipzig, Germany
Siau-cheng Khoo National University of Singapore, Singapore
Diana Kirk EDENZ Colleges, New Zealand
Piotr Kosiuczenko WAT, Poland
Filippo Lanubile University of Bari, Italy Rosa Lanzilotti University of Bari, Italy Robert S. Laramee Swansea University, UK
Bogdan Lent University of Applied Sciences, Switzerland George Lepouras University of the Peloponnese, Greece
Bixin Li Southeast University, China
Huai Liu RMIT University, Australia
AndréLudwig Kühne Logistics University, Germany Ivan Lukovic University of Novi Sad, Serbia
Lech Madeyski Wroclaw University of Science and Technology, Poland
Nazim H. Madhavji University of Western Ontario, Canada
Patricia Martin-Rodilla Institute of Heritage Sciences, Spanish National Research Council, Spain
Sascha Mueller-Feuerstein Ansbach University of Applied Sciences, Germany
Malcolm Munro Durham University, UK
Andrzej Niesler Wroclaw University of Economics, Poland Andreas Oberweis Karlsruhe Institute of Technology (KIT), Germany Janis Osis Riga Technical University, Latvia
Mourad Oussalah University of Nantes, France
Claus Pahl Free University of Bozen-Bolzano, Italy Mauro Pezze Universitàdella Svizzera Italiana, Switzerland
Naveen Prakash IGDTUW, India
Lukasz Radlinski West Pomeranian University of Technology, Poland Stefano Russo Universitádi Napoli Federico II, Italy
Krzysztof Sacha Warsaw University of Technology, Poland Markus Schatten University of Zagreb, Croatia
Stefan Schönig University of Bayreuth, Germany
Keng L. Siau Missouri University of Science and Technology, USA Marcin Sikorski Gdansk University of Technology, Poland
Josep Silva Universitat Politècnica de València, Spain Michal Smialek Warsaw University of Technology, Poland Ioana Sora Politehnica University of Timisoara, Romania Andreas Speck Christian Albrechts University Kiel, Germany Maria Spichkova RMIT University, Australia
Witold Staniszkis Rodan Development, Poland
Armando Stellato University of Rome, Tor Vergata, Italy
Chang-ai Sun University of Science and Technology Beijing, China Jakub Swacha University of Szczecin, Poland
Stephanie Teufel University of Fribourg, Switzerland Feng-Jian Wang National Chiao Tung University, Taiwan Krzysztof Wecel Poznan University of Economics, Poland Bernhard Westfechtel University of Bayreuth, Germany
Martin Wirsing Ludwig-Maximilians-Universität München, Germany Igor Wojnicki AGH University of Science and Technology, Poland Alfred Zimmermann Reutlingen University, Germany
Additional Reviewers
Ahmed Alharthi RMIT University, Australia
Nicola Amatucci University of Naples Federico II, Italy Abhijeet Banerjee NUS, Singapore
Thomas Buchmann University of Bayreuth, Germany
Michael Emmi Nokia Bell Labs, USA
Carlos Fernandez-Sanchez Universidad Politécnica de Madrid, Spain
Tarik Fissaa SIME/IMS, Morocco
Walid Gaaloul Institut TELECOM, France
Filippo Gaudenzi Universitàdegli Studi di Milano, Italy
Franco Mazzanti Istituto di Scienza e Tecnologie dell’Informazione A. Faedo, Italy
Anas Motii IRIT, France
Laura Nenzi IMT Alti Studi di Lucca, Italy
Antonio Pecchia Universitàdegli Studi di Napoli Federico II, Italy Abdelfetah Saadi Houari Boumediene University of Science
Jeremy Sproston Universitàdegli Studi di Torino, Italy
Chengnian Sun UC Davis, USA
Jiannan Zhai FAU, USA
Zhiqiang Zuo University of California, Irvine, USA
Invited Speakers
Paris Avgeriou University of Groningen, The Netherlands
Hermann Kaindl TU Wien, Austria
Service Science and Business Information Systems
Guidelines for Designing User Interfaces to Analyze Genetic Data.
Case of Study: GenDomus . . . 3 Carlos Iñiguez-Jarrín, Alberto García S., JoséF. Reyes Román,
andÓscar Pastor López
Biologically Inspired Anomaly Detection Framework . . . 23 Tashreen Shaikh Jamaluddin, Hoda Hassan,
and Haitham Hamza
Genomic Tools*: Web-Applications Based on Conceptual Models
for the Genomic Diagnosis . . . 48 JoséF. Reyes Román, Carlos Iñiguez-Jarrín, andÓscar Pastor
Technological Platform for the Prevention and Management
of Healthcare Associated Infections and Outbreaks . . . 70 Maria Iuliana Bocicor, Maria Dascălu, Agnieszka Gaczowska,
Sorin Hostiuc, Alin Moldoveanu, Antonio Molina, Arthur-Jozsef Molnar, IonuţNegoi, and Vlad Racoviţă
Software Engineering
Exploiting Requirements Engineering to Resolve Conflicts
in Pervasive Computing Systems. . . 93 Osama M. Khaled, Hoda M. Hosny, and Mohamed Shalan
Assisting Configurations-Based Feature Model Composition:
Union, Intersection and Approximate Intersection . . . 116 Jessie Carbonnel, Marianne Huchard, AndréMiralles,
and Clémentine Nebut
A Cloud-Based Service for the Visualization and Monitoring
of Factories . . . 141 Guillaume Prévost, Jan Olaf Blech, Keith Foster,
and Heinrich W. Schmidt
An Operational Semantics of UML2.X Sequence Diagrams
for Distributed Systems . . . 158 Fatma Dhaou, Ines Mouakher, J. Christian Attiogbé,
Fast Prototyping of Web-Based Information Systems Using
a Restricted Natural Language Specification . . . 183 Jean Pierre Alfonso Hoyos and Felipe Restrepo-Calle
Model-Based Analysis of Temporal Properties . . . 208 Maria Spichkova
Towards a Java Library to Support Runtime Metaprogramming . . . 224 Ignacio Lagartos, Jose Manuel Redondo, and Francisco Ortin
Design Approaches for Critical Embedded Systems: A Systematic
Mapping Study . . . 243 Daniel Feitosa, Apostolos Ampatzoglou, Paris Avgeriou,
Frank J. Affonso, Hugo Andrade, Katia R. Felizardo, and Elisa Y. Nakagawa
to Analyze Genetic Data. Case of Study:
GenDomus
Carlos Iñiguez-Jarrín1,2(&), Alberto García S.1, JoséF. Reyes Román1,3, and Óscar Pastor López1 1
Research Center on Software Production Methods (PROS), Universitat Politècnica de València, Camino Vera s/n., 46022 Valencia, Spain
{ciniguez,algarsi3,jreyes,opastor}@pros.upv.es 2
Departamento de Informática y Ciencias de la Computación, Escuela Politécnica Nacional, Ladrón de Guevara E11-253, Quito, Ecuador 3
Department of Engineering Sciences, Universidad Central del Este (UCE), Ave. Francisco Alberto Caamaño Deñó., 21000 San Pedro de Macorís,
Dominican Republic
Abstract. New Generation Technologies (NGS) have opened new opportuni-ties in the geneticfield. Analyzing data from large quantities of DNA sequenced to transform it into knowledge has become a challenge. Several tools have been developed to support the genetic analysis, however, most of them have user interfaces that make it difficult to obtain knowledge from genetic data. The lack of design guidelines in this domain leads to the development of user interfaces that are far from satisfying the interaction needs of the domain. From the experience of designing GenDomus, a web-based application to support geneticists in the analysis of genetic data, several interaction-related consider-ations emerged. Based on such considerconsider-ations, we present guidelines for designing user interfaces that support geneticists in the analysis of genetic data. Such guidelines become important recommendations to be considered in the design of user interfaces in the geneticfield.
Keywords: User interface design
Design guidelines
GenDomus Genomic information
1 Introduction
The Next-Generation Sequence (NGS) technologies [1] have promoted the prolifera-tion of software applicaprolifera-tions to allow practiprolifera-tioners to manage huge considerable DNA genetic information. The analysis of genetic data is a domain that requires collaborative coordination between clinicians of several fields to identify and analyze patterns to justify or discard genetic anomalies. In this domain, several supporting tools have been developed, especially for analyzing variant1genomicfiles (e.g., VCF [2]). These tools
1Variation (or variants): naturally occurring genetic differences among organisms in the same species
[citable by Nature Edu.].
include powerful data operations (filtering,unions,comparing, etc.), capable to operate at a low level overfile data. However, to operate these tools, geneticists must have high computational skills, since the user interfaces (UI) provided by the tools lack the interaction mechanisms to facilitate the data analysis.
The UI’s goal is, among other things, to maximize learning speed, minimize cognitive load, provide visual clues, promote visual quality, minimize error rate, maximize the speed of use, and provide adequate aesthetics. To achieve this goal, UI designers rely ondesign guidelinesdefined from the observation of problems and needs in UI design. Constantly refining the guidelines is important to maintain their validity. As needs and problems arise, new guidelines must appear to address them. The design guidelines are recommendations rather than standards and serve to guide a designer to get UI’s adapted to the real needs of the domain and guarantee the use of them. From a more global perspective, UI design guidelines become key guides for better human-machine interaction.
In a previous work [3], we focused on (a) defining general design guidelines to address aspects related to interaction and collaboration which are indispensable for the design of genetic data analysis applications and (b) reporting the progress in the implementation ofGenDomus, a web application designed under the general design guidelines to facilitate the genetic analysis for diagnosing genetic diseases. This work extends the previous work by refining the general guidelines, specifically, these that address the interaction issues in the analysis of genetic variants. From the general design guidelines and interviews with domain specialists, we derivefine-grained design guidelines focused on dealing with interaction issues. The derived guidelines become the starting point for a new iteration in the GenDomus implementation. The advances over our previous work [3] are:
(a) To describe a motivating scenario to illustrate how GenDomus works in the genetic analysis.
(b) To extend high-level interaction guidelines by defining low-level guidelines based on lessons learned from the implementation of GenDomus.
(c) To define design guidelines related to the platform that supports the application.
To achieve these advances following this research line, we firstly overview and analyze the current tools for analyzing genomic data and outline the common func-tionalities and characteristics between them. In Sect.3, we make an overview of the workflow to guide the genetic data analysis. Section4 describes the GenDomus application by mainly focusing on the UI’s. In Sect.5, we present the motivating scenario upon which GenDomus application has been demonstrated to the stakehold-ers. Section6 extends the general design guidelines from the lessons learned of designing the GenDomus application. Finally, we close the paper presenting the conclusions and outlining future work.
2 Related Works
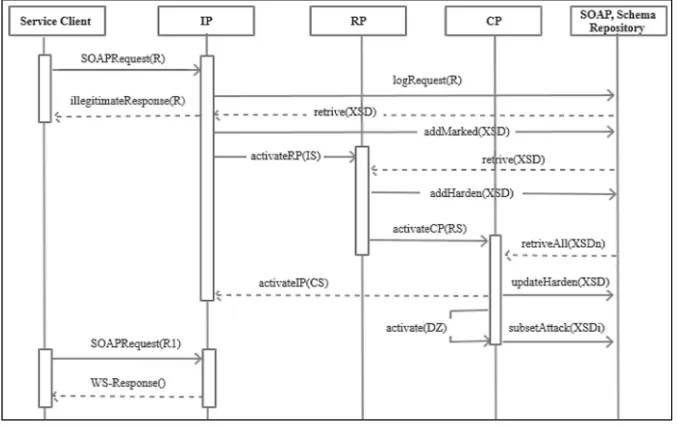
In that literature review, eight tools such as VCF-Miner [4], DECIPHER [5], BIERapp [6], ISAAC [7], PolyTB [8], DraGnET [9], Variant Tool Chest (VTC) [10] and VCF Tools [2] were selected considering following criteria: relevance (tools reporting the highest number of citations by articles or experiments in the genomic domain),modernity(tools that have emerged in the last 6 years),collaboration(tools that incorporate collaborative aspects),cognitive support(tools supporting the cogni-tive process of users).
The analysis of these tools allows identifying a set of characteristics that become a generic profile of a genetic analysis application. Table1 shows the characteristics categorized into usability, collaboration, data operations, cognitive aspects and UI and their correspondence with each tool.
Table 1. Comparative tool analysis.
Tools Characteristic Description VCF-Miner
DECIPHER BiERapp ISAAC PolyTB DraGnET VTC VCFTools
Interface type Application platform
WEB WEB WEB WEB WEB WEB CLI CLI
Usability
DECIPHER BiERapp ISAAC PolyTB DraGnET VTC VCFTools
As is shown in the Table1, the predominating architectures in the applications of genetic analysis arestandaloneandclient-server. Applications such as VTC and VCF Tools have been built under a standalone architecture where the deployment of the application is done on the same machine where the application is developed and executed. On the other hand, web-based applications such as VCF Miner, DECIPHER, BierApp, ISAAC, PolyTB and DraGNET have been obviously designed under a client-server architecture, a distributed approach where clients make requests and client-servers respond to such requests.
The UI styles that predominate in genetic analysis tools are the Command Line Interface(CLI) andgraphical user interface (GUI). Tools based on CLI interact with the user through commands that execute specific actions. This kind of interaction implies a high cognitive load for the user, which is why these kinds of interfaces are probably more complicated to use. By contrast, GUIs allow direct manipulation (i.e., the user interacts directly with the interface elements) and are available as desktop UI’s or as web user interfaces (WUI) that are accessible from web browsers. The authors of WUI-based tools argue that using the web as a platform makes possible to create easy-to-use tools and reduce the cognitive load of the end-user. In fact, using web forms to search for variants with just one mouse click is easier than remembering the sequence of commands and symbols to search for variants via CLI.
Collaboration mechanisms encourage the synergy of the geneticists. ISAAC and DraGnET are web-based applications that incorporate collaboration mechanisms to allow users to share data between them and publish information available to external users. Such collaboration mechanisms rely on the communication capabilities provided by the platform architecture. In contrast to standalone architecture, web architecture
Table 1. (continued)
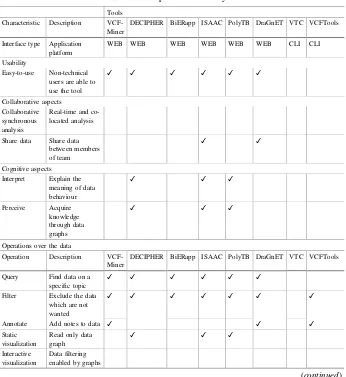
Operations over the data
Operation Description VCF-Miner
DECIPHER BiERapp ISAAC PolyTB DraGnET VTC VCFTools
support a distributed communication between several points, therefore, the tools based on web platform can implement collaborative mechanisms.
The data graphical visualization is a feature to help users perceive the shape of data and it is present in some tools. Although the tabular format is commonly used by the tools to represent the data, tools such as DECIPHER, ISAAC, and PolyTB take advantage of data graphical visualization to support the cognitive human capabilities to data analysis (i.e.,perceivingand interpreting).
Operations on data are functionalities closely related to the platform on which the tool is implemented. Powerful data operations such asmerge,intersect,compareand complementare more common on the CLI-based tools such as VCF Tools and VTC. In contrast, data operations to retrieve data (e.g.,queryingandfiltering) are more common on web-based tools.
Although there are several tools aimed to support the diagnosis of genetic diseases, there is not a standard guide containing all the functionalities and features required to design a genetic analysis application. GenDomus is a web-based application designed to support the genetic analysis by incorporating interaction and collaborative mecha-nisms. However, the real contribution of the GenDomus design is to gather the func-tionalities present on the domain tools and define a set of guidelines that serves as useful recommendations to design genetic applications. We have already made afirst endeavor by defining general guidelines where the interaction and collaborative aspects are treated. In the next sections, we will overview the set of defined guidelines and refine them by incorporating more detailed guidelines.
3 Genetic Diagnosis Scenario
Human diseases can be determined through the genes that cause them [11], a deter-ministic approach that turns a disease into a genetic condition. The genetic diagnosis aims to identify the genetic elements that cause a certain disease. The genetic diagnosis starts from a tissue sample and includes the analysis of mutations within genes and the interpretation of the effects that cause such mutations from information.
A genetic diagnosis project requires the active participation of several specialists (i.e.,biologists,geneticists,bioinformatics, etc.), working on a collaboratively way to analyze the genetic samples and identify relevant patterns in the data. The resulting findings are documented in afinal report as evidence of the analysis. For example, in the case of genetic analysis for diagnosing diseases described by Villanueva et al. [12], the geneticists analyze the genetic variants contained in a DNA samples which have been obtained from a VCF format file. The geneticists search for genetic variants related to one pathology, identify relevant patterns in the data and define whether or not the patient is at risk of developing a certain disease.
• Data Selection:The geneticists select the suitable data sources (i.e., genetic data sources) to compare with the samples containing genetic variants. The next stages related to the data analysis rely on the data selected in this stage since selecting data sources that are not suitable for analysis will produce inaccurate results or incorrect diagnostics.
• Variant Analysis: The geneticists work collaboratively exploring the genetic variants in the sample,filtering the data to focus on the relevant genetic variants. To interpret the effects produced for each genetic variation, the geneticists gather information about diseases which are related to the genetic variation. The aim of this stage is to select the relevant genetic variants that can lead to relevantfindings. • Curation: In this stage, specialists consolidate all findings and proceed to draw
conclusions that support the diagnostic report.
4 GenDomus
GenDomus is a web-based solution that incorporates advanced interaction and col-laborative mechanisms to help geneticists when diagnosing genetic diseases. The project was carried out by the PROS Research Center’s Genome Group2and partici-pated in an applied science European project that encourages the use of FIWARE Future Internet platform as a cloud platform of public use and free of royalties. In fact, the GenDomus architecture was designed considering the FIWARE3Generic Enablers (GEs) to support the interactive and collaborative features inherent to the diagnosis of genetic diseases.
The GEs are the key components in the development of future internet applications (i.e., FIWARE applications). Each GE provides a set of application programming interfaces APIs and its open reference for components development, which are accessible from FIWARE catalogue together with its description and documentation [13]. To design and implement the web UI, considering the need of visual data rep-resentation, collaboration and interaction, we have considered two GEs: WireCloud [14] and 2D-UI[15].
WireCloud, a web application for mashups, offers powerful functionalities (e.g., heterogeneous data integration, business logicand web UI components) that allows users to create their own dashboards with RIA functionalities [16]. In fact, WireCloud follows the philosophy of turning users into the developers of their own applications. Consequently, the users are provided by aComposition Editor, called“dashboard”, to edit, name, place and resize visual components. Dashboards are used to set up the connections and interactions between the visual components (i.e.,widgets,operators andback-end services) in a customized way. Instead, the server side provides services and functionalities like cross-domain proxy toaccess to external sources, store the data and persistence state of mashups and the capability toconnect to other FIWARE GEs. The widgets are the UI components developed under web technologies (HTML, CSS
2http://www.pros.webs.upv.es. 3https://www.
and JavaScript) capable to send and receive state change events from the remainder widgets placed on the dashboard by an event based wiring engine. For instance, a component containing Google maps to represent a position by a coordinate. On the other hand, the operators are useful components to provide data or back-end services to widgets. Developers can create both widgets and operators and make them available to the end user through FIWARE catalogue4. On the one hand, the developers create widgets and operators, packed in zipped file format (wgt) and upload them to the FIWARE catalogue. While on the other hand, the users create their own dashboards using the available operators and widgets from the catalogue [13]. WireCloud’s dashboards provide dynamism and interaction between the visible components through the“wiring”and“piping”mechanisms. These mechanisms are useful for orchestrating the widget-to-widget interaction and widget-to-back services respectively [17].
The generic enabler 2D-UI is a JavaScript library for generating advanced and dynamic Web UI’s based on HTML5. Its implementation supports the use of W3C standards, the ability to define reusable web components that support 2D and 3D interactions and the reduction of fragmentation issues produced in the presentation of graphical UI’s across devices. The main idea is to enclose in a single web component, both the graphical UI and the mechanism for recording and reporting of events pro-duced by input devices. The web components implementation is achieved by Polymer5 JavaScript library, whereas the register and notification of events is achieved by Input API, an application programming interface to deal with the events produced by input devices (e.g.,mouse,keyboard,game pad) on the web browser. Polymer allows creating fully functional interoperable components, which work as DOM standard elements, which means a web component package HTML code, a functionality expressed on JavaScript and customized CSS styles for the proper functioning of the component.
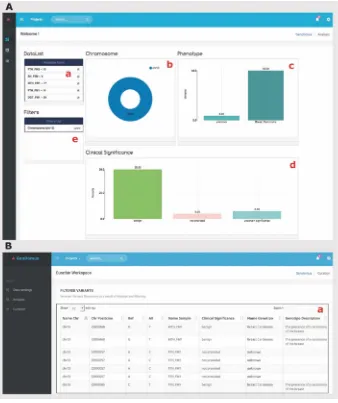
WireCloud widgets can be reused within the dashboard to show different infor-mation in form and content, according to the needs of the user. For example, in Fig.2A, the same widget has been used to create three graphical components, the first one displaying the number of variants per chromosome through a Pie chart (Fig.2Ab), the second one displaying the number of genetic variants by phenotype through a Bar chart (Fig. 2Ac) and the last one (Fig. 2Ad) displaying the number of genetic variants by clinical significance.
The statistical graphs support trigger events caused by sector selection and chart resizing due to the nvd36JavaScript library used for this purpose. The nvd3 library provides a set of suitable statistical charts to represent a huge amount of data. For this prototype, we have used thePie Chartand theDiscrete Bar Chart. In this way, these charts incorporatefilter mechanisms by selecting chart sectors which makes it possible to create dynamic queries in an ease way.
GenDomus is built upon a suitable Conceptual Model of the Human Genome (CMHG) [18] that gather the domain concepts (e.g., chromosome, gen, variation, VCF,
4https://catalogue.
fiware.org/.
etc.) and its relationships as is described in [3]. Through the CMHG, GenDomuscan integrate the data sources required to the diagnosis of genetic diseases and create valuable links to the genetic variants form the samples.
At the front-end level, GenDomus consists of three UI’s (data loading, genetic variant analysis and curation) that address each of the phases of the workflow for diagnosing genetic diseases discussed in the previous section.
In this section, we detail the UI’s of the application highlighting the technological components provided by the FIWARE platform and how they have been orchestrated to address the aspects of interaction and collaboration.
4.1 Graphical User Interface
The front end is composed of three (3) complementary web interfaces:data loading, genetic variant analysis and curation, which are implemented under web standards such as HTML5, JavaScript (Bootstrap7, jQuery8) and CSS. The three UI’s are aimed at covering the three stages of genetic diagnosis described in the Sect.3of this paper.
Through the “Data loading”web page (Fig.1), the geneticists select the genetic samples to be analyzed along with the genetic databases with which the geneticists want to compare. This UI is composed of three web components that retrieve infor-mation from the underlying genome CM. The web component“project-info”(Fig.1a) presents the information of the genetic analysis project created to identify the analysis in process together with the number of samples and data sources for the analysis. The “Samples”panel (Fig.1b) lists the genetic samples grouped by analysis study, while the“Data Sources”panel (Fig.1c) lists the available public genetic databases.
The “Genetic Variant Analysis” web page (Fig.2A) incorporates a dashboard where the user can place and set up widgets that incorporate bi-dimensional (2D) statistical charts to represent how the data is distributed. The charts bring dynamism to the data exploration, since every data chart placed on the dashboard is sensitive to interactions and changes in the others. In fact, each effect caused by selecting a chart sector is propagated and visualized in the rest of charts; thereby we provide an easy use aesthetic system to build dynamic queries.
The genetic samples selected in the Data loading web page (Fig.1b) are showed in the Analysis web page through the Data List component (Fig.2Aa) with the option to select or deselect the samples participants in the data exploration. Interlinked charts provide visualization offilter propagation effect and it serves as a helpful feedback resource for users. Thefilters generated are showed in afilter stack panel (Fig. 2Ae) enabling user to remember the actions executed, modify the query options or infer information about the data showed in the graph. Ordering functionality is provided to user to customize the view. The widgets have been developed based on the WireCloud documentation, compressed in afile with“wgt”extension and uploaded on FIWARE catalogue to be used by thefinal user.
In addition, interaction with data can be performed through any web-based device (e.g. tablets, laptops). The main idea is tofilter the information graphically to identify relevant information related to genetic diseases.
component “curation-table” (Fig.2Ba) which shows in tabular format the detail of selected genetic variants because of the interaction in the dashboard mentioned in the variant analysis stage.
Additionally, the design of web UI’s has been adapted to wide range of display devices because of Accessibility guideline implementation.
Based on the workflow for the diagnosis of genetic diseases, the following section describes a motivating scenario that illustrates how the interaction and collaboration mechanisms provided by GenDomus become a useful tool for genetic analysis.
5 Motivating Scenario: The Collaborative Room
GenDomusis a prototype in continuous evolution. In fact, afirst demonstration of the application based on a motivating scenario, has already been made to project’s stakeholders. The motivating scenario describes how the mechanisms of interaction and collaboration incorporated inGenDomusare useful for the genetic analysis, specifically the genetic analysis for diagnosing genetic diseases. In this section, we describe the motivating scenario and highlight the functionalities provided byGenDomusthat intent to make the genetic analysis an easy activity.
5.1 Motivating Scenario
James, Francis and Johan (assumed names), a team of geneticists, plan a diagnosis session to study the samples of a family of 4 members and determine if the presence of cancer in one of them (the daughter specifically) has genetic reasons and, if applicable, identify which members of the family are carriers of the same disease.
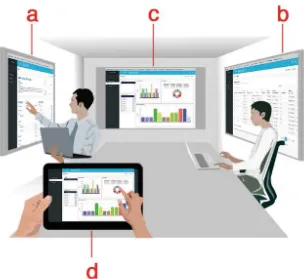
To this end, the geneticists meets in the“cognitive room”(Fig.3), a physical room specially designed to facilitate the collaborative work of geneticists. This room is equipped with several display devices (i.e., laptop, smart TV, tablet) that access to the GenDomus application through the internet.
As afirst step, James (the team leader) uses one of the smart TV’s located on the left wall of the room (Fig.3a), to select the genetic samples and the data sources for the analysis, as shown in Fig.1. He selects the samples from each member of the family as well as ClinVar and dbSNP (SNP database), the data sources that will provide infor-mation about diseases. Then,GenDomusprocesses the data by matching each genetic variation in the samples with the information from data sources. After the process, the resulting genetic variants together with its related disease information are displayed in the curation screen, as shown in Fig.2B, by using a second smart TV located on the right wall of the room (Fig.3b).
(Fig.3d) to create a bar chart that shows how the variants are distributed with respect to “clinical significance”(as shown in Fig.2Ad) whereas Johan, using his laptop, creates a bar chart that shows how the variants are distributed with respect to“phenotypes”(or diseases), as shown in Fig.2Ac.
Since the data charts have interactive capabilities, James and his colleagues interact directly with them tofilter the genetic variants. In fact, Francis uses his tablet (Fig.3d) to filter the variants related with the chromosome 13 (the chromosome where the cancer-related BRCA1 and BRCA2 genes are located) by selecting the corresponding sector in the Pie Chart (Fig.2Ab). Because of this interaction, every device in the collaborative room automatically synchronizes its state, so the geneticists can follow the data analysis in progress from either their mobile devices or the smart TVs, without losing any of the actions performed in the analysis.
During the diagnostic session, Johan observes in the curation screen (Fig.3b) that according to ClinVar, most of the variants are“benign”(the variation has not effect on the breast cancer disease); however, there are other variants that have been categorized differently.
Johan wants to analyze these variants without interrupting or affecting the analysis carried out by the whole team; therefore, He uses his tablet to access his individual work space andfilters the variants. He realizes that the variants are“intronic variants”
(i.e., a variation located within a region of the gene that does not change the amino acid code), and informs it to their colleagues. Thanks to Johan’s individual analysis, the team decides to discard the benign and intronic variants from the variants causing the disease.
From the remaining set of variants, the team use the curation screen (Fig. 3b) to filter the variants whose“clinical significance”is“uncertain”but they realize that such variants are not present in the sample of the daughter (the one with cancer) and therefore these must also be discarded.
Consequently, the geneticists team concludes that the cancer of the daughter of the family is not genetically related.
This motivating scenario has illustrated how the interactive and collaborative capabilities of GenDomus are useful for the diagnosis of genetic diseases. From a more abstract perspective, these tangible capabilities are the result of applying general design guidelines that specifically address both the interaction and collaboration aspects. In the next section, we describe the design guidelines that have been considered in the GenDomus design and that we think, these can be considered, in a broader sense, as general guidelines for the design and implementation of genetic analysis applications.
6 Design Guidelines
In a previous work [3], we present the design guidelines upon which the GenDomus application was designed. These guidelines address theinteraction,collaboration, and platformissues that are central to GenDomus design. We call these guidelines as high-level guidelines(HLG’s) as they address the above issues from a rather general point of view.
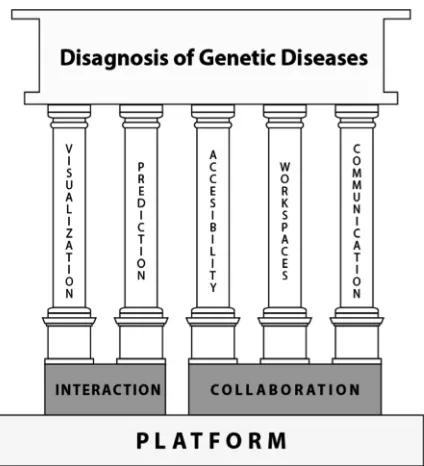
Figure4 summarize the HLG’s by showing the guidelines grouped by issues. While the interaction issues group the visualization and prediction guidelines, the collaboration issues group the communication, accessibility and workspaces guide-lines. Supporting the issues of interaction and collaboration, we canfind theplatform issuesgrouping the guidelines to deal, among others, with infrastructure, performance, storage issues.
Although these HLG’s become useful recommendations for designing genetic analysis applications, they are very general and lose sight of the detail of problems in the domain. Therefore,low-level design guidelines (LLG’s) are needed to refine and specify the HLG’s.
In this work, our goal is to define LLG’s to refine the HLG’s related to the issues of interactionandplatformsince such issues are closely related to our main target: The UI design.
To achieve this goal, we take advantage of the lessons learned from the design and implementation of GenDomus, since such lessons are useful for (a) enriching each HLG by providing a set of LLG’s that refine it, and (b) adding new guidelines to deal with technological platform aspects.
6.1 Design Guidelines for User Interfaces
From the HLG’s (i.e.,visualizationandprediction) that address the interaction issues, we derive LLG’s. In other words, we refine each HLG by incorporating the observa-tions obtained from interviews with geneticists.
Interviews with geneticists from TellmeGen9, a recognized genetic laboratory from Valencia, Spain, yielded important and more detailed observations. TellmeGen offers personal genetic services. Through its on-line platform, it is possible to perform per-sonal genetic tests in an easy, comfortable and fast way. The interviews conducted in this laboratory arose some recommendations related to the interaction of how to search for information and how to document thefindings.
The guidelines presented here aim to improve the usability of the system, thus providing a better user experience.
HLG: Visualization
Provide appropriate interactive visualization mechanisms for data discovery and knowledge extraction.
When analyzing genetic data, analysts are challenged to gain knowledge from high and heterogeneous volume of data. The human capacity to figure out the data rela-tionships hidden into extensive sequence of data, is limited; therefore, visualization mechanisms are needed to shape the data and explore it. As the well-known saying
Fig. 4. Fundamental design guidelines for genetic diseases’diagnosis applications.
goes: “A picture is worth a thousand words”, information graphs (maps, flowcharts, bar plots, pie charts, etc.) become a powerful mechanism for understanding and expressing knowledge that is often difficult through other forms of expression (e.g. verbal, written). Tidwell [19] mentions that good interactive information graphics allows users to answer questions such as:How is the data organized? What is related to what? How can these data be exploited?The interactive graphics provide significant advantages over static graphics. Through interactive graphics, users move from being passive observers to being the main and active actors in the discovery of knowledge, deciding how they want to visualize, explore and analyze the data and their relationships.
GenDomus incorporates information graphics as a powerful and suitable mecha-nism to (a)concretize the form of data, (b) understand data easily, (c) explore data from a visual and interactive perspective, (d) draw conclusions and transmit knowl-edge from what the user sees and thinks. For example, the available GenDomus data charts (i.e., pie chart and bar chart) are used to show the data distribution from the different point of views as well as datafiltering mechanisms. In this way, a Pie Chart is not only useful to show the data distribution across multiple sectors, but also tofilter the data by“clicking”on a certain chart sector. Consequently, the entire data set is segregated under the givenfilter condition and the new data distribution, from each perspective, is visualized instantaneously through the different graphic components (e.g., charts, data table) involved into the same analysis space. In this way, information graphics make the data filtering an easier direct data manipulation task allowing the user to be aware of the data behavior change.
LLG 1: Interactive Data Charts. –Provide interactive data charts that allow both visualizing how the data is distributed andfiltering the data across multiple criteria. Unlike command-line-based applications that require the user to enter certain commands to filter data, web-based applications have more visual interfaces (web forms) to facilitate datafiltering. The trend is to enable users without advanced com-puter skills to perform data operations in an easy, intuitive and efficient way. In this respect, interactive charts support such a trend and become powerful mechanisms for visualizing andfiltering data.
The study ofbiological pathways[20] is a clear scenario where the LLG 1 can be applied. The study of biological pathways is relevant to know the roots of a human disease. Therefore, knowing the genetic variants involved in different biological pathways becomes a necessity. By using interactive data charts, such as a Column chart, geneticists can visualize the behavior of genetic variants with respect to bio-logical pathways andfilter the genetic variants tofind which of them are related to a certain disease. Concretely, each column in the chart represents a pathway from the data set and the variable height of the column depends on the number of genetic variants contained in the pathway. Once the columns have been displayed, the geneticist can select one or another column to filter the variants or show, through another UI control such as the data table, the list of genetic variants related to the selected pathway.
A scenario where LLG 2 can be applied, for example, is the comparison of bio-logical pathways. The user needs to compare biobio-logical pathways (one healthy with one sick) to determine the problems caused by the mutations. Parallel visualization of pathways allows the user to easily and intuitively identify genetic differences and draw conclusions about them.
LLG 3: Operations between Samples. – Provide set operations (i.e., join, inter-section, difference, complement) to produce new datasets or compare two or more similar datasets.
One scenario where this guideline is applied is the comparison of genetic samples. Genetic samples contain numerous amounts of genetic variation. Analyzing two genetic samples involves, among other things, identifying and visualizing, at the level of genetic variation, the differences between the samples (for example, listing the genetic variants that are in one sample and are not in the other). In this scenario, set operations play a key role. The intersection operation, for example, will allow to quickly identify the coincident variants between the two samples. The execution of each set operation produces new sets of genetic variants that can be used in later operations.
HLG: Prediction
Use the user-data interactions as a source of information to predict the next steps in the knowledge discovery.
LLG 4: Literature Search Methods. –Improve the literature search process through recommendations based on a history of user interactions.
To interpret the effects produced by certain genetic variation, geneticists review the clinical literature (e.g., clinical studies, research articles, clinical reports) in search of evidence to support the such interpretation.
The search and review process of literature is not trivial. Geneticists use extensive lists of terms like query strings to retrieve, through web browsers, documents or content related to the search string. In some cases, the results are not as expected, because some terms have not been included in the search string.
This process can be facilitated by using user interactions as a natural means to generate precise search strings and to recommend literature associated with the topic of interest. The application can recommend the revision of some literature related to the subject of interest, based on analysis of user interactions in the literature search process (e.g., search terms, applied datafilters, search criteria defined, etc.) and interactions stored in a database of previously defined knowledge.
LLG 5: Documentation of Findings. –Provide the user with ways to record their findings during genetic data analysis.
manager were (e.g., Mendeley10 or Zotero11), the annotations should include the information of the resource to which they refer. This information will serve for further review.
LLG 6: Interfaces with Assisted Interaction. –Use the end user interaction to guide the user in the data analysis.
The amount of data involved in genetic analysis is so large and scattered. Conse-quently, the user gets lost when browsing or exploring the data. From the set of interactions performed on previous data analysis, the UI should be able to assist the user on performing the data analysis. Previous interactions, performed by geneticists in past analysis, can be the source of knowledge for current and future analysis.
Each interaction performed contains information about WHAT and WHY a certain analysis action (e.g., select,filter, navigate) was performed, therefore, the user can be guided in the data exploration by using the experience of other experts. When looking for disease-causing variants, for example, the interactions from previous diagnostics are useful for answering questions such asWhat other navigable options do I have from here? Which data relationships were explored by other analysts in similar searches? Why were they explored? What other information was searched in previous and similar diagnostics?
6.2 Platform Design Guidelines
From the previous experience that has been generated from the development of Gen-Domus, six guidelines have been extracted and defined with the aim of laying the foundations of the platform that supports the execution of GenDomus. This platform will inherit and enhance existing GenDomus capabilities. These guidelines are defined for the sole purpose of accelerating genetic analysis, facilitating work, and automating existing repetitive tasks as much as possible. Thus, we describe the guidelines:
LLG 7: Scalability Support. –The system must support scalability in both computing and storage capacity.
The initial amount of data used on the platform will be high; nonetheless, this amount will not be static and will, over the time, be increased with new genetic information thanks to the work of geneticists identifying and isolating this information. Likewise, the number of users and professionals who carry out analysis through our tool will grow, meaning that the load of the system will increase too. The tool must handle this increase of data and concurrent users satisfactorily, it must have the elas-ticity to allow dynamic growing of stored knowledge base and compute capacity to manage possible peaks of use of the application.
LLG 8: Availability. –Complete availability of the system must be guaranteed. With a growing user base, to important scalable dimensions are identified: on the one hand, the greater the application is used, the more information will be stored in the system and therefore more frequently will be accessed. On the other hand, the more the
application is accessed, the more dependent of the application the users will be. This implies that the platform must offer high availability.
Application architecture will have the necessary mechanisms to guarantee its availability in most situations.
LLG 9: Transparent Processing. – Data loading and data modification must be transparent to the user.
The goal of the users of the application should be to focus on the analysis and extraction of new information from data, hiding the obtaining of the data. This guideline worked well in GenDomus but was limited: data sources could only be managed before starting the analysis. Our purpose is to improve the guideline even more in the new application. For this reason, data sources will be handled in a way that will permit the user to dynamically change the working data set: adding and deleting different data sources while an analysis is being done.
LLG 10: Query Execution Time. –To reduce the queries processing time.
The goal of the platform is to speed up genetic analysis. Therefore, the minimum processing time of a query execution must be determined, analyzed and reduced considering the existing hardware capabilities.
Unlike the current GenDomus architecture, the next one will guarantee a maximum execution time until an executed query returns the information; moreover, when pos-sible, the information will be delivered and shown to the user“on thefly”, no need to wait until the full set of data is created or processed.
The usability needs of end users are changing; however, the set or defined guidelines becomes a starting point to improve the usability of GenDomus. Future requirements will be added to meet the needs of end-users. The goal is to design the necessary interaction in the domain and generate usable UI’s that address the challenge of consuming genetic data.
7 Conclusions and Future Work
In this work, we presented refined guidelines for designing UI’s aimed to the genetic analysis. These guidelines have been derived from general guidelines proposed in an earlier work, the experience learned from the design of a web based prototype appli-cation (called GenDomus) for the genetic analysis as well as from the observations obtained from interviews with geneticists.
In this work, we presented a motivating scenario that illustrate how the GenDomus application can facilitate the genetic analysis.
To understand how the GenDomus application facilitates the activities of genetic analysis, we provided a narrated motivating scenario called “Collaborative Room”. This scenario, from which a demonstration of GenDomus for the stakeholders was made, allowed us to identify in more detail the guidelines necessary to design UI’s suitable for the genetic analysis.
becomes a powerful tool that allows designers to design UI’s suitable for the genetic analysis domain. It is important to note that, just as the data consumption needs in the genetic analysis domain are constantly evolving, the guidelines presented in this paper are susceptible to refinements as the domain needs are updated.
For the future, we will implement the low-level guidelines into the GenDomus application and will plan to validate the application in real scenarios.
Acknowledgements. The author thanks the members of the PROS Center’s Genome group for fruitful discussions. In addition, it is also important to highlight that Secretaría Nacional de Educación, Ciencia y Tecnología (SENESCYT) and Escuela Politécnica Nacional from Ecuador and the Ministry of Higher Education, Science and Technology (MESCyT) from Santo Domingo, Dominican Republic, have supported this work. This project also has the support of Generalitat Valenciana through project IDEO (PROMETEOII/2014/039) and Spanish Ministry of Science and Innovation through project DataME (ref: TIN2016-80811-P).
The author thanks Francisco Valverde Giroméand María JoséVillanueva Del Pozo for their collaboration with this project.
References
1. Mardis, E.R.: The impact of next-generation sequencing technology on genetics. Trends Genet.24(3), 133–141 (2008)
2. Danecek, P., et al.: The variant call format and VCF tools. Bioinformatics27(15), 2156– 2158 (2011).https://doi.org/10.1093/bioinformatics/btr330
3. Iñiguez-Jarrin, C., García, A., Reyes, J.F., Pastor, O.: GenDomus: interactive and collaboration mechanisms for diagnosing genetic diseases. In: ENASE 2017 - Proceedings of the 12th International Conference on Evaluation of Novel Approaches to Software Engineering, Porto, Portugal, 28–29 April 2017, pp. 91–102 (2017).https://doi.org/10.5220/
0006324000910102
4. Hart, S.N., Duffy, P., Quest, D.J., Hossain, A., Meiners, M.A., Kocher, J.-P.: VCF-Miner: GUI-based application for mining variants and annotations stored in VCF files. Brief. Bioinform.17(2), 346 (2016).https://doi.org/10.1093/bib/bbv051
5. Chatzimichali, E.A., et al.: Facilitating collaboration in rare genetic disorders through effective matchmaking in DECIPHER. Hum. Mutat.36(10), 941–949 (2015).https://doi.org/
10.1002/humu.22842
6. Alemán, A., Garcia-Garcia, F., Salavert, F., Medina, I., Dopazo, J.: A web-based interactive framework to assist in the prioritization of disease candidate genes in whole-exome sequencing studies. Nucleic Acids Res. 42(W1), 1–6 (2014). https://doi.org/10.1093/nar/
gku407
7. Baier, H., Schultz, J.: ISAAC - InterSpecies Analysing Application using Containers. BMC Bioinform.15(1), 18 (2014).https://doi.org/10.1186/1471-2105-15-18
8. Coll, F., et al.: PolyTB: a genomic variation map for Mycobacterium tuberculosis. Tuberculosis (Edinb)94(3), 346–354 (2014).https://doi.org/10.1016/j.tube.2014.02.005 9. Duncan, S., Sirkanungo, R., Miller, L., Phillips, G.J.: DraGnET: software for storing,
managing and analyzing annotated draft genome sequence data. BMC Bioinform.11, 100 (2010).https://doi.org/10.1186/1471-2105-11-100
11. Genetic Alliance, District of Columbia Department of Health: Understanding Genetics. Genetic Alliance (2010).https://www.ncbi.nlm.nih.gov/books/NBK132149/
12. Villanueva, M.J., Valverde, F., Pastor, O.: Involving end-users in domain-specific languages development experiences from a bioinformatics SME. In: ENASE 2013 - Proceedings of the 8th International Conference on Evaluation of Novel Approaches to Software Engineering, pp. 97–108 (2013).https://doi.org/10.5220/0004450000970108
13. Fiware.org: Welcome to the FIWARE Wiki (2016)
14. Introduction to WireCloud.https://wirecloud.conwet.etsiinf.upm.es/slides/1.1_Introduction. html#slide1
15. Fiware Catalogue - 2D-UI.http://catalogue.fiware.org/enablers/2d-ui
16. Fiware.org: FIWARE Catalogue - Application Mashup - Wirecloud (2015). https:// catalogue.fiware.org/enablers/application-mashup-wirecloud
17. FIWARE Academy: Application Mashup Generic Enabler (WireCloud).http://edu.fiware. org/course/view.php?id=53. Accessed 24 Apr 2016
18. Reyes Román, J.F., Pastor, Ó., Casamayor, J.C., Valverde, F.: Applying conceptual modeling to better understand the human genome. In: Comyn-Wattiau, I., Tanaka, K., Song, I.-Y., Yamamoto, S., Saeki, M. (eds.) ER 2016. LNCS, vol. 9974, pp. 404–412. Springer, Cham (2016).https://doi.org/10.1007/978-3-319-46397-1_31
19. Tidwell, J.: Designing Interfaces, vol. XXXIII, no. 2. O’Reilly, Sebastopol (2012) 20. National Human Genome Research Institute: Biological Pathways Fact Sheet - National
Detection Framework
Tashreen Shaikh Jamaluddin1, Hoda Hassan2(&), and Haitham Hamza3
1 Computer Science Department, AASTMT Academy,
Qism El-Nozha, Cairo, Egypt [email protected]
2 Electrical Engineering Department, British University in Egypt,
ElShrouk, Cairo, Egypt [email protected] 3 Computer Science Department, Cairo University,
Ahmed Zewail st., Cairo, Egypt [email protected]
Abstract. Service-Oriented Computing is largely accepted as a well-founded
reference paradigm for Oriented Architecture that integrates Service-Oriented Middleware and the Web Service interaction patterns. In most SOA applications, SOAP as a communication protocol is adopted to develop Web services. SOAP is highly extensible and ensures confidentiality and integrity as specified within the WS-Security standards. Securing this protocol is obviously a vital issue for securing Web services and SOA applications.
One of the functionalities of SOM is to provide strong security solutions for SOC based applications. As distinct models of SOM started to develop to suit particular requirements, a complete security solution for SOA applications emerged as a new challenge. Moreover, with the wide adoption of SOC, web service applications are no longer contained within tightly controlled environ-ments, and thus could be subjected to malicious attacks, such as Denial of Service attacks. To present, one of the most critical issues for SOM is the absence of a complete security solution. This is a state that threatens the suc-cessfulness of the Web services and SOA applications.
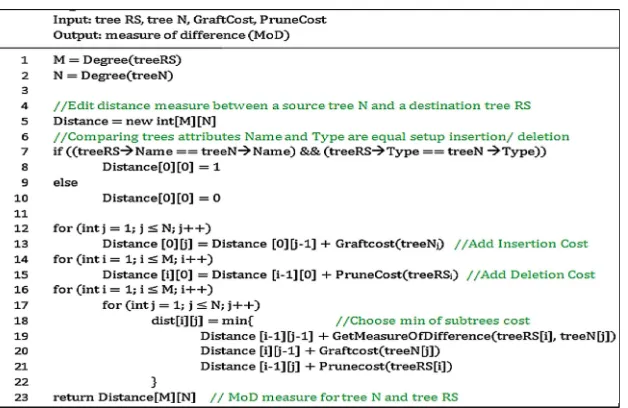
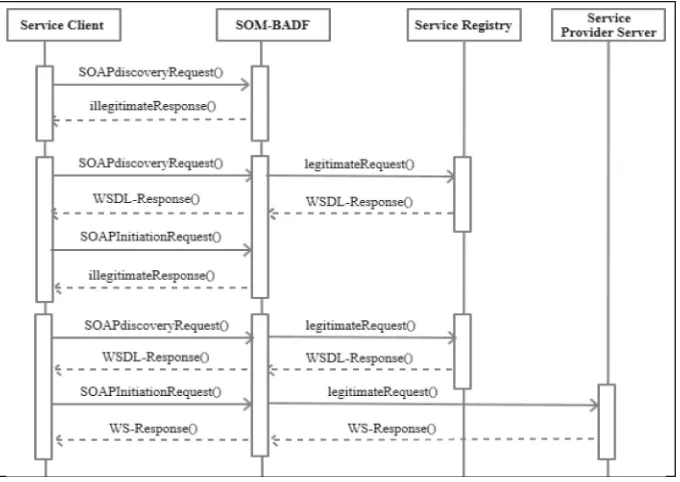
Our proposed Biologically Inspired Anomaly Detection Framework presents a generic security service that protects web services against denial of service attacks at the service-oriented middleware layer. It employs three processes, namely: (i) the Initiation Process, (ii) the Recognition Process and (iii) the Co-stimulation Process. These processes constitute the detection mechanism of DoS attacks usually infused in the SOAP message in the service interaction of SOA. To evaluate our work, we have developed a prototype that showed that our proposed security service was able to detect SOAP-based DoS attacks targeting a web service. The results show that the proposed prototype was capable to detect most attacks administered to the system. The average percentage of attack detection for our prototype was 73.41% as compared to an external commercial parser which was 44.09%.
©Springer International Publishing AG, part of Springer Nature 2018 E. Damiani et al. (Eds.): ENASE 2017, CCIS 866, pp. 23–47, 2018.
Keywords: Service-Oriented Computing (SOC) Service-Oriented Architecture (SOA)
Web service Service-Oriented Middleware (SOM)
SOAP message Denial of Service (DoS) attacks
1 Introduction
Service-Oriented Architecture (SOA) serves as a flexible architectural approach to create and integrate software systems built from autonomous services [1, 2]. With SOA, integration becomes protocol-independent, distributed, and loosely cou-pled, i.e. clean separation of service interfaces from internal implementations, as end solution that is likely to be composed of services. In SOA, software resources are packaged as“services”, which are self-contained modules that provide standard
busi-ness functionality. These modules are independent of the state or context of other services. The concept of developing applications from standalone services further advanced to incorporate web services. A web service is a specific kind of service that exposes its feature over the Web using standard protocols and Internet languages through an identifying URI [3]. Web service protocols and technologies include: XML, XML Schema, Web Services Description Language (WSDL), Universal Discovery Description and Integration (UDDI) and Simple Object Access Protocol (SOAP). Web-service-based applications can be developed from services that can be accessed and integrated over the Internet using open Internet standards [3, 4]. Web Services has published interface where it communicates with other requesting execution of their operations in order to collectively support a common business task [5]. In most web-service based-applications, SOAP is adopted as the underlying communication pro-tocol. SOAP is a highly extensible protocol and ensures confidentiality and integrity as specified within the WS-Security standards [4].
Service-Oriented Computing (SOC) is now largely accepted as a well-founded reference paradigm for SOA that integrates SOM and the web service interaction pattern. SOC paradigm refers to the set of concepts, principles, and methods that represent computing in SOA, in which software applications are constructed based on independent component services with standard interfaces. The main advantage of this approach is interoperability and loose coupling among software components that allow users to use commonly required services to develop their applications [6]. In SOC Service-Oriented Middleware (SOM) is an essential software layer that provides abstraction, interoperability and other services like the distribution of functionality, scalability, load balancing and fault tolerance [7]. With the emerge of software as a service (SaaS) and SOM, the concept of a more sophisticated framework under SOC came into existence. Thus, SOM was developed as a vehicle to ease the use of the SOC by offering solutions and approaches that made SOC more usable and feature-rich.
Moreover, as there are no standard security guidelines for designing SOM [6], for application developers, it became difficult to provide secure access to services and message protection to the accessing party in a distributed environment. Ultimately, it affects the operation of SOM, which is supposed to improve security features of SOC [6]. To fully utilize security features of SOM within the business environment, vendors started to develop SOM functionalities that were suited to their particular business requirements. Several SOM security models that were studied in [6,7] operate in an SOA environment, yet they do not apply full security solutions. This situation arises the problem to secure applications (exposed as services) mainly because:
No standard security guidelines for security design in SOM,
Highly distributed applications, networks, heterogenous environment, and com-munication load for hardware,
Loosely coupled functionalities (for service integration) for software.
Designing independent SOM models only incorporate the set of functionalities required within the application domain, but generate the risk of malicious attacks [8]. Usually in XML Denial of Service (DoS) attacks, the operational parameters of mes-sages coming from legitimate users are changed in real-time by adding additional elements or replacing existing elements within the message. As a result, messages between hosts can be easily intercepted and altered, resulting in untraceable intrusion attacks. Therefore, it is paramount to resolve SOM deficiencies in handling unautho-rized access. Especially that SOM is required to deal with large volumes of data and high communication loads over a highly heterogeneous network. To summarize, in order to achieve a secure Web service communication by SOAP messages over dis-tributed environments, well-defined SOM security approaches are needed to provide complete security solutions [9]. A preliminary work proposed by Al-Jaroodi et al. [10] to develop a general set of security requirements through independent“security as a
service”components. These security services can offer a variety of security
function-alities that could be adapted to SOM.
Bio-inspired security approaches have been proposed in literature as an alternative to traditional security systems where the attack or the attack behavior is not previously known. In Bio-inspired security systems attacks and anomalies are detected as changes in the environment or deviations from the normal system behavior in complex problem domains. These domains include both the application and the network-level systems to analyze the intrusion or anomaly detection problems. In Bio-inspired approaches, the role of the “human immune system” is detection and protection from infections
according to two behaviors as follows [11]:
a. Self-optimization process: Leucocytes launches a detection response to invading pathogens leading to unspecific response.
Self-learning process: Immune response remembers past encounters, which repre-sents immunological memory. B-cells and T-cells allow a faster response the sec-ond time around showing a very specific response.
systems, control, and robotics [11]. The application based techniques utilize the self-optimization and self-learning processes for gearing application behavior at a time of intrusion detection. These approaches include detecting deviations from normal behavior of users browsing web pages, to monitor characteristics of HTTP sessions, and to monitor a number of client’s requests. In many of these approaches,
self-optimization or self-organization serve as a primary defense mechanism.
For intrusion detection self-optimization and self-learning are robust and efficient defense mechanism to protect web servers against application layer DoS attacks [11]. Moreover, as these techniques have been popular in solving intrusion detection problems in network and application domain [12], we surmise that it would help us to develop a robust security mechanism to combat DoS attacks.
The main contributions of this extended paper which is based on work in [20] are (i) to present an application-level Bio-inspired Anomaly Detection Framework (BADF) that draws on the ideology of the Danger Theory (DT) previously proposed in [12] for heterogeneous networks. The presented framework is designed as a generic framework that improves the security features of the SOM by applying the DT principles to protect web-service based-applications from Denial of Service (DoS) attacks. (ii) Based on BADF, we derive an architecture for a generic“security as a service”(SECaaS) web
service. Our derived security service is identified as a message-protection service as mentioned in [10]. It aims to protect incoming SOAP messages against XML Denial of Service (DoS) attacks. BADF is evaluated by developing a prototype for the“security
as a service” (SECaaS) architecture, and showing the ability of the SECaaS
web-service to detect different types of DoS attacks induced within SOAP requests. The rest of this paper is organized as follows; Sect.2overviews related work with respect to SOAP message attacks and possible mitigation methods. Section3presents our Bio-inspired Anomaly Detection Framework (BADF) and the SECaaS architecture. In Sect.4 we describe our evaluation environment and results. Finally, in Sect.5 we conclude the paper and mention our future work.
2 Related Work
To secure Web services, WS-Security standard define an XML Schema which is a precise description of the content of any XML document. Though being a very powerful language for restricting the actual appearance of an XML document, i.e. SOAP message, the active use of XML Schema validation is often omitted in XML-processing applications due to performance reasons [1]. However, recent works in [13] have shown that missing XML Schema validation in Web Service server systems enables various XML-SOAP based attack vulnerabilities. The SOAP based attacks exploit XML based messages and parsers, and pave the way to introduce DoS attacks to restrict system’s availability. Several papers addressed the topic of DoS attacks on
SOAP messages as it became crucial to understand the DoS impact on the operation of Web Services.
exploit XML parser to prevent legitimate users from accessing the attacked web services resulting in DoS. Gruschka et al. [15] studied the Coercive parsing and Oversize payload attacks were excessive amount of XML data are infused in the Clients SOAP messages to retaliate the serverfirewall. To detect excessive payload on
firewall Gruschka et al. [15] have proposed a Web service Firewall namely Check Way Gateway, that validates the incoming SOAP requests against the strict XML Schema generated from the WSDLfile associated with the Web Service. Thefirewall performs schema validation through event-based parsing using a SAX (Simple API for XML) interface to detect attacks in the SOAP request. The performance time for thisfirewall is faster than compared to other attacks detection techniques. The authors in [1, 2] classified the SOAPAction spoofing and Oversize payload as DoS attacks were attackers gain access to the servers by exploiting application vulnerabilities though flooding malformed web service requests. They pointed that the advancement in new technologies and standards have generated loopholes that supported the widespread of DoS attacks. In this series, the authors in [29] surveyed the several SOAP based attacks out of which XML injection and Parameter tampering were reported that contaminate SOAP messages to facilitate DoS attacks. XML injection attacks insert and modifies indefinite XML tags within a SOAP message, were as Parameter tampering bypass the input validation in order to access the unauthorized information to achieve DoS attack. Both attacks, compromise the web service availability by exhausting server resources, that requires comprehensive and collaborative defense approach for SOA services.
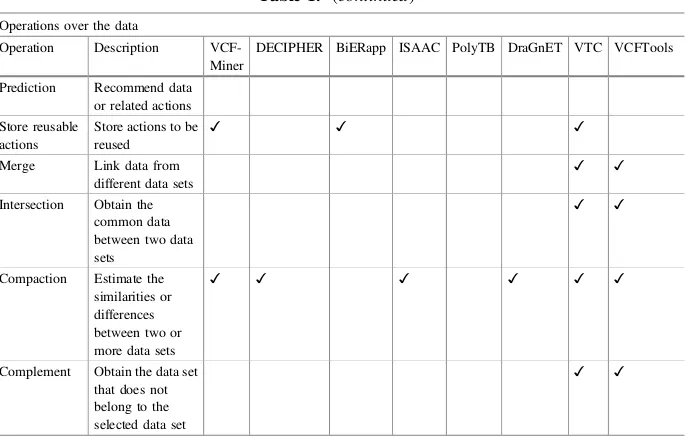
![Fig. 1. Data loading web page allows to select the available samples and data sources to performthe genetic data analysis (Source: [3]).](https://thumb-ap.123doks.com/thumbv2/123dok/3934437.1877857/22.439.56.398.50.482/loading-available-samples-sources-performthe-genetic-analysis-source.webp)
![Fig. 5. CP Schema hardening algorithm (Source [20]).](https://thumb-ap.123doks.com/thumbv2/123dok/3934437.1877857/46.439.54.398.64.266/fig-cp-schema-hardening-algorithm-source.webp)