Volume 1, Issue 1, December 2017
THE ANALYSIS OF 7P MARKETING MIX STRATEGY ON POWDER HERBAL
PRODUCTS AND RED GINGER CANDY IN BATU CITY HOME INDUSTRY
Nasharuddin Mas Faculty of Economics, University of Widyagama Malang, Indonesia
e-mail: [email protected]
Sri Nanik
Faculty of Economics, University of Widyagama Malang, Indonesia
ABSTRACT
This study is to examine the effect of 7P marketing mix strategy on customer satisfaction through purchase decision as mediation variable. The samples are customers of 55 customers of of herbal powder and red ginger candy products in Batu home industry. The data is collected by questionnaires. The research result shows that 7P marketing strategy affects on customer satisfaction, both directly and indirectly through purchase decision. The purchase decision also has positive and significant effect on customer decision of herbal powder and red ginger candy products in Batu home industry.
Keywords: Marketing Mix, Powder Herbal Product, Red Ginger Candy.
| Received November 2017 | Accepted December 2017 | Available online December 2017 | | DOI: http://dx.doi.org/10.18860/mec-j.v1i1.4577
INTRODUCTION
Any company in any field should concern to how to satisfy customers, because this will guarantee the company sustainability. There are many efforts made by company's management to achieve this, including implementing the right marketing strategy to sell the products. There are many marketing strategies known in marketing science, such as the introduction by Philip Kotler with 4P concept (product, price, promotion, and place). The concept of Kotler's 4P marketing strategy has been dominant in marketing management teaching and various trainings. Further developments, experts including Philip Kotler added it to 7P, with addition to Participant, Physical Evidence, and Process. There is also a name
with term marketing mix, as expressed by Kotler and Armstrong (1997) that marketing mix
as the set of controllable marketing variables that the firm bleads to produce the response it wants in the target market.
Batu City is one city in East Java, which is progressing rapidly. Batu city is a tourist destination that triggers the acceleration of this city's development. Automatically all sectors will reap the blessings of this progress, including the home industry of herbal and ginger candy. This research is to analyze 7P marketing mix strategy in herbal and ginger candy industry in some home industry in Batu City.
This study will answer the following questions:
1. Does the marketing mix strategy (7P) directly affect the purchase decision of herbal
powder products and red ginger candy in home industry of Batu City?
2. Does the marketing mix strategy (7P) directly affect on consumer satisfaction of
herbal powder products and red ginger candy in home industry of Batu City?
3. Does the purchase decision directly affect on consumer satisfaction of herbal
4. Does the marketing mix strategy (7P) have an indirect effect on consumer satisfaction of herbal powder products and red ginger candy in home industry of Batu City?
LITERATURE REVIEW
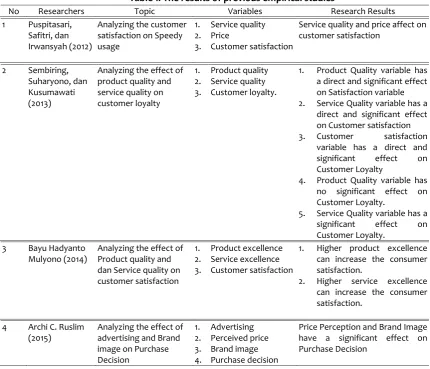
The results of relevant empirical studies of marketing mix strategies, purchase decisions, and customer satisfaction are shown in table 1 below.
Table 1: The results of previous empirical studies
No Researchers Topic Variables Research Results
1 Puspitasari,
Service quality and price affect on customer satisfaction a direct and significant effect on Satisfaction variable 2. Service Quality variable has a
direct and significant effect on Customer satisfaction
3. Customer satisfaction
variable has a direct and
significant effect on
Customer Loyalty
4. Product Quality variable has no significant effect on Customer Loyalty.
5. Service Quality variable has a
significant effect on
Customer Loyalty.
1. Higher product excellence can increase the consumer satisfaction.
2. Higher service excellence can increase the consumer
Price Perception and Brand Image have a significant effect on Purchase Decision
Source: Observation Results, 2017.
METHODS
Figure 1 shows the model to explain the relationship among variables within this research. Based on the relation, the research hypotheses can be stated below.
H1: Marketing mix strategy (7P) has a direct effect on purchase decision of herbal powder and red ginger candy products in Batu home industry.
H2: Marketing mix strategy (7P) has a direct effect on Customer satisfaction of herbal powder and red ginger candy products in Batu home industry.
H3: Purchase decision has a direct and significant effect on Customer satisfaction of herbal powder and red ginger candy products in Batu home industry.
H4: Marketing mix strategy (7P) has an indirect effect through purchase decisions on
consumer satisfaction of herbal powder and red ginger candy products in Batu home industry.
Sample
Umar (2013) explained that sample is part of number and characteristics of population. The sampling decision is based on theory expressed by Arikunto (1998), namely: "If the subject is less than 100 they should be taken all, it is a population study. Furthermore, the large subject can be taken between 10% - 15% or more ". Therefore, this study samples are 55 people.
Descriptive Analysis
Descriptive analysis in this research describes the frequency, amount of data, minimum value, maximum value, average, and assessment criterion, as shown in table 2 below.
Table 2. Category Scale
Scale Category
1.00 - 1.80 Very low
1.81 - 2.60 Low
2.61 - 3.40 Medium
3.41 - 4.20 High
4.21 - 5.00 Very high
Source: Adapted from Arikunto (2006).
Inferential Analysis
The research model proposes four hypotheses. It consists of three direct effect analysis and one indirect effect analysis. This study used structural equation model (SEM) to analyze the research hypotheses.
RESULTS
The results of descriptive statistical analysis
Consumer response shows good response to herbal powder product and red ginger candy in home industry for encapsulated in Marketing Strategy (7P) variable. It consisting of 14 items of question. The "disagree" and "strongly disagree" answer percentages are very small. The highest average score is the X15 question item (Product introduction through the family planning meeting), and the lowest is the X14 question item (adequate parking area).
Consumer response shows good response to herbal powder product and red ginger candy in home industry for encapsulated in Purchase Decision. It consists of 10 items question. The "disagree" and "strongly disagree". Percentage is very small. The highest average score is X29 question item (consumer repurchase), and the lowest is the X23 question item (product information for consumers is easy to find).
questions. Meanwhile, "disagree" and "strongly disagree". The percentage is very small. The highest average score is Y15 question item (the customer will repurchase in future), and lowest is the Y12 question item (the employee's service performance is consistent with my expectations).
Test Reliability
The research instrument is considered reliable if the Cronbach Apha coefficient is greater than or equal to 0.60 (Malhotra, 2004). Cronbach Apha coefficient values of each research variables are explained below.
1. Cronbach Apha coefficient value of Marketing Strategy variable with 14 items questions
is 0.778.
2. Cronbach Apha coefficient value of Purchase Decision variable with 10 items of question
is 0.774.
3. Cronbach Apha coefficient value of Consumer Satisfaction variable with six items of
questions is 0.795.
The Cronbach Apha values of three research variables are greater than 0.60. Therefore, it can be said that the research instruments are reliable and can be used for the subsequent analysis.
Test Validity
The instrument validity of this study is tested by the loading factor. The instrument is
valid if the probability of loading factor ≤ 0.05, or loading factor ≥ 0.30, or the critical ratio ≥
2. The testing results are shown in table 3, 4 and 5 below.
Table 3. Validity of Marketing Strategies
Item Loading
Factor
Critical Ratio
Probability Description
x11 0.784 7.657 0.000 Valid
x12 0.812 8.162 0.000 Valid
x13 0.824 7.918 0.000 Valid
x14 0.469 5.632 0.000 Valid
x15 0.452 4.726 0.000 Valid
x16 0.583 6.447 0.000 Valid
x17 0.700 7.190 0.000 Valid
x18 0.759 8.086 0.000 Valid
x19 0.683 8.235 0.000 Valid
x110 0.822 8.267 0.000 Valid
x111 0.786 8.371 0.000 Valid
x112 0.951 7.937 0.000 Valid
x113 0.858 7.926 0.000 Valid
x114 1.000 0.000 Valid
Source: Primary Data Processed, 2017
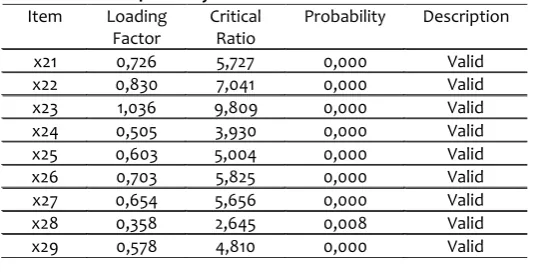
Table 4. Validity of Purchase Decision Variable
Item Loading
Factor
Critical Ratio
Probability Description
x21 0,726 5,727 0,000 Valid
x22 0,830 7,041 0,000 Valid
x23 1,036 9,809 0,000 Valid
x24 0,505 3,930 0,000 Valid
x25 0,603 5,004 0,000 Valid
x26 0,703 5,825 0,000 Valid
x27 0,654 5,656 0,000 Valid
x28 0,358 2,645 0,008 Valid
x210 1,000 0,000 Valid Source: Primary Data Processed, 2017
Table 5. Variable Validity of Consumer Satisfaction
Item Loading
Factor
Critical Ratio
Probability Description
y11 1,000 0,000 Valid
y12 0,660 4,230 0,000 Valid
y13 0,713 7,389 0,000 Valid
y14 0,721 6,908 0,000 Valid
y15 0,352 3,886 0,000 Valid
y16 0,904 7,353 0,000 Valid
Source: Primary Data Processed, 2017
The loading probability values of three research variables are respectively ≤ 0.05, or
loading factor ≥ 0.30, or the critical ratio ≥2. Therefore, all the research instruments are
considered valid and can be used for the subsequent analysis.
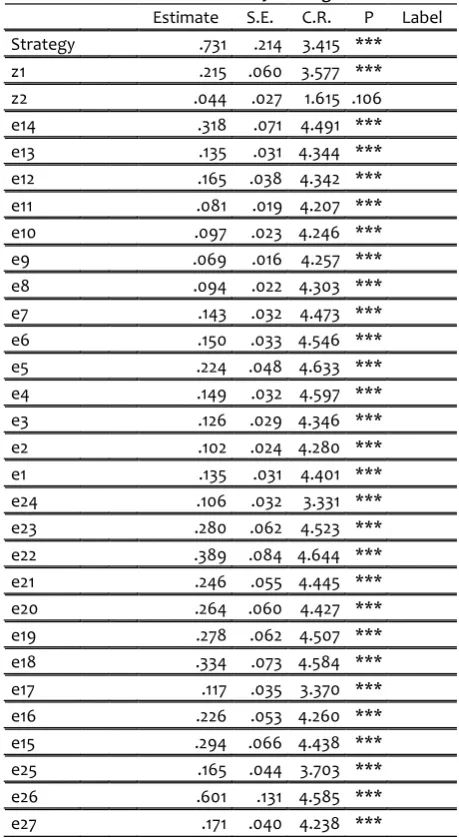
Normality assumption
The normality test is shown in table 6 below.
Table 6. Normality Testing
Estimate S.E. C.R. P Label
Strategy .731 .214 3.415 ***
z1 .215 .060 3.577 ***
z2 .044 .027 1.615 .106
e14 .318 .071 4.491 ***
e13 .135 .031 4.344 ***
e12 .165 .038 4.342 ***
e11 .081 .019 4.207 ***
e10 .097 .023 4.246 ***
e9 .069 .016 4.257 ***
e8 .094 .022 4.303 ***
e7 .143 .032 4.473 ***
e6 .150 .033 4.546 ***
e5 .224 .048 4.633 ***
e4 .149 .032 4.597 ***
e3 .126 .029 4.346 ***
e2 .102 .024 4.280 ***
e1 .135 .031 4.401 ***
e24 .106 .032 3.331 ***
e23 .280 .062 4.523 ***
e22 .389 .084 4.644 ***
e21 .246 .055 4.445 ***
e20 .264 .060 4.427 ***
e19 .278 .062 4.507 ***
e18 .334 .073 4.584 ***
e17 .117 .035 3.370 ***
e16 .226 .053 4.260 ***
e15 .294 .066 4.438 ***
e25 .165 .044 3.703 ***
e26 .601 .131 4.585 ***
Estimate S.E. C.R. P Label
e28 .212 .049 4.323 ***
e29 .207 .045 4.603 ***
e30 .279 .066 4.245 ***
Source: Primary Data Processed, 2017
Table 6 shows the values e1 to e30, and z1 and z2. All the values are ≤ 0.05 and CR
values ± 2.58, except z2. Accordingly, the data is distributed normally and can be used for the subsequent analysis.
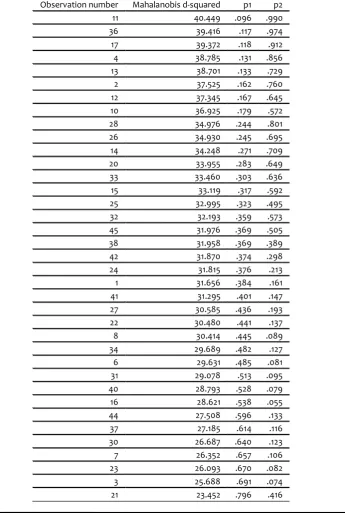
Multivariate Testing for Outliers Assumptions
Multivariate Outliers is tested by Mahalanobis Distance or Mahalanobis d-Squared. The results are shown in table 7 below.
Table 7. Multivariate Detection
Observation number Mahalanobis d-squared p1 p2
11 40.449 .096 .990
36 39.416 .117 .974
17 39.372 .118 .912
4 38.785 .131 .856
13 38.701 .133 .729
2 37.525 .162 .760
12 37.345 .167 .645
10 36.925 .179 .572
28 34.976 .244 .801
26 34.930 .245 .695
14 34.248 .271 .709
20 33.955 .283 .649
33 33.460 .303 .636
15 33.119 .317 .592
25 32.995 .323 .495
32 32.193 .359 .573
45 31.976 .369 .505
38 31.958 .369 .389
42 31.870 .374 .298
24 31.815 .376 .213
1 31.656 .384 .161
41 31.295 .401 .147
27 30.585 .436 .193
22 30.480 .441 .137
8 30.414 .445 .089
34 29.689 .482 .127
6 29.631 .485 .081
31 29.078 .513 .095
40 28.793 .528 .079
16 28.621 .538 .055
44 27.508 .596 .133
37 27.185 .614 .116
30 26.687 .640 .123
7 26.352 .657 .106
23 26.093 .670 .082
3 25.688 .691 .074
Observation number Mahalanobis d-squared p1 p2
29 22.846 .822 .434
18 22.279 .844 .432
9 21.440 .874 .489
43 20.852 .892 .460
19 20.017 .916 .471
5 18.882 .942 .517
35 18.868 .943 .263
39 15.594 .986 .528
Source: Primary Data Processed, 2017
Multivariate Outliers is tested by Mahalanobis Distance or Mahalanobis d-Squared at level of significance 0.05. Multivariate Outliers case occurs if Mahalanobis Distance is greater than Chi-Square. Table 7 shows all the Mahalanobis Distance or Mahalanobis d-Squared values have smaller values than Chi-Square of 707.457. It means that there is no multivariate outliers can be used for the subsequent analysis.
Structural Equation Model Test (SEM)
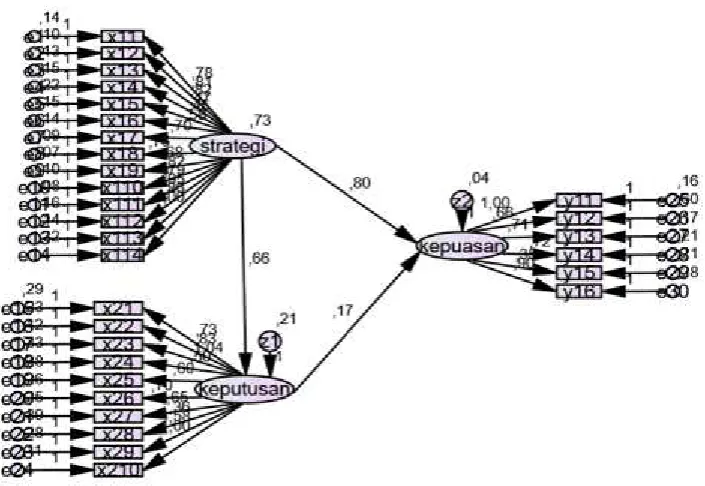
The structural equation model test is intended to find out the overall model of fit and the effect between variables in the research model. The result of SEM analysis can be seen in Figure 2 below.
Figure 2. SEM Test
Figure 2. Model Test Results for the Relationship between Marketing Strategy, Purchase Decision, and Consumer Satisfaction.
Figure 2 is evaluated based on goodness of fit indices, as shown in Table 8 below.
Table 8 Evaluation of Goodness of Fit Indices Overall Model Criteria
Goodness-of-Fit
Indices Cut-of Value Test Results Description
Chi Square Should small 707,457 Good
Sign. Probability ≥ 0,05 0,000 Good
CMIN/DF ≤ 2 atau 3 1,760 Less good
GFI ≥ 0,90 0,553 Good
TLI ≥ 0,90 0,772 Good
CFI ≥ 0,90 0,790 Good
RMSEA ≤ 0,08 0,131 Good
Source: Primary Data Processed, 2017
Table 8 shows the model meet all all assumption, which is lower or greater than the required cut-off values. Therefore, the model can be accepted and tested further.
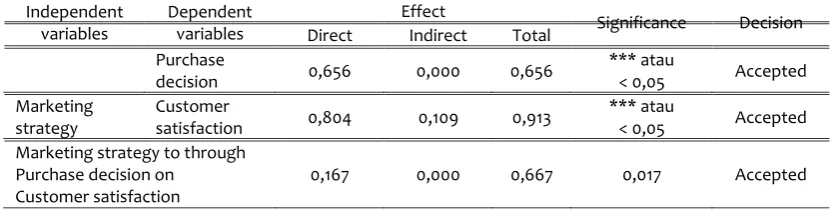
The Effect among Variables
The effect between variables is tested by Structural Equation Model with Amos 24 software. The test result of direct effect is shown in table 9 and the result for indirect effect is shown in table 10 below.
Table 9. Effect among variables
Independent
(t count) Significance Description Marketing
satisfaction 0,804 5,845
*** atau
< 0,05 Significant Purchase
decision
Customer
satisfaction 0,167 1,363 0,173 Insignificant
Source: Primary Data Processed, 2017
Table 10. Indirect effect testing
Independent
satisfaction 0,804 0,109 0,913
*** atau
Source: Primary Data Processed, 2017
DISCUSSION
Hypothesis 1 said that Marketing mix strategy (7P) has a direct effect on purchase decision of herbal powder and red ginger candy products in Batu home industry. Table 9 and Table 10 above show that critical ratio for this construct path is 5.601 with probability value of *** or <0.05. The role of thumb explained that path of construct relationship is
significant if the critical value (≥ 2.0 ratio) and significance value t (probability) ≤ 0.05. Since
the values obtained are within this standard, it can be said that hypothesis 1 is accepted. Therefore, there is a significant and direct effect of the marketing mix strategy (7P) on the purchase decision of herbal powder and red ginger candy products in Batu home industry. Therefore, hypothesis 1 is accepted.
Hypothesis 2 said that Marketing mix strategy (7P) has a direct effect on Customer satisfaction of herbal powder and red ginger candy products in Batu home industry. Table 9 and Table 10 above show that critical ratio for this construct lane is 5.845 with significance value of t 0.173> 0.05. The role of thumb explained that path of construct relationship is
significant if the critical value (≥ 2.0 ratio) and significance value t (probability) ≤ 0.05. Since
Hypothesis 3 said that Purchase decision has a direct and significant effect on Customer satisfaction of herbal powder and red ginger candy products in Batu home industry. Table 9 and Table 10 above show that critical ratio for this construct path is 1.363 with significance value t (probability) *** or <0.05. The role of thumb explained that path of
construct relationship is significant if the critical value (≥ 2.0 ratio) and significance value t
(probability) ≤ 0.05. Since the values obtained are within this standard, it can be said that
hypothesis 3 is accepted. Therefore, there is a significant and direct effect of purchase decisions on consumer satisfaction of herbal powder and red ginger candy products in Batu home industry. Therefore, hypothesis 3 is accepted.
Hypothesis 4 said that Marketing mix strategy (7P) has an indirect effect through purchase decisions on consumer satisfaction of herbal powder and red ginger candy products in Batu home industry. Table 10 shows that value of indirect effect is 0.109, while the others are 0.913 (total effect) = 0.804 (direct effect) + 0.109 (indirect effect). Therefore, it can be said that indirect effect of marketing mix strategy (7P) through purchase decisions on consumer satisfaction of herbal powder and red ginger candy products in Batu home industry is 0.667 at significance level of 0.017 < 0.05. It means Marketing mix strategy (7P) has an indirect effect through purchase decisions on consumer satisfaction of herbal powder and red ginger candy products in Batu home industry. Therefore, hypothesis 4 is accepted.
As known, that Batu City is known as Tourism City, Culinary City, and City Education. There are many tourist attractions in the regional Agro Wisata, Selecta, Coban Rondo, Apple Pickles and so forth. Batu City is also a strategic location because the distance is not far from Malang City. The number of places this tour certainly has a significant economic effect for people of Malang, such as culinary business. Home industry that produces herbal powder and red ginger candy does not miss catching this opportunity by trying to peddle its products to people who visit this city. Various types of products from home industry are offered, but they still maintain customer satisfaction by always improving the quality of its products as proved by the results of this study.
CONCLUSION
This research analyzed four hypothesis, three are direct effect and one is indirect effect through mediation variable. The results of hypothesis test results are explained in detail below.
1. There is a significant and direct effect of the marketing mix strategy (7P) on the
purchase decision of herbal powder and red ginger candy products in Batu home industry
2. There is a significant and direct effect of marketing mix strategy (7P) on consumer
satisfaction of herbal powder and red ginger candy products in Batu home industry.
3. There is a significant and direct effect of purchase decisions on consumer satisfaction of
herbal powder and red ginger candy products in Batu home industry.
4. There is an indirect effect of Marketing Mix Strategy (7P) through Purchase Decision on
Consumer Satisfaction product of herbal powder and red ginger candy products in Batu home industry.
REFERENCES
Anderson, E. W; Fornell, C and Lehmann, D.R. 1994. “Customer Satisfaction, Market Share,
and Profitability: Finding From Sweden”, Journal of Marketing, Vol.58, p.53-56
Ahire, L Sanjay, Damodar Y Golhar, Matthew A Waller. 1996, “Development and Validation
Arikunto. 1997. Metode Penelitian. Jakarta: Erlangga.
Assael, H, 1995. Consumer Behavior and Marketing Action, 5th edition, South Western
College Publishing, Cincinatti, OH.
Bennett, George, 1996, “Relationship Formation and Governance in Customer Markets:
Transactional Analysis Versus The Behaviorist Approach”, Journal of Marketing
Management 12(5): 417-436
Butz, Howard E and Goodstein, Leonard D, 1996, Marketing Customer Value: Gaining The
Strategic Advantage
Ferdinand, Augusty, 2006. Metode Penelitian Manajemen, Badan Penerbit Universitas
Diponegoro, Semarang.
Fornell, C. Johnson, MD Anderson, EW Cha, and Bryant BE, 1996. The American Customer
Satisfaction Index: Nature, Purpose, and Findings, Journal of Marketing, Vol.60.
Gujarati, Damodar N. 2005. Basic Econometrics, 3rd.ed. New York: McGra-Hill, Inc.
Ghazali, Imam, 2001. Aplikasi Analisis Multivariate Dengan Program SPSS, Badan Penerbit
Universitas Diponegoro, Semarang.
Ghazali, Imam. 2003. Analisis Multivariate dengan program SPSS. Semarang: Penerbit
Universitas Diponegoro.
Gronroos, Christian, 1990. Relationship Approach to The Marketing Function in Service
Contexts:, Journal of Business Research 29(1): 3-12
Gronroos, Christian, 1994. The Marketing Strategy Containum: Toward A Marketing
Concept for The 1990’s”, Management Decision 29(1): 7-13.
Hadi, S. 2000. Statistik 2. Jogyakarta: Andi Offset.
Haidir, H. (2006). Analisis Faktor- Faktor yang Mempengaruhi Kepuasan Pelanggan Untuk
Meningkatkan Loyalitas Pelanggan Produk Telkom Flexi. Semarang: Tesis S2
Universitas Diponogoro.
Kohli, Ajay J., and Jaworski, B.J., 1990. Market Orientation: The Construct, Research
Propositions, and Managerial Implication. Journal of Marketing, 54:1-18
Kotler, Philip and Garry Amstrong, 1996, Dasar-Dasar Pemasaran (Principles of Management,
Prentice Hall Inc
Kotler, P. 2000. Principles Of Marketing. Jakarta: Prenhallindo.
Liu, MC, 2005. The Multi Dimensionaland Hierarchical Structure of Perceived Quality and
Customer Satisfaction, International Journal of Management, Vol 22, No. 3
Mital, Vikas, William T. Ross and Patrick M Baldasare, 1998. The Asymetric Impact of Negative and Positive Attribute Level Performance on Overall Satisfaction and
Repurchase Intentions, Journal of Marketing, Vol. 62. p.33-47.
Mulyono, Bayu Hadyanto. 2013. Analisis Pengaruh Kualitas Produk dan Kualitas Layanan terhadap Kepuasan Konsumen (Studi Kasus pada Perumahan Puri Mediterania
Semarang). Tesis S2 Universitas Diponegoro.
Narver, John C., and Slater, Stanley F., 1990. The Effect of Marketing Orientation and
Business Profitability, Journal of Marketing, 54(4):20-35.
Parasuraman, A, 1997. Reflections on Gaining Competitive Advantage Through Customer
Value, Journal of The Academy of Marketing Science, Vol. 25, No. 2, p.154-161
Parasuraman, A, V.A. Zeithami and L.L. Berry, 1988. A Multiple-Item Scale for Measuring
Consumer Perceptions of Service Quality, Journal of Retailling, Vol. 64, p.12-40.
Puspitasari, Safitri, Irwansyah. 2013. Analisis Kepuasan Konsumen Terhadap Pengguna
Speedy pada PT Telkom. Tesis S2 Universitas Diponegoro.
Ruslim, Archi C. 2015. Pengaruh Iklan, Persepsi Harga dan Citra Merek terhadap Keputusan
Selnes, Fred, 1993. An Examination of The Effect of Product Performance on Brand
Reputation, Satisfaction, Satisfaction and Loyalty, Europan Journal of Marketing
27(9), 19-35.
Sembiring, Suharyono, Kusumawati. 2014. Pengaruh Kualitas Produk dan Kualitas Pelayanan terhadap Kepuasan Pelanggan Dalam Membentuk Loyalitas Pelanggan (Studi
pada Pelanggan Mcdonald’s Mt. Haryono Malang). Jurnal
Song, Michal and Parry, Mark E., 1997. A Croos National Comparative Study of new Product
Development Process : Japan and The US, Journal of Marketing.
Sugiyono. (2010). Metode penelitian pendidikan: Pendekatan kuantitatif, kualitatif, dan R&D.
Bandung: Alfabeta.
Supranto, J. 2003. Metode Riset. Jakarta: PT Asdi Mahastya.
Tjiptono, F. 2008. Strategi Pemasaran. Edisi III. Yogyakarta: Andi.
Urban Glen L. And Hauser John R., 1998. Desight and Marketing of New Products, Prentice
Hall Inc
Widyaswati, R. 2010. Analisis Faktor-faktor yang Mempengaruhi Kepuasan Sehingga Tercipta Word Of Mouth Yang Positif pada Pelanggan Speedy DI Semarang.
Semarang: Tesis S2 Universitas Diponegoro.
Zeithami, Valerie A, 1987. Defining and Relaying Price, Perceived Quality, and Perceived
Value, Marketing Science, Institute, Cambridge, MA Report No.87-101
Zheng, YS and HO, TH, 2003. Setting Customer Expectation in Service Delivery: An Integrated