Encyclopedia
of
TRADING ADVANTAGE
Trading without Fear I Richard W. Arms, Jr.
Neural Network Time Forecasting of Financial Markets / E. Michael
Option Market Making I Alan J. Baird
Genetic Algorithms and Investment Strategies Richard J. Jr.
Market Indicators I Richard J. Bauer, Jr., and R. Bernstein
The Hedge Fund Edge I Mark
Encyclopedia of Chart Patterns I Thomas N.
Macro Trading and Investment Strategies I Gabriel
Beyond Technical Analysis Tushar Chande
New Technical Trader ! Tushar Chande and Stanley S.
the flan I Robert
New Market Timing I Thomas R.
The New Science of Technical Analysis / Thomas R. DeMark
Point and Figure Charting I Thomas J. Dorsey
Trading for a Living I Dr. Alexander Elder
Study Guide for Trading for a Living Dr. Alexander Elder
The Day Trader's Manual I William F. Eng
The Course I George A. Fontanills
Options Course I George Fontanills
Pattern, Price & Time A.
Profits from Natural Resources I Roland A. Jansen
Trading Game I Ryan Jones
Systems Methods, Edition I Perry
to Win I Kiev, M.D.
Intuitive Trader I Robert Koppel
I Christopher May
McMillan on Options I Lawrence G.
Trading on Expectations I Brendan
Technical Analysis I J. Murphy
Visual Investor John J. Murphy
Candlesticks I Steve Nison
Cybernetic Trading Strategies Murray Jr.
Option Advisor I Bernie G.
Fundamental Analysis
Study Guide to Accompany Analysis Schwager
Managed I Jack Schwager
The New Market Wizards I Jack Schwager
Analysis Schwager
Study Guide to Accompany Analysis Schwager
Schwager on Futures I Jack Schwager
Gaming the Market I Ronald B. Shelton
Dynamic Option Selection System I Howard L. Simons
Strategies, Second Edition Smith
Trader Victor Sperandeo
Campaign Sweeney
The Trader's Tax Survival Guide, Revised Edition I Ted Tesser
The Mathematics of Money Management I Ralph Vince
New Money Management I Ralph Vince
Trading Applications of Japanese Candlestick Charting I Gary Wagner and Trading Chaos Bill Williams
New Trading Dimensions I Bill Williams
LongTerm Secrets to ShortTerm Trading I Williams
Expert Trading Systems I John R. Wolberg
Encyclopedia
of
Chart Patterns
Thomas N. Bulkowski
John
&
Inc.
This book is printed on acidfree paper. ©
Copyright © 2000 by Thomas N. All rights reserved. Published John Wiley & Sons, Inc.
Published simultaneously in Canada.
No part of this publication may be reproduced, stored in a retrieval system or transmitted in any form or by any means, electronic, mechanical, photocopying, recording, scanning or otherwise, except as permitted under Sections or of the United States Copyright Act, without either the prior written permission of the Publisher, or authorization through payment of the appropriate percopy fee to the Copyright Clearance Center, 222 Rosewood Drive, Danvers, MA 01923, (978) 7508400, fax (978) 7504744. Requests to the Publisher for permission should be addressed to the Permissions Department, John Wiley & Sons, Inc., 605 Third Avenue, New York, NY 101580012, fax 8506008,
PERMREQ @
This publication is designed to provide accurate and authoritative information in regard to the subject matter covered. It is sold with the understanding that the publisher is not engaged in rendering professional services. If professional advice or other expert assistance is required, the services of a competent professional person should be sought.
Library of Congress Data:
Bulkowski, Thomas 1957
Encyclopedia of chart patterns / Thomas N. Bulkowski. p. trading advantage)
Includes index. ISBN
1. diagrams, etc. 2.
etc. 3. Technical analysis. I. Title. II. Series.
HG4638.B85 2000
9915789
To my parents,
who
to love me even after my homemade
rocket set the on and to fourlegged best friend,
Rusty,
who saved
life; it
me that I
save
Printed in the United States of America.
Preface
When I was a little tyke I decided the easiest way to riches was to play the stock market. It was, after all, a level playing field, a zerosum game with somebody winning and somebody losing (hint: The winner is always the broker). All one had to do to win was pick the stocks that went up and avoid the stocks that went down. Easy.
I kept this in mind when I graduated from Syracuse University with an engineering degree and showed up early for my first professional job. morning I cracked open the newspaper and plotted my stock picks on a of paper taped to the wall. Bob, my office mate, used the same newspaper to select his stocks. I chose my selections using strict and exhausting fundamen tal research, but Bob simply closed his eyes, twirled his hand around, and plunged his finger into the newspaper. When he opened his eyes and removed his finger, he announced another pick.
After several months of tracking both our selections, I made a startling discovery: I was getting creamed. random selections were beating the tar out of my carefully researched choices. I also discovered something else: I was learning a lot by paper trading.
With the hesitancy and distrust inherited from my parents, I studied two dozen firms before making my final selection and first purchase: I opened a money market account. The timing was excellent; I was earning over on my cash. At first glance, the return might imply a very risky investment but it was not. The prime rate was, after all, at 21%.
Flush with success, I gathered my courage and opened a brokerage account and began investing with the few pennies I saved. Again, the timing was excellent as I caught the beginning of a major bull market. I bought a stock near and watched it go to first tenbagger.
viii Preface
job that would last a lifetime, or so I thought. Almost six months after
my anniversary with the company, I received a letter from the chair man. He congratulated me on my decade with the company and looked forward to even more success for me in the coming years. Six weeks later I was laid off.
I took stock of the situation and decided that, at the age of had had enough. Newspapers term guys like me The Missing Million. We are the ones who, for whatever reason, leave their jobs and decide not to go back into the workforce. We retire. Everyone, and I mean everyone (with the notable excep tion of my cousin Mary her heart), thinks we are nuts. They are right, of course!
For the longest time, I have been fascinated with technical analysis of stocks. In the early years, I considered the little squiggles to be nothing short of voodoo. Still, I was curious as to why the major brokerage houses were hir ing technical analysts in droves. But I did not dare take my eye off the funda mentals simply because I did not know anything about the technicals. Then I discovered Technical Analysis of Stocks and Commodities magazine. During my lunch hour, I would take the elevator down to the library and read back issues. Although I had seen chart patterns in the stocks I bought, I never really attached much significance to them. As some of my selections went sour, I began to view chart patterns with more respect. The fundamentals always looked good, but the technicals were signaling a trend change just as I was about to pull the trigger. The stocks I bought either lost money outright or I sold them too soon and cut my profits short.
Perhaps this has happened to you. You do your fundamental research on a stock, then buy it only to watch it go nowhere for a year or more. Even worse, once you get in, the stock tumbles. Had you looked at the chart the answer was always there. Prices pierced a a top appeared out of nowhere, the relative strength index signaled an overbought situation. In short, any number of technical indicators were screaming that a buy now would cost you your shirt. But you never saw the signs because you had your eyes closed.
You are not alone; I did the same thing for years. I eventually got so frus trated with the performance of my stock selections that I decided to do my own research on technical analysis. I went to the library and read the same thing in many books: A headandshoulders formation works most of the time. What does that mean? Does it mean they are successful % of the time or 90% of the time? No one had the answer. I was not willing to risk my hard earned dol lars on simple bromides. As an engineer I wanted hard, cold facts, not fuzzy platitudes. So, I wrote this book.
At the back of the book is an Index of Chart Patterns. If you suspect your stock is making a chart pattern but do not know what to call it, the Index of Chart Patterns is the first place to look. Page numbers beside each pattern direct you to the associated chapter.
Preface
The chapters are arranged alphabetically, making it easy to locate the chart pattern of interest. Within each chapter, you are first greeted with a "Results Snapshot" of the major findings followed by a short discussion. Then, a "Tour" invites you to explore the chart pattern. "Identification Guidelines," in both table form and indepth discussion, make selecting and verifying choices easier. For simpler chart patterns, the "Tour" and
Guidelines" have been combined into one section.
No work would be complete without an exploration of the mistakes, a the "Focus on Failures" section dissects the cause of failures. The allimport; "Statistics" section follows. Once you can identify a chart pattern, know how is likely to perform, and are alert to possible failure indications, how do you trade it? That is what the "Trading Tactics" and "Sample Trade" sections explore.
If you have ever worked on a car or done some woodworking, then you will recognize the importance of selecting the right tool for the job. You not want to use a flathead when a Phillips works better. Both do the job but they are hardly interchangeable. Sometimes it is not a screwdriver you should be using, but a chisel. Selecting the proper tools and knowing how to use them is half the battle. This book is a lot like that, helping to sort the wheat from the chaff. Sometimes a chart pattern is frightening enough that will want to take profits. At other times, the best trade that you can make is none at all.
cannot give you the experience needed to make money in the stock mar ket using chart patterns. I can only give you the tools and say, "Go to work on paper first." That is the first step in developing a trading style that works for you, one you are comfortable with, one that improves as you do. If you review your paper trades, you will understand why a stoploss order is more than a necessary evil: It is a useful tool. You will improve your ability to predict sup port and resistance levels that will, in turn, allow you to tighten your stops and get out near the top, cut your losses short, and let your profits ride. Simple.
You will discover why the measure rule is so important, especially in tur bulent markets. Unless you are willing to suffer a 20% drawdown, you will understand why the average gain quoted so often in this book may be a best case scenario and will come to grips with why you are still struggling to make it above the most likely gain. You may discover that your girlfriend loves dia monds, but as a chart pattern, you cannot seem to make them pay. One word says it all. Experience.
Good luck.
Acknowledgments
Perhaps several times in your life, something happens that alters the direction your life is taking. That happened to me several years ago when I sub mitted my first article to Technical Analysis of Stocks and Commodities. Much to my surprise and delight, the editor at the time, published the work. That single event sent me spinning off in a new direction.
Nearly a dozen articles later, I called and chatted with him about an idea for a book. He steered me to Pamela van Giessen, senior editor for John & Sons, Inc., publisher of this book. A single email of my idea to
her put a new set of wheels in motion.
Simple words cannot express my thanks to these two outstanding indi viduals. Of course, there are many others such as my younger brother, Jim, the unsung heroes that sometimes gave me a helping hand, formed my support group, or gave me a good, swift kick in the butt. They are not forgotten.
Contents
Introduction
1 Broadening Bottoms
2 Broadening Formations, RightAngled and Ascending
3 Broadening Formations, RightAngled and Descending
4 Broadening Tops
5 Broadening Wedges, Ascending
6 Broadening Wedges, Descending
7 Reversal Bottoms
8 BumpandRun Reversal Tops
9 Cup with Handle
10 DeadCat Bounce
Diamond Tops and Bottoms
12 Double Bottoms
13 Double Tops
14 Flags and Pennants
15 Flags, High and Tight
16 Gaps
Hanging Man
18 Bottoms
19 HeadandShoulders Bottoms, Complex
20 HeadandShoulders Tops
1
12
27
5;
72
87
100
119
135
153
182
197
213
227
240
252
262
276
xiv Contents
21 Tops, Complex
22 Horn Bottoms
23 Horn Tops
24 Inside Days
25 Island Reversals
26 Measured Move Down
27 Measured Move Up
28 OneDay Reversals
29 Outside Days 30 Pipe Bottoms
Pipe Tops
32 Rectangle Bottoms
33 Rectangle Tops
34 Rounding Bottoms
35 Rounding Tops
36 Scallops, Ascending and Descending
37 Shark32
38 Triangles, Ascending
39 Descending
40 Triangles, Symmetrical Bottoms
41 Triangles, Symmetrical Tops
42 Triple Bottoms
43 Triple Tops
44 Wedges, Falling
45 Wedges, Rising
46 Weekly Reversals,
47 Weekly Upside
Statistics Summary Index of Chart Patterns
Subject Index
305
320
332
343
356
369
382
394
404
417
429
439
453
466
477
487
501
511
529
545
560
576
590
603
617
631
642
654
663
669
Encyclopedia
of
Introduction
Jim is struggling.
He is the owner of JCB Superstores and his competitor across town is beating him up; there is blood all over Jim's ledger. He decides it is time to take off the gloves: JCB goes public. He uses the money from the initial public offering to buy his competitor and add a few more stores around town.
With a growing sales base, Jim's clout allows him to negotiate lower prices for the office supplies he is retailing. He passes on part of the savings to his customers, while watching his margins widen, and plows the profits back into building more stores.
Jim calls his friend, Tom, and tells him of his plans to expand the opera tion statewide. They chat for a while and exchange business tactics on how best to manage the expansion. When Tom gets off the phone, he decides to con duct his own research on JCB. He visits several stores and sees the same thing: packed parking lots, people bustling around with full shopping carts, and lines at the checkout counters. He questions a few customers to get a sense of the demographics. At a few he even chats with suppliers as they unload their wares. Back at the office, he does a thorough analysis of the and looks at the competition. Everything checks out so he orders his trading part ners to buy the stock at no higher than
2 Introduction
Several months go by and the economic outlook is as bleak as ever. The
stock eases down to 9. After Tom checks in with Jim for the latest public news, Tom's team buys more. It is an easy score because investors are willing to dump the stock especially as yearend tax selling approaches.
Six weeks later the company releases the sales numbers for JCB; they are better than expected. The stock rises in minutes and closes at And that is just for starters. Six months later, it's clear the economy was never in danger of entering a recession and everyone sees boom times ahead. The stock hits 20.
Years go by, the stock splits a few times, and the holiday season looms. Tom interviews a handful of customers leaving JCB Superstores and discovers that they are all complaining about the same thing: The advertised goods are missing. Tom investigates further and discovers a massive distribution prob lem, right at the height of the selling season. JCB has overextended itself; the infrastructure is simply not there to support the addition of one new store each week.
Tom realizes it is time to sell. He tells his trading department to dump the stock immediately but for no less than They liquidate about a third of their large holdings before driving the stock down below the minimum.
Since it is the holidays, everyone seems to be in a buying mood. Novice investors jump in at what they consider a bargain price. The major brokerage houses climb aboard and tout the stock, but Tom knows better. When the stock recovers to its old high, his trading partners sell the remainder of their holdings. The stock tops out and rounds over. During the next month and a half, the stock drifts down, slowly, casually. There does not appear to be a rush for the a slow trickle as the smart money quietly folds up shop.
Then news of poor holiday sales leaks out. There is a rumor about distri bution problems, merchandising mistakes, and cash flow problems. Brokerage firms that only weeks before were touting the stock now advise their clients to sell. The stock plummets 39% overnight.
One or two analysts say the stock is oversold; it is a bargain and investors should add to their positions. Many bottom fishers follow their brokers' rec ommendation and buy the stock. Big mistake. The buying enthusiasm pushes the price up briefly before a new round of selling takes hold. Each day the stock drops a bit lower, nibbling away like waves washing against a castle of sand. In 2 months' time, the stock is down another 30%.
The following quarter JCB Superstores announces that earnings will likely come in well below consensus estimates. The stock drops another The company is trying to correct the distribution problem, but it is not some thing easily fixed. They decide to stop expanding and to concentrate on the profitability of their existing store base.
Two years later, Tom pulls up the stock chart. The dog has been flat for so long it looks as if its heartbeat has stopped. He calls Jim and chats about the outlook for JCB Superstores. Jim gushes enthusiastically about a new retailing
The Database 3
concept called the Internet. He is excited about the opportunity to sell office supplies online without the need for bricks and mortar. There is some risk because the online community is in its infancy, but Jim predicts it will quickly expand. Tom is so he starts doing his homework and is soon buy ing the stock again.
Investment Footprints
If you picture in your mind the price action of JCB Superstores, you should recognize three chart patterns: a double bottom, a double top, and a deadcat bounce. To knowledgeable investors, chart patterns are not squiggles on a price chart; they are the footprints of the smart money. The footprints are they need to follow as they line their pockets with greater and greater riches. To others, such as Tom, it is hard work and pavement pounding before they dare take a position in a stock. They are the ones making the footprints. They are the smart money that is setting the rules of the game anyone can play. It is called investing.
Whether you choose to use technical analysis or fundamental analysis in your trading decisions, it pays to know what the market is thinking. It pays to look for the footprints. Those footprints may well steer you away from a cliff and get you out of a stock just in time. The feet that make those footprints are the same ones that will kick you in the pants, waking you up to a promising investment opportunity.
This book gives you the tools to spot the footprints, where they predict the stock is heading, how far it will travel, and how reliable the trail you are fol lowing really is. The tools will not make you rich; tools rarely do. But they are instruments to greater wealth. Use them wisely.
The Database
If you want to discover how much you do not know about a chart formation, try teaching a computer to recognize one. I spent several months doing that preparing for this book. The program helped me locate, analyze, and log well over 15,000 formations. It is not a substitute for my eyes or my brain, just another tool to augment my talent. Consider it another set of dispassionate eyes, a friend nudging you and saying, "Look at this one here. It's a
reversal."
Introduction
(they were not unduly flat over the period) and did not have consistently large daily price ranges (too thinly traded or volatile).
I usually removed stocks that went below a $1.00, bankruptcy was right around the corner. Most of the names in the database are popular American companies that trade on the or NASDAQ. The numerous illustrations accompanying each chapter give a representative sam ple of the stocks involved.
Occasionally a chart formation came along that presented a problem. It was so scarce that 2,500 years (500 stocks times 5 years) of daily price data were simply not enough. So I pulled from the database I use on a daily basis. It con tains about 300 issues and begins where the other one ends.
Stock Performance from
to 1996
Before reading about the various chart patterns in this book, it is wise to review the performance of the stock market during the period. Figure shows a monthly price chart of the Standard & Poor's 500 stock index. Beginning in you can see that the market hesitated until January 1992. It had a wild burst upward, perhaps due to the January effect, but trended downward until May. (In case the January effect is unfamiliar to you, it is commonly attributed to investors selling their stocks for tax reasons near year end then buying back during January. The selling may or may not depress prices, whereas the January buying gives them a temporary Toward the end of it looks as if the January effect occurred early, in December, when prices broke through their malaise of consolidation and reached new highs. Then it was off to the races, and prices rose on a steady tear until March 1994. The market stumbled and moved up for 5 months then declined for 4 months. Beginning in 1995, the race resumed, but the pace accelerated. The slope of the trend tilted upward noticeably until running into some turbulence in early 1996.
What does all this mean? Viewed as a whole, the market during the 5 years used in my analyses plus the 2 or 3 additional years used sporadically but not shown in Figure marks a very bullish environment. While the market as a whole was going up gangbusters, many individual stocks were not so for tunate. Some had steady downward trends. Others moved up smartly, rolled over, and died (check out most semiconductor and semiconductor capital equipment stocks in 1995).
During a soaring bull market, bullish chart patterns are more successful by having fewer failures and longer uphill runs. They perform better, chum ming along on a rising tide that lifts all boats.
Common sense suggests that bearish formations might fail more readily with stunted declines. More likely, though, is that bearish patterns just disap
Averages and the Frequency Distribution
s & P soo
Figure Standard & 500 stock index from to
pear; they never happen. You might think that stocks moving up would form bearish reversals. Instead, just keep moving up, now and again pausing to catch their breath before continuing the rise.
You can see this trend in the statistics. Bullish formations, those that typ ically occur after a downward price trend and signal an upward reversal, hap pen more often than bearish ones. Symmetrical triangles are a good example. Triangles with upside, bullish breakouts occurred times, whereas downside breakouts happened times. A favoring of the bullish trend is also evident in many paired formations. Consider double bottoms and double tops. There were 542 bottoms (bullish) and only 454 tops (bearish).
Even the statistics favor a bull market. A stock moving up can advance 50%, 100%, or even 1,000%. The gains can be unlimited, but what of the declines? A stock can only lose 100%, or all of its value, and nothing more.
Averages and the Frequency Distribution
This example shows the effect large numbers have on the average. If the 120% gain is not in the series, the average drops to 180/4 or 45%. The single large gain pulls the overall average upward, distorting the result. This distor tion is important when discussing bullish formations. A 600% gain in one chart formation can make a chart pattern appear more successful than it really is. Instead of dropping off samples (by arbitrarily removing the large returns), I use a frequency distribution.
The esoteric name frequency distribution is appropriate. To create a fre quency distribution, find the highest and lowest values to give you the range. Divide the range by 10 because you want to sort the numbers into bins is arbitrary, but commonly chosen). Then, you do just the numbers into one of 10 ranges and place them in the bins. When finished, count how often the numbers appear in each bin (the frequency). Note that you do not add up the numbers, you just count how often they appear. It is a lot like see ing troops on a battlefield. You really do not care how tall each one is, only that they outnumber you. The results are the same: You wet your pants and run!
An example makes this clear. Look at Table Suppose I am studying a chart formation and have the gains for 50 patterns. For simplicity, suppose the gains range from 5% to 95%. The first column in the table holds gains less than 10% and the last column holds gains over I do not show them all in the table, but I begin placing gains into the different bins, and the first gains are 8%, 35%, 70%, 13%, 95%, 9%, 6%, 33%, 3%, and 63% (see Table
When I finish placing the gains from the 50 formations into the table and sum the columns, I see which column has the highest frequency. A count of each column appears as the last row in the table and assumes all 50 formations were sorted.
From the numbers in the bottom row, we see that the first column has the highest frequency and represents those formations with gains of less than We might conclude that if you invested in a similar chart formation, your gain is likely to be between zero and 10%, since that is where most (40%) of for mations reside. The average of the 50 gains will likely be higher than 10%, especially if the higher ranges show either a large number of entries or repre sent large gains.
I call the column with the highest frequency "the most likely gain." Sometimes the sum of the columns are near to one another and so the most likely gain is a range of values, such as to 20%. Just because a chart pat tern has a most likely gain of does not mean that you will have a gain from trading your chart pattern. After if you trade the pattern well enough and often enough, you should approach the results represented by the average. However, I feel that the most likely gain gives the investor a better under standing of the performance or reliability of the chart pattern.
I use a frequency distribution any time I want to see which range occurs most often (or any time I think outliers distort the average). It is just another perspective, a useful tool in the hands of an investor.
8 Introduction
Investing Using Chart Formations
I could give a dentist's drill to any person walking by, but I would not let him or her near my teeth. This book is just like that. It gives you the tools to invest suc cessfully. It suggests which chart patterns work best and which ones to avoid. Whether you can make money using them is entirely up to you.
I call this book an encyclopedia because that is how I use it. Whenever I see a chart pattern forming in a stock I own, or am thinking of buying, I read the applicable chapter. The information refreshes my memory about identifi cation quirks, performance, and any tips on how I can get in sooner or more profitably. Then I search for similar patterns in the same stock (using different time scales), and if that does not work, I search for similar patterns in stocks in the same industry. I look at them closely to determine if their secrets are applicable to the current situation. I try to learn from their mistakes.
At the same time, I am paper trading chart formations in the 250 or so stocks I follow on a daily basis (relax, a review only takes me an hour). Even though I consider myself an experienced investor (after nearly 20 years, what do you the constant paper trading keeps me sharp. It has moved pulling the trigger (buying or selling a stock) from a conscious effort to a rote reflex. The constant checking on how the chart pattern is faring forces me to develop an intuitive feel for the formation, the stock, and the market.
Developing an Investment Style
The question I am asked most often is, how do I develop an investment style? It is usually not asked like that. Most take a more direct approach: How do I make money trading stocks? When first asked this question, I stumbled over the answer. I think it is like showing four people the color blue and asking them to describe it. One person is color blind so you automatically throw out whatever he says. One says it is solid blue. Another says it is not blue at all but green, while the third says it looks like a combination: bluegreen. To each individ ual, blue looks like do not try to compare answers.
Developing a trading style is a lot like that. It is an individual endeavor that has a lot in common with experience. I cannot give you experience; I can only suggest ways to acquire your own.
If you read a chapter on a chart pattern and buy the first stock showing the pattern, you will probably be successful. The first trade nearly always works for the novice, maybe even the second or third one, too. Eventually, though, someone is going to pull the rug out from under you (who knows, maybe it occurs on the first trade). You will make an investment in a chart pattern and the trade will go bad. Maybe you will stumble across a herd of bad trades and get flattened. You might question your sanity, you might question God, but one thing is for certain: It is not working!
Developing an Investment Style 9
Most people buy stocks like they buy fruit. They look at it, perhaps sniff it, and plunk down their money. We are not talking about $1.59 here. We are talking about thousands of dollars for part ownership in a company.
If you have ever been a board member, you know what I am talking about. You have a fiduciary responsibility to the people who elected or appointed you to that position. Not only should you study the material handed to you by the staff, but you have to get out in the field and kick the tires. Do not assume that what the staff says is always correct or represents the best solution. Question everything but learn in the process and try to be helpful without being a pest (I always seem to fall into the pest category). As a owner of the
it be any different?
I recently was considering buying a position in a company showing an upside breakout from a symmetrical triangle. My computer program told me the company is a member of the machinery industry and further research revealed that it makes refractory products. I continued doing research on the company until the message gnawing at me finally sank in. I did not have the foggiest idea of what a refractory product was. Despite my search for an answer, I was not getting the sort of warm I usually get when researching a pos sible investment. So, I passed it over. I am trading it on paper, sure, but not in real life. Call it the Peter Lynch Syndrome: Do not invest in anything you can not understand or explain in a paragraph. Good advice.
Of course, if you blindly invest in chart squiggles and it works for you, who am I to tell you you are doing it wrong? The fact is, you are not. If you consistently make money at it, then you have developed an investment style that fits your personality. Good for you!
My investment style, as you might have guessed, combines fundamental analysis, technical analysis, emotional analysis, and money management. Just because I rely on technical analysis does not mean I do not look at the pricetoearnings, and other more esoteric ratios. Then there is the emotional element. After going for months without making a single trade, suddenly a profitable opportunity appears and I will take advantage of it. Three days later, I will want to trade again. Why? Am I trading just because it feels good to be finally back in the thick of things? Am I trad ing just because the single woman living nearby does not know I exist and I am acting out my frustrations or trying to impress her with the size of my wallet? That is where paper trading comes in handy. I can experiment on new techniques without getting burned. If I do the simulation accurately enough, my subconscious will not know the difference and I will learn a lot in the process.
10 Introduction
Investing using chart formations is an exercise in probability. If you play the numbers long enough, you will win out. Sure, some of your investments will fail, and you must learn to cut your losses before they get out of hand. But the winners should serve you well, providing you let them ride. Just do not make the mistake of watching a stock double or triple only to reverse course and drop back to where it started. Or worse.
Day Traders, Position Traders,
Investors
As I was writing this book, I kept asking what is the time horizon for chart patterns? Are they best for day traders, position traders, or
investors? The answer I kept coming up with is: Yes! Chart formations can be profitable for day people who are in and out of a trade during a single day. Many day traders have trading styles that depend on chart forma support, and resistance. They concentrate on reliable formations that quickly fulfill their measure rule predictions.
For position traders, those who hold the trade longer than a day but not forever, chart patterns offer convenient entry and exit points. I put myself in this category. If the trade goes bad, I am out quickly. If it is profitable, I see no need to cut my profits short. When the gains plateau, or if the stock has moved about all it is going to, I consider moving on. Like the day trader, I try to max imize turns by buying formations that promise reliable returns and reach the ultimate high quickly.
For the longterm investor, chart patterns also signal good entry and exit points. I recently purchased an oil services company knowing that the invest ment would not make a significant return for 2 or 3 years (I was wrong: It dou bled in 3 weeks). It is my belief that in 3 years' time, the stock will be in the 3 Os, a sixfold increase from its low. It probably will not qualify for a tenbagger, but it is not small change either. In the short term, the road is going to be rocky and I have added to my position as the stock has come down. Since I am in it for the long term, I have an outstanding order to buy more shares. If this stock goes nowhere, then my analysis of the market trends was wrong, and I will have learned a valuable lesson.
The Sample Trade
The Sample Trade sections that are included in many of the chapters in this book are fictitious except for one: the trade I made using a symmetrical trian gle bottom. Each sample trade uses techniques I wanted to illustrate, incorpo rating fictitious people in sometimes unusual circumstances. Call it poetic license, but I hope they give you some ideas on how to increase your profits or to minimize your losses.
If You Like This Book
If You Like This Book
When I plunk down my hardearned money for a book, I expect to get a good value. Many times I have complained that I did not learn anything from a book. At other times, the information is exciting and new, but I cannot use it because the tools the author presented are either too esoteric or too expensive. I vowed to give the reader real value in this book. The information is easy to find, from the alphabetical chapter layout, to the statistical snapshot at the start of each chapter, to the advice and suggestions all laid out in easy reference tables. The chapters are replete with pertinent illustrations. However, I fear that if you try to read this book from cover to cover, it surely will put even the most hardened insomniac to sleep. Use this book as a reference tool. Refer to it before you make a trade.
1
Broadening Bottoms
R E S U L T S S N A P S H O T
Upside Breakouts
Appearance
Reversal or consolidation
Failure rate
Average rise
Volume trend
Percentage meeting
predicted price
target
Surprising finding
See also
Price trend is downward, leading to the formation. Megaphone appearance with higher highs and lower lows that widen over time. Breakout is upward.
Shortterm (less than 3 months) bullish reversal
with most likely gain less than
Ragged, but usually follows price: rises as prices rise, falls when prices fall.
Partial rise at the end of the formation predicts a downside breakout 67% of the time and partial declines predict an upside breakout 80% of the time.
Broadening Formations, and Ascending; Broadening Formations, RightAngled and Descending; Broadening Tops; Broadening Wedges, Ascending; Broadening Wedges, Descending
Results Snapshot 13
Downside Breakouts
Appearance
Reversal or consolidation
Failure rate
Average decline
Volume trend
Percentage meeting predicted price
target
See also
Price trend is downward, leading to the formation. Megaphone appearance with higher highs and lowered lows that widen over time. Breakout is downward.
Shortterm (less than 3 months) bearish consolidation
6%
27%, with most likely decline between 15% and 20%
Ragged, but usually follows price: rises as prices rise, falls when prices fall.
70%
Broadening Formations, RightAngled and Ascending; Broadening Formations, RightAngled and Descending; Broadening Tops; Broadening Wedges, Ascending; Broadening Wedges, Descending
When I compiled the statistics for broadening bottoms, I had to double check the results because they were unusual. Broadening bottoms with downside breakouts outperform those with upside breakouts. Bullish formations typically have gains averaging about broadening bottoms have gains of just Bearish formations decline about 20%, on average, but bearish broadening bottoms show losses of This information tells me that even though you can have an upside breakout, the chart pattern is essentially a bearish one. Prices do not rise all that far before retreating, and when they do break out downward, the decline is above average in severity.
The most likely using a frequency distribution of the about what you would expect: 10% for upside breakouts and a rel atively high to 20% for broadening bottoms with downside breakouts.
The failure rates are also remarkably small: just and 6% for upside and downside breakouts, respectively. Anything that is under 20% I consider acceptable.
14 Broadening Bottoms
Tour
You may be wondering what differentiates a broadening bottom from a broad ening top. A broadening bottom has a price trend leading down to the start of the formation; a broadening top has prices trending up. This differentiation is an arbitrary designation I made to separate the two formation types. I could have used their location in the 12month price range (those located in the upper half are tops, the rest are bottoms). However, this methodology poses a problem when the formation is near the center of the yearly price range: Is it a top or a bottom?
Using a price trend leading to a formation is no surefire solution either. If the price trend is nearly horizontal or changes abruptly just before the for mation starts, then I pretend I am a moving average. Would a 90day moving average be trending up or down? Once you know the trend, you can then fig ure out whether you are dealing with a broadening top or bottom.
Some maintain that a broadening bottom does not exist. They simply lump every broadening pattern into the broadening top category. I decided to separate the two on the off chance that their performance or behavior differs. You may want to combine the statistics or do your own research.
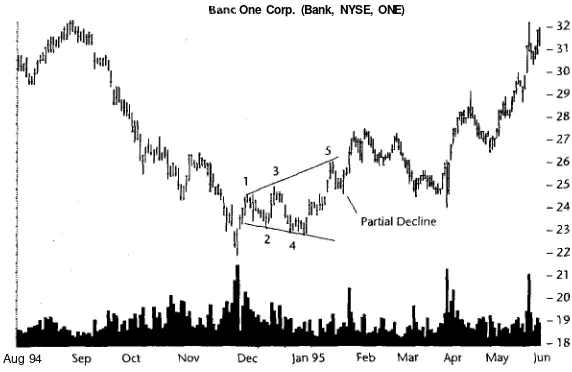
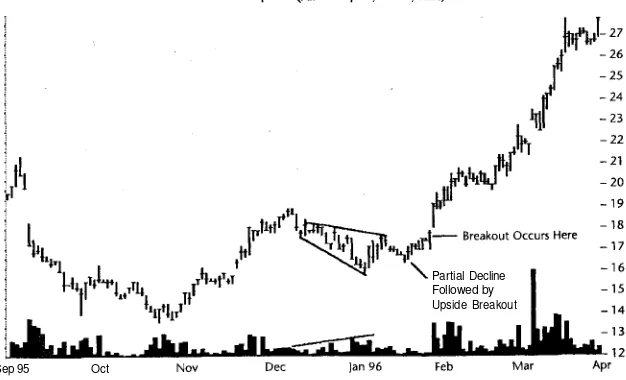
Figure 1.1 is an example of a broadening bottom. This particular one is called a fivepoint reversal because there are five alternating touches, two minor lows and three minor highs. A fivepoint reversal is also rare: I located
One Corp. (Bank, NYSE, ONE)
Aug 94
Figure 1.1 A broadening bottom specifically a fivepoint reversal, so called because of the two minor lows (the even numbers) and three minor highs (the odd numbers).
Identification Guidelines 15
only 5 in the 77 broadening bottoms I examined. The price trend begins mov ing down in late August and reaches a low 2 days before the formation begins. Yes, prices do move up for several days, leading to the first touch of the top
but I still consider the overall price trend to be moving down to the formation.
This particular chart pattern shows the partial decline I mentioned ear lier. Prices move down from 26 to then reverse course and shoot out the top. The stock reached a high of just over a year later.
Identification Guidelines
Table 1.1 lists the identification guidelines for broadening bottoms. As men tioned earlier, a declining price trend precedes a broadening bottom. Even if prices rise just before the formation begins, ignore it. It is still a bottom. This arbitrary designation also makes intuitive sense: A bottom should appear at the end of a downtrend, not when prices are climbing to the moon.
The shape of the formation is distinct. It reminds me of chaos theory where small disturbances oscillate back and forth, then sometimes grow unbounded, wreaking havoc. In the stock market, prices reach new highs then cross over and make new lows. When you draw a trendline across the minor highs and another connecting the minor lows, the formation looks like a megaphone.
The two trendlines drawn across the minor highs and lows are important. The top trendline should slope up; the bottom one should slope down. The diverging trendlines distinguish the broadening bottom from other types of
Table 1.1
Identification Characteristics of Broadening Bottoms
Characteristic Discussion
Price trend The intermediateterm price trend should be downward leading to the formation.
Shape Megaphone shape with higher highs and lower lows. Trendlines Prices follow two trendlines: The top one slopes up and the
bottom one slopes down.
Touches Should have at least two minor highs and two minor lows, but not necessarily alternating touches.
Volume Irregular but usually rises as prices rise and recedes as prices fall. Breakout The breakout can occur in either direction and, in some cases,
16 Broadening Bottoms
formations, such as the rightangled broadening formation (which has one horizontal or the broadening wedge (both trendlines slope in the same direction). So it is important that both trendlines have a slope that is opposite each other (that is, the top slopes up and the bottom slopes down).
A broadening bottom needs at least two minor highs and two minor lows to be a valid formation. Anything fewer means you are incorrectly identifying the formation. What is a minor high or low? A minor high is when prices trend up, then drop back down, leaving a clearly defined peak. A minor low is just the same thing flipped upside down: Prices move lower, then head back up leaving a clearly defined valley. Figure 1.1 shows five minor highs or lows, labeled by numbers. The odd numbers tag the minor highs and the even numbers are the minor lows. Let me stress that the minor highs and lows need not be alternat
as in Figure Just as long as you can count at least two peaks and two they may is fine.
There is nothing magical in the volume trend. I performed linear regres sion from start of each formation to the end point (not the breakout point that is usually a month beyond the end of the formation) and found that vol ume rises about 58% or 59% (upside and downside breakouts, respectively) of the time. That is just a little better than a coin certainly not strong enough to make a definitive statement.
If you look closely at most broadening bottoms, you will find that volume usually follows price. In Figure the price decline between peak 1 and trough 2 shows a receding volume trend. When prices head up from point 2 to point 3, so does volume. One thing is certain: Volume is irregular and the ris ingfalling trend is only a general guideline often broken. When selecting a broadening bottom, I ignore the volume pattern.
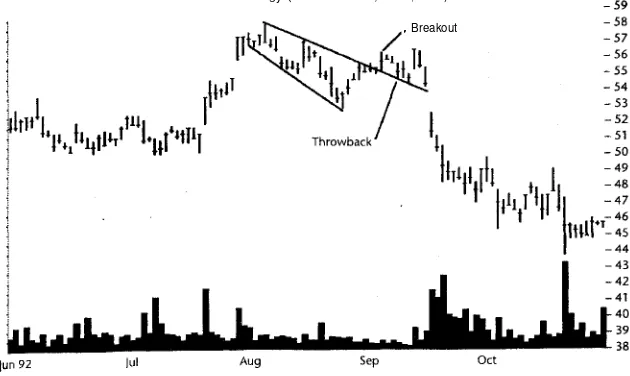
The breakout point is difficult to identify in a broadening formation as it is developing. In retrospect, it is easier. I look for the place where prices pierce the up or down or make an extended move. If prices pierce the trend line, then the penetration point becomes the breakout point. If prices move up and follow along the top trendline without piercing it, then I backtrack to the prior minor high and draw a horizontal line forward in time until prices cross it. When that happens, that is the breakout point.
Let me give you an example. Consider the broadening bottom shown in Figure The price trend over the preceding month leading to the formation is downward. The two trendlines outline a widening price pattern as you would expect from a broadening formation. There are more than two minor highs and two minor lows pictured, meeting another criterion mentioned in Table
Where is the breakout? This formation is particularly easy. If you extend the top trendline upward, you find that prices rise well above the line, signal ing an upside breakout. Then it is just a matter of backtracking to the highest minor high and drawing a horizontal line to determine the actual breakout price. Point A marks the highest high in formation.
Focus on Failures
Corp. (Computers ft Peripherals,
Figure 1.2 A breakout from the broadening bottom occurs when prices rise above the highest high in the shown as point A.
This formation is typical of broadening bottoms. The breakout is upward and occurs at a price of 18. Soon, stock moves up to a rise 23% or nearly 25% average rise for broadening bottoms with upside breakouts.
Focus on Failures
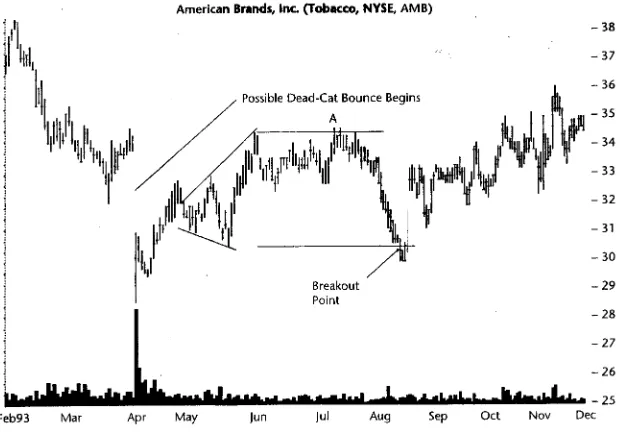
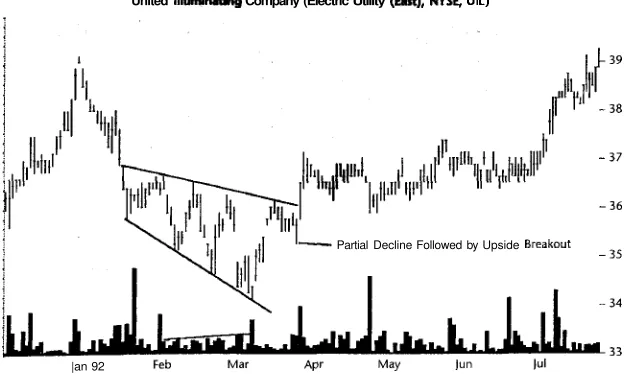
The good news is that with only three formation failures there is to worry about. The bad news is that with only three failures there is not much to learn. Figure 1.3 shows one of the three broadening bottom failures. Prices head down and appear to suffer a deadcat bounce lasting from April to August. I do not recommend taking a position in any stock that shows a deadcat bounce regardless of how attractive the formation looks. Obey this recommendation for 6 months to a year while the stock recovers and management gets its house in order (or solves the cause of whatever is ailing the stock).
In the 3 weeks before the formation appeared, prices were heading higher reaction to the deadcat bounce. In June moved horizontally from the formation top for over a month before easing down. It was during this time that prices rose above the high of the formation (see point A).
I do not consider prices to break out above or below a formation until the
Broadening Bottoms
Figure This broadening bottom forms as part of the recovery process from a deadcat bounce. When prices close below the formation a downside break out occurs. Point A shows where prices move above the high but do not close higher. The formation is a failure because prices do not move down by more than 5% below the breakout point before reversing.
formation high of Two days later, it peaks above the high, but the close is also below the formation high.
However, look what happens when prices begin sinking in midJuly. They drop below the formation and close even lower. The price needs to drop below At its lowest point, it closes at That is just fifty cents below the low, but it is enough to signal a downside breakout. Within a week of mov ing below the formation low, prices shoot to 3 3 and continue up using a slower trajectory.
Figure 1.3 represents what I call a 5% failure. Prices break out lower but fail to continue moving in the breakout direction by more than 5% before heading back up. The reverse is also true for upside failures: Prices move up by less than 5% before turning around and tumbling.
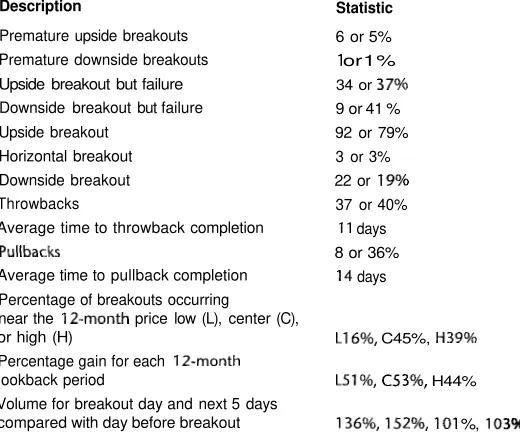
Statistics
Table shows general statistics, which I separated into two types: upside and downside breakouts. Since there is a dearth of broadening bottoms in my usual database of stocks over 5 years, I searched the database that I use on a daily
Statistics 19
Table 1.2
Statistics for Broadening Bottoms
Description Upside Breakout Downside Breakout
Number of formations: 35 in 500 stocks from to
42 in about 300 stocks to
Reversal or consolidation Failure rate
Average rise/decline of successful formations Most likely rise/decline Of those succeeding, number meeting or exceeding price target (measure rule) Average formation length Partial rise but ended down Partial decline but ended up Percentage of time there was a trend reversal within 3 months
45
45 reversals 1 or 2% 25%
26 or 59% 2 months (61 days)
67% or 80%
48%
32
32 consolidations 2/32 or 6% 27%
to 20%
21 or 70% 2 months days)
67% or 80%
52%
basis. About 3 years long, it covers approximately 300 stocks and picks up from where the other database ends, so there is no overlap in dates. It is noteworthy that I uncovered more formations (42 versus 35) in the most recent 3 years (900 years of daily price data) than in the prior 5 years (2,500 years of daily price data).
Broadening bottoms with upside breakouts act as reversals of the pre vailing trend, whereas those with downside breakouts act as consolidations. This observation makes sense when coupled with the provision that the trend leading to the formation must be downward. Under those circumstances, an upward breakout will be a reversal, whereas a downward breakout is a consolidation.
The failure rate is very low: 2% and 6% for the two breakout types. I think the reason for this occurrence is that at its widest point, a broadening for mation represents a strong trend as prices move from one side of the formation to the other. Once this momentum gets under way, it seems likely to continue, and not falter after a breakout occurs (leading to a 5% failure). As the saying goes, a trend in motion tends to remain in motion.
20 Broadening Bottoms
above the usual 20% norm for bearish formations. The numbers suggest broadening bottom is predominantly a bearish formation, resulting in short upside gains or extended downside losses.
The most likely rise or decline is about average: for upside breakouts and a stronger than normal 15% to 20% for downside breakouts. Figure 1.4 shows the results from a frequency distribution of gains and losses. I call the tallest columns the most likely gain or loss because they have the highest fre quency (the most formations in a given percentage range). It is the return an investor is likely to experience most often.
The figure looks quite irregular with returns forming two humps: one from to 25% and a second from on upward. A small sample size is probably the reason, with just 45 or 32 formations to divide between cate gories, so view the results with skepticism.
I explain the measure rule in the Trading Tactics section, but it involves computing the height of the formation and adding or subtracting it from the breakout price. The result gives the target price to which the stock will move. For upside breakouts, prices reach the target just 59% of the time, whereas downside breakouts score much better, at Still, the values are a bit shy of the 80% benchmark I consider a minimum for reliable formations.
The average formation length is remarkably close for both types of break outs: about 2 months. Since this is an average, the actual lengths can range all over the place. If you can state one thing about broadening formations, it is that they take time to form. The oscillating movements from one side of the formation to the other do not happen overnight.
Figure Frequency distribution of returns for broadening bottoms.
Statistics 21
An interesting anomaly I noticed when scanning broadening formations is partial rise or decline. Figure shows a good example of what I am talking about. Prices begin to move down across the formation to the opposite side, turn around, and break out. When a partial rise occurs, a downside break out follows 67% of the is two out of three. A partial decline does even better: 80% of the formations showing a partial decline break out upward. So, if you see a partial rise or decline in a broadening bottom, you might want to jump in and trade the stock with the expectation that a breakout will follow.
Some have said that when a broadening formation has an upside breakout (usually a bullish scenario), then the ultimate high is not far away. Soon, they maintain, the stock will reach its high and make an extended downward move. I tested this premise and found that it basically is not true. Only 48% of the formations have ultimate high (a trend reversal) appear 3 months of the breakout point. I think anything more than 3 months places a company into another fiscal quarter, and a different dynamic is probably responsible for any downturn.
Table 1.3 shows breakout statistics for broadening bottoms. There were 45 formations with upside breakouts and 32 with downside breakouts. Once a formation ends, the actual breakout occurs about a month later. As explained, I consider a breakout to occur when prices pierce one of the trendlines (and closes outside the or continue moving along a trendline for an inor dinate amount of time. Once a breakout occurs, it takes 4 months for those for mations with upside breakouts to reach their ultimate high and 3 months for chart patterns downside breakouts to reach their ultimate low.
Where in the yearly price range do breakouts occur? To find answer, I divided the yearly price range into thirds and sorted each formation into the appropriate range. Those formations with upside breakouts appear most often in the center or lower third of price range, suggesting that chart pattern itself resides rather low in the price range. This occurrence makes sense
Table 1.3
Breakout Statistics for Broadening Bottoms
Description Number of breakouts Formation end to breakout For successful formations, days to ultimate high/low Percentage of breakouts occurring near
low center (C), or high (H) Percentage gain/loss for each
lookback period
Upside Breakouts
or 58%
28 days
4 months days)
9%
Downside Breakouts
32 or 42% 36 days
3 months (95 days)
L78%, H7%
22 Broadening Bottoms
because a requirement of a broadening bottom is that prices trend downward to the start of the formation. Since the breakout point is at the top of the for mation, it sometimes pokes the breakout point into the center third of the yearly price range. For downside breakouts, the breakout point is usually in the lowest third of the yearly price range.
Mapping the performance of chart patterns over the same price range shows that those with upside breakouts split evenly: The lowest and highest thirds of the yearly price range score best with gains averaging 26%. For downside breakouts, those in the lowest third of the yearly price range have the highest average decline: This percentage tapers off with those formations in the highest third of the range showing the worst returns at
Table 1.4 shows the last group of the formations broken down by alternating touches. This is not the same as the requirement of hav ing two minor highs and two minor lows in each broadening bottom. Two minor highs, for example, can occur without prices declining fully to the oppo site side. I counted the number of alternating touches for each formation to see if there is a pattern to the number of touches and the breakout point. As you can see in Table formations with four alternating touches break out most often, 13 each. However, formations with upside breakouts commonly range from three to five alternating touches per chart pattern.
What does this mean? If you find a broadening bottom in a stock you own or are considering purchasing, you might try counting the number of alternat ing touches. If the stock has four touches, then it is more likely to break out on the next crossing of the formation. The table suggests that the likelihood of an upside break out after four alternating touches is and a downside break out is 57% (the side of the first touch gives the breakout direction: If the first touch is on the top, then an upside breakout is likely after four touches).
Table 1.4
Frequency Distribution of Successful Formations by Number of Alternating Touches with Cumulative Percentage of Total
Number of Alternating Touches
3
Number with Upside Breakouts
10: 23% 52% 10: 75% 6: 89% 3: 95% 1: 99%
Number with Downside Breakouts
4: 13% 57% 8: 83% 2: 90% 3: 0: 0:
Trading Tactics 23
To count the number of touches, refer to Figure where I labeled the touches. I do not consider the initial entry point to be a touch. In the figure, the entry point is on the bottom of the formation at about Prices move to the top and reverse course. That is the first touch. Then prices descend to the opposite side, making another touch. You can see on the fourth touch that prices touch the bottom twice. Between the two touches is a minor high, but since prices did not touch or near the top trendline, no additional touch scores.
Trading Tactics
Table 1.5 shows trading tactics for broadening bottoms. The first tactic is to determine how much money you are likely to make in a trade. The measure rule helps with the prediction. Subtract the highest high from the lowest low in the formation to give you the formation height. Then add the value to the highest high to get the target price for upside breakouts and subtract the height from lowest low for downside breakouts.
Figure 1.5 makes computation clear. Point A shows highest high in the chart pattern at The lowest low is point B at 12. The formation
Table
Trading Tactics for Broadening Bottoms
Trading Tactic Explanation
Measure rule
Co long at the low Long stop
Go short at the high Short stop
Move stops
Other
Compute the difference between the highest high and the lowest low in the formation. Add or subtract this value from the most recent minor high or low, respectively. The result is the target price for upside and downside breakouts.
Once recognizing a broadening formation, buy after the stock makes its turn at the low.
Place a stoploss order below the minor low to protect against a trend reversal.
Sell short after prices start heading down at the top. Place a stop above the minor high to protect against an adverse breakout. Cover the short when it turns at the trendline and starts moving up. For a downside breakout, cover as it nears the target price or any support level. Raise or lower the stop to the next minor low or high once prices pass the prior minor high (for long trades) or low (for short sales).