Measuring Internal
Auditing’s Value
THE IIA’S GLOBAL INTERNAL AUDIT SURVEY
The IIA’s Global Internal Audit Survey:
A Component of the CBOK Study
Measuring Internal
Auditing’s Value
Report III
Disclosure
Copyright © 2011 by The Institute of Internal Auditors Research Foundation (IIARF), 247 Maitland Avenue, Altamonte Springs, Florida 32701-4201. All rights reserved. No part of this publication may be reproduced, stored in a retrieval system, or transmitted in any form by any means — electronic, mechanical, photocopying, recording, or otherwise — without prior written permission of the publisher. The IIARF publishes this document for informational and educational purposes. This document is intended to provide information, but is not a substitute for legal or accounting advice. The IIARF does not provide such advice and makes no warranty as to any legal or accounting results through its publication of this document. When legal or accounting issues arise, professional assistance should be sought and retained.
The Institute of Internal Auditors’ (IIA’s) International Professional Practices Framework (IPPF) comprises the full range of existing and developing practice guidance for the profession. The IPPF provides guidance to internal auditors globally and paves the way to world-class internal auditing. The mission of The IIARF is to expand knowledge and understanding of internal auditing by providing relevant research and educational products to advance the profession globally.
The IIA and The IIARF work in partnership with researchers from around the globe who conduct valuable studies on critical issues affecting today’s business world. Much of the content presented in their final reports is a result of IIARF-funded research and prepared as a service to The Foundation and the internal audit profession. Expressed opinions, interpretations, or points of view represent a consensus of the researchers and do not necessarily reflect or represent the official position or policies of The IIA or The IIARF.
ISBN 978-0-89413-698-6 2/11
Dedication
Table of Contents
Acknowledgments
... viiAbout the Authors
... ixForeword
... xiExecutive Summary
... xvChapter 1
Introduction ...1Chapter 2
Perceived Contributions of Internal Auditing and Organizational Characteristics ...3Chapter 3
The Relationship Between Characteristics of the Internal Audit Activity and Agreement with Value Statements ...29Chapter 4
Performance Measurement of the Internal Audit Activity ...39Chapter 5
Performance Measurement Methods and Perceived Contributions ...45Chapter 6
Audit Activities Performed and Perceived Contributions ...47Chapter 7
Conclusion ...49The IIA’s Global Internal Audit Survey — Questions
...51The IIA’s Global Internal Audit Survey — Glossary
...57The IIA Research Foundation Sponsor Recognition
...61The IIA Research Foundation Board of Trustees
...63Acknowledgments
The 21st century presents unprecedented growth opportunities for the internal audit profession. Advances in technology, the conluence of the Information and the Internet Age, and the sheer speed and expansion of communications capabilities have signiicantly accelerated the pace of globalization. Governance, risk, controls, and compliance processes within organizations have undergone signiicant change to manage the increasing complexity and sophistication of global business operations. All of these developments offer a huge opportunity for internal audit functions, whether in-sourced, co-sourced, or outsourced, including the potential to add even greater value to their respective organizations.
To ensure that a body of knowledge is systematically built up, developments in practice in a dynamically changing environment must be carefully monitored and continually analyzed to reveal critically
important insights. Key lessons learned from the experience of the profession must constitute part of the historical record and be transmitted to current and future generations of internal audit professionals for optimal outcomes. Not only must we strive to secure a robust portrayal of the current state of the profession, but encourage practice-relevant research to inform and push the boundaries of practice. We are fortunate that under the auspices of the William G. Bishop III, CIA, Memorial Fund,
administered by The IIA Research Foundation, it is possible to undertake large-scale studies of the global internal audit profession. We sincerely appreciate Mary Bishop’s passion and commitment to further the internal audit profession while honoring Bill Bishop’s legacy. The inaugural Common Body of Knowledge (CBOK) survey under William Taylor’s leadership occurred in 2006; this is the second iteration. Based on the responses from The IIA’s Global Internal Audit Survey from 2006 and now in 2010, it is possible to compare results and perform high-level trending.
Five reports cover the full spectrum of a wide range of the survey questions (carefully designed to allow for comparison between the 2006 and 2010 survey data). These reports cover topical content from characteristics of an internal audit activity to implications for charting the future trajectory of the profession. The cooperation and sharing among the ive report-writing teams representing the Americas, Asia, Europe, and the Middle East have made this project a truly global and collaborative effort.
We hope that this collection of reports describing the expected inluence of major themes about, and developments in, the profession as extracted from the survey will provide a comprehensive snapshot of the profession globally, offer helpful insights and actionable intelligence, and point the way forward to maintaining the profession’s continued relevance and value-added contributions.
In addition, we must acknowledge William Taylor and Leen Paape, both advisors to the CBOK 2010 study co-chairs, and the following international members of the CBOK 2010 Steering Committee, as well as the Survey Design Subcommittee and the Deliverables Oversight Subcommittee, for their guidance and signiicant contributions to the survey design, administration, data collection, interpretation, and topic-speciic reports: Abdullah Al-Rowais, AbdulQader Ali, Audley Bell, Sezer Bozkus, John Brackett, Ellen Brataas, Edouard Bucaille, Adil Buhariwalla, Jean Coroller, David Curry, Todd Davies, Joyce Drummond-Hill, Claudelle von Eck , Bob Foster, Michael Head, Eric Hespenheide, Greg Hill, Steve Jameson, Béatrice Ki-Zerbo, Eric Lavoie, Luc Lavoie, Marjorie Maguire-Krupp, John McLaughlin, Fernando Mills, Michael Parkinson, Jeff Perkins, Carolyn Saint, Sakiko Sakai, Patricia Scipio, Paul Sobel, Muriel Uzan, R. Venkataraman, Dominique Vincenti, and Linda Yanta.
Several members of these committees must be particularly thanked for their extended participation in what became a prolonged, three-year commitment for this large-scale undertaking. Each of these individuals contributed their leadership, wealth of knowledge and experience, time, and effort to the CBOK study and deserves our deepest gratitude.
Professor Mohammad Abdolmohammadi of Bentley University was key to the 2010 data analysis and preparation of summary tables of the survey responses, as he was for the CBOK study in 2006. Professor Sandra Shelton of DePaul University must be recognized for giving the reports a smooth low and an overall consistency in style and substance.
The survey could not have succeeded without the unstinted and staunch support of the survey project champions at The IIA institutes worldwide. At The IIA’s global headquarters in Altamonte Springs, Florida, United States, many staff members, especially Bonnie Ulmer and Selma Kuurstra, worked tirelessly and provided indispensable support and knowledge. Bonnie Ulmer, IIARF vice president, David Polansky, IIARF executive director, and Richard Chambers, IIA president and CEO (who
simultaneously served as executive director for most of the project), provided the necessary direction for the successful completion of the project.
Last but not least, The IIA’s 2010 CBOK study component — The Global Internal Audit Survey — and the resulting ive reports owe their contents to thousands of IIA members and nonmembers all over the world who took the time to participate in the survey. In a sense, these reports are a itting tribute to the contributions made by internal audit professionals around the globe.
CBOK 2010 Steering Committee Co-chairs Dr. Sridhar Ramamoorti, CIA, CFSA, CGAP Associate Professor of Accountancy
Michael J. Coles College of Business Kennesaw State University
Susan Ulrey, CIA, FCA, CFE
Managing Director, Risk Advisory Services KPMG LLP
About the Authors
Jiin-Feng Chen, PhD, CIA, CCSA, CPA, is associate professor of accounting at National Chengchi University (Taiwan, Republic of China) where he teaches intermediate accounting and accounting information systems. He is an active participant at The Institute of Internal Auditors (Taiwan) and serves on its executive board. He is one of the main translators of The IIA’s International Professional Practices Framework (IPPF) and COSO Guidance on Internal Control for Financial Reporting for IIA-Taiwan. Chen has published articles for the internal audit profession in Internal Auditor (Taiwan) and Computer Auditing (Taiwan) on topics related to internal audit quality assurance, electronic commerce, and Internet business reporting. His research focuses on the best practices of internal auditing and corporate governance. He also recently authored and taught continuing education programs in the areas of internal auditing, internal inancial reporting standards, corporate governance, and internal control.
Foreword
The IIA’s Global Internal Audit Survey: A Component of the CBOK Study
The 2010 IIA Global Internal Audit Survey is the most comprehensive study ever to capture the current perspectives and opinions from a large cross-section of practicing internal auditors, internal audit service providers, and academics about the nature and scope of assurance and consulting activities on the profession’s status worldwide. This initiative is part of an ongoing global research program funded by The Institute of Internal Auditors Research Foundation (IIARF) through the William G. Bishop III, CIA, Memorial Fund to broaden the understanding of how internal auditing is practiced throughout the world.
A comprehensive database was developed, including more than 13,500 useable responses from
respondents in more than 107 countries. The ive reports derived from analysis of the survey responses provide useful information to internal audit practitioners, chief audit executives (CAEs), academics, and others to enhance the decision-making process involving stafing, training, career development, compliance with The IIA‘s International Standards for the Professional Practice of Internal Auditing (Standards), competencies, and the emerging roles of the internal audit activity.
Characteristics of an Internal Audit Activity (Report I) examines the characteristics of the internal audit activity, including demographics, stafing levels, and reporting relationships.
Core Competencies for Today’s Internal Auditor (Report II) identiies and discusses the most important competencies for internal auditors. It also addresses the adequacy, use, and compliance with The IIA’s Standards.
Measuring Internal Auditing’s Value (Report III) focuses on measuring the value of internal auditing to the organization.
What’s Next for Internal Auditing? (Report IV) provides forward-looking insight identifying perceived changes in the roles of the internal audit activity over the next ive years.
Imperatives for Change: The IIA’s Global Internal Audit Survey in Action (Report V)contains conclusions, observations, and recommendations for the internal audit activity to anticipate and match organizations’ fast-changing needs to strategically position the profession for the long term. The 2010 survey builds upon the baseline established in prior Common Body of Knowledge (CBOK) studies (i.e., 2006), allowing for comparison, analysis, and trends as well as a baseline for comparison when The IIA’s Global Internal Audit Survey is repeated in the future.
PRIOR IIA CBOK Studies
CBOK’s Number of Respondents and Countries Over the Years
CBOK
Number
Year
Number of
Countries
Number of Usable
Responses
I 1972 1 75
II 1985 2 340
III 1991 2 1,163
IV 1999 21 136
V 2006 91 9,366
VI 2010 107 13,582
The 2010 IIA Global Internal Audit Survey — Beneits to the Profession
Maximizing the internal audit function is imperative to meet the challenges of today’s business environment. Globalization and the rapid pace of change have in many ways altered the critical skill framework necessary for success at various levels of the internal audit function. Internal auditing’s value will be measured by its ability to drive positive change and improvement. It is imperative for internal auditing to examine current trends within the profession and thus be able to make recommendations for changes within the internal audit activity. This should help internal auditing to:
Deliver the greatest value to its organization. Anticipate and meet organizations’ needs.
Strategically position the profession for the long term.
Research Teams
The following researchers, selected from the responses to the Request for Proposal, were involved in writing the reports and worked closely with Mohammad J. Abdolmohammadi (Bentley University, United States) who provided general data analysis from the 2006 and 2010 survey databases as well as additional analysis based on researchers’ request.
Report I
Yass Alkafaji, Munir A. Majdalawieh, Ashraf Khallaf (American University of Sharjah, United Arab Emirates) and Shakir Hussain (University of Birmingham, United Kingdom).
Report II
James A. Bailey (Utah Valley University, United States). Report III
Report IV
Georges M. Selim and Robert Melville (Cass Business School, United Kingdom), Gerrit Sarens
(Université Catholique de Louvain, Belgium), and Marco Allegrini and Giuseppe D’Onza (University of Pisa, Italy).
Report V
Richard J. Anderson (De Paul University, United States) and J. Christopher Svare (Partners in Communication, United States).
Executive Summary
Report III focuses on measuring the value of internal auditing under dynamic business conditions and the key factors contributing to the value delivered by an internal audit activity. The value can be viewed from the perspectives of internal auditors/internal audit service providers, customers (such as the board, audit committee, senior management) and other stakeholders. This report covers the perceived value of internal audit activities by internal auditors/internal audit service providers. To understand the linkage between the performance of an internal audit activity and its perceived contribution (value), this report addresses 1) the relationship between organizational characteristics and the perceived contribution of an internal audit activity; 2) the effect of an internal audit activity’s characteristics on its perceived contribution; 3) the effect of internal audit activity performance measurement methods on its perceived contribution; and 4) the relationship between the services performed by an internal audit activity and its perceived contribution.
An analysis of the survey responses revealed the following key indings:
Most respondents believe that their internal audit activities add value to their organizations. Both independence and objectivity are viewed as key factors for internal audit activities to add value.
While most respondents view their internal audit activity as contributing to controls, they do not to the same extent perceive it as contributing to risk management or governance.
The results from regional comparisons indicate that there are signiicant differences across the seven regions in terms of the perceived contribution of internal audit activities to organizations. The most important factors to the perceived contribution of the internal audit activity are 1)
having appropriate access to the audit committee; 2) functioning without coercion to change a rating assessment or withdraw a inding; and 3) more audit tools or technology used on a typical audit engagement.
Compared to 2006, there appears to be a declining trend in sourcing the internal audit activity from outside the organization. The percentage of co-sourcing or outsourcing of the activity has an impact on its perceived effectiveness, measured in terms of process effectiveness, effective functioning, and suficient organization status, rather than on the perception of the value added.
The internal audit activity performance methods most frequently used include 1)
The balanced scorecard and assurance of sound risk management/internal control methods are expected to gain importance as internal audit activity performance methods in the coming years.
This report provides insight to direct internal audit activities in delivering value to the organization to meet stakeholder expectations.
Chapter 1
Introduction
The IIA deines internal auditing as “an independent, objective assurance and consulting activity designed to add value and improve an organization’s operations.” In the Glossary of The IIA’s International Standards for the Professional Practice of Internal Auditing (Standards), “add value” is
deined as, “Value is provided by improving opportunities to achieve organizational objectives, identifying operational improvement, and/or reducing risk exposure through both assurance and consulting
services.”1 This report focuses on measuring the value of internal auditing. Its purpose is to 1) conduct
a global analysis2 of 2010 survey data that is expected to shed some light on the relative use or different
key performance indicators; and 2) provide useful and actionable information for practitioners from the analysis.
As reported in the 2006 survey, value indicators or methods used by the surveyed organizations in measuring the value of internal auditing include the acceptance and implementation of recommendations, assessment by customer surveys from audited departments, the number of management requests for internal assurance or consulting projects, and reliance by the external auditors on the internal audit activity. It is documented that “considerable differences exist between groups in the methods used to evaluate the value add by the [internal audit activities (IAAs)]” (CBOK Survey, 2006, pp. 197–199). The value provided by the internal audit activities can be viewed from the perspectives of internal audit service providers, customers (such as the board, audit committee, senior management), and other stakeholders. The survey only investigates the view of internal audit service providers; therefore, this report only covers the value of the internal audit activity as perceived by internal audit service providers.
This report goes a step further to focus on understanding the linkage between the performance of an internal audit activity and its perceived contribution (value). To better understand the linkage, the following issues are addressed:
Is there a relationship between organizational characteristics and the perceived contribution of an internal audit activity?
How do the characteristics of an internal audit activity affect its perceived contribution? Do ways of measuring the performance of an internal audit activity used by organizations affect
the activity’s perceived contribution?
Is there a relationship between the services performed by and the perceived contribution of an internal audit activity?
1 As of 2011, “add value” is deined as, “The internal audit activity adds value to the organization (and its stakeholders) when it
provides objective and relative assurance, and contributes to the effectiveness of governance, risk management, and control pro-cesses.”
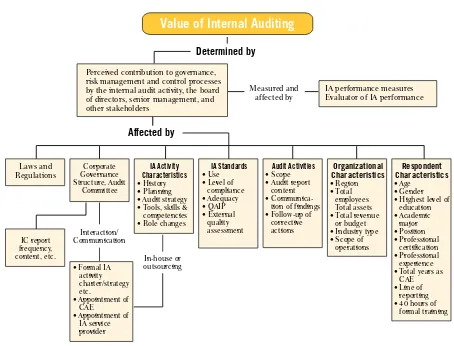
The basic notion is that the value of an internal audit activity is determined by its usefulness to the organization. The usefulness of internal audit services is relected by the activity’s perceived contribution, which is affected by many factors, including organizational characteristics (Issue 1), the internal audit activity’s characteristics (Issue 2), performance measurement of the internal audit activity (Issue 3), and the internal audit services performed (Issue 4). In addition, there are other factors (such as laws and regulations, corporate governance structure, and characteristics of survey respondents) that need to be considered in analyzing the value of internal auditing. A conceptual framework for the interrelationships between the perceived contribution (value) of internal auditing and these factors is illustrated in Figure 1-1.
Figure 1-1: Conceptual Framework for Measuring Internal Auditing’s Value
This report analyzes the relationship between organizational characteristics (such as region, industry type, and scope of operations) and the perceived contributions of internal auditing. Secondly, it examines the methods or mechanisms used by organizations to measure the performance of their internal audit activity and determines whether these methods affect the internal auditors’ perceptions of their contribution. Key success factors such as the internal audit activity’s organizational status, independence, strategy, stafing or competencies are identiied for valuable internal audit activities. Finally, this report compares the key performance indicators used by an internal audit activity with its perceived contribution to the organization.
Value of Internal Auditing
Determined by
Affected by
Perceived contribution to governance, risk management and control processes by the internal audit activity, the board of directors, senior management, and other stakeholders
Chapter 2
Perceived Contributions of Internal Auditing and
Organizational Characteristics
Perceived Contributions of Internal Auditing
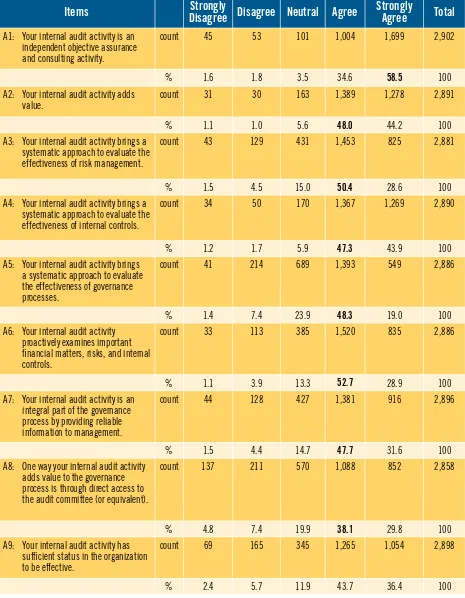
Report III uses the perceived contribution of an internal audit activity as the proxy for its value to the organization. In the survey, one of the questions is designed to understand the respondents’ perception of the contribution of their internal audit activities. The question contains 15 statements addressing the different aspects of added value of an internal audit activity to its organization. Table 2–1 provides the respondents’ level of agreement with each of the statements.
The majority of the respondents agree that their own internal audit activity: Is an independent objective assurance and consulting activity. Adds value to its organization.
Brings a systematic approach to evaluate the effectiveness of internal controls. Proactively examines important financial matters, risks, and internal controls.
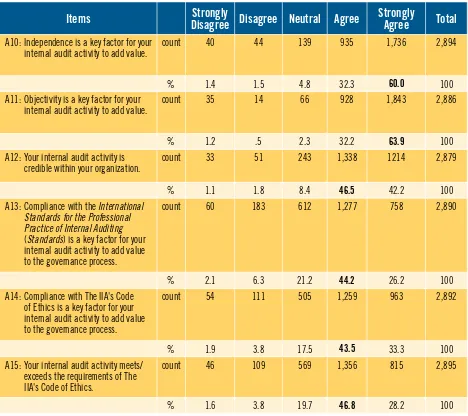
In addition, they agree that both independence and objectivity are key factors for their internal audit activity to add value.
Table 2–1
Perceived Contributions of the Internal Audit Activity
Items
Strongly
Disagree
Disagree
Neutral
Agree
Strongly
Agree
Total
A1: Your internal audit activity is an independent objective assurance and consulting activity.
count 45 53 101 1,004 1,699 2,902
% 1.6 1.8 3.5 34.6 58.5 100
A2: Your internal audit activity adds value.
count 31 30 163 1,389 1,278 2,891
% 1.1 1.0 5.6 48.0 44.2 100
A3: Your internal audit activity brings a systematic approach to evaluate the effectiveness of risk management.
count 43 129 431 1,453 825 2,881
% 1.5 4.5 15.0 50.4 28.6 100
A4: Your internal audit activity brings a systematic approach to evaluate the effectiveness of internal controls.
count 34 50 170 1,367 1,269 2,890
% 1.2 1.7 5.9 47.3 43.9 100
A5: Your internal audit activity brings a systematic approach to evaluate the effectiveness of governance processes.
count 41 214 689 1,393 549 2,886
% 1.4 7.4 23.9 48.3 19.0 100
A6: Your internal audit activity proactively examines important inancial matters, risks, and internal controls.
count 33 113 385 1,520 835 2,886
% 1.1 3.9 13.3 52.7 28.9 100
A7: Your internal audit activity is an integral part of the governance process by providing reliable information to management.
count 44 128 427 1,381 916 2,896
% 1.5 4.4 14.7 47.7 31.6 100
A8: One way your internal audit activity adds value to the governance process is through direct access to the audit committee (or equivalent).
count 137 211 570 1,088 852 2,858
% 4.8 7.4 19.9 38.1 29.8 100
A9: Your internal audit activity has suficient status in the organization to be effective.
count 69 165 345 1,265 1,054 2,898
% 2.4 5.7 11.9 43.7 36.4 100
Items
Strongly
Disagree
Disagree
Neutral
Agree
Strongly
Agree
Total
A10: Independence is a key factor for your internal audit activity to add value.
count 40 44 139 935 1,736 2,894
% 1.4 1.5 4.8 32.3 60.0 100
A11: Objectivity is a key factor for your internal audit activity to add value.
count 35 14 66 928 1,843 2,886
% 1.2 .5 2.3 32.2 63.9 100
A12: Your internal audit activity is credible within your organization.
count 33 51 243 1,338 1214 2,879
% 1.1 1.8 8.4 46.5 42.2 100
A13: Compliance with the International Standards for the Professional Practice of Internal Auditing
(Standards) is a key factor for your internal audit activity to add value to the governance process.
count 60 183 612 1,277 758 2,890
% 2.1 6.3 21.2 44.2 26.2 100
A14: Compliance with The IIA's Code of Ethics is a key factor for your internal audit activity to add value to the governance process.
count 54 111 505 1,259 963 2,892
% 1.9 3.8 17.5 43.5 33.3 100
A15: Your internal audit activity meets/ exceeds the requirements of The IIA's Code of Ethics.
count 46 109 569 1,356 815 2,895
% 1.6 3.8 19.7 46.8 28.2 100
Most respondents believe that compliance with the Standards and The IIA’s Code of Ethics is a key factor in adding value to the governance process and 75 percent of the respondents believe that their internal audit activity meets/exceeds the requirements of the Code of Ethics.
In summary, most respondents believe that their internal audit activities are adding value to their organizations. As expected, both independence and objectivity are viewed as key factors for internal audit activities to add value. The results also indicate that while most internal audit functions see themselves as contributing to controls, they do not to the same extent perceive themselves as contributing to risk management or governance.
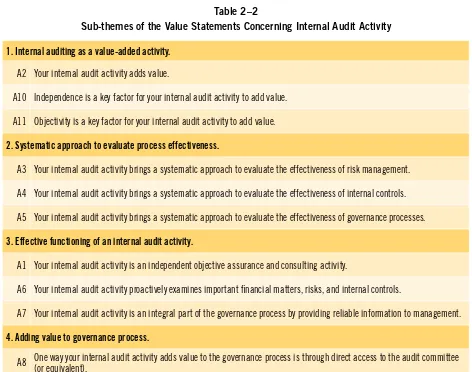
The perceived contribution of the internal audit activity is measured with 15 value statements in the 2010 survey questionnaire. Based on the nature of these value statements and for the ease of discussion, the statements are classified into five sub-themes: 1) value added by the internal audit activity; 2) systematic approach to evaluate process effectiveness; 3) effective functioning of the internal audit
Table 2–1
Perceived Contributions of the Internal Audit Activity (continued)
activity; 4) adding value to governance process; and 5) organization status of an effective internal audit activity. The reasons for these groupings are as follows.
First, for an internal audit activity to add value (A2), independence (A10) and objectivity (A11) are two of the basic requirements. Furthermore, the internal audit activity contributes to the effectiveness and efficiency of governance (A5), risk management (A3), and control processes (A4). For an internal audit activity to be effective, it should provide independent objective assurance and consulting services (A1), proactively examine important financial matters, risks, and internal controls (A6), and be an integral part of the governance process by providing reliable information to management (A7). Compliance with the Standards (A13) and Code of Ethics (A14) is essential for an internal audit activity to add value to the governance process. Also important is an internal audit activity’s direct access to the audit committee or equivalent (A8). Finally, an effective internal audit activity needs to have sufficient status (A9) and be credible within the organization (A12). Meeting or exceeding the requirements of the Code of Ethics by an internal audit activity (A15) is essential to maintaining its status and credibility. The grouping of the value statements is shown in Table 2–2.
Table 2–2
Sub-themes of the Value Statements Concerning Internal Audit Activity
1. Internal auditing as a value-added activity.
A2 Your internal audit activity adds value.
A10 Independence is a key factor for your internal audit activity to add value.
A11 Objectivity is a key factor for your internal audit activity to add value.
2. Systematic approach to evaluate process effectiveness.
A3 Your internal audit activity brings a systematic approach to evaluate the effectiveness of risk management.
A4 Your internal audit activity brings a systematic approach to evaluate the effectiveness of internal controls.
A5 Your internal audit activity brings a systematic approach to evaluate the effectiveness of governance processes.
3. Effective functioning of an internal audit activity.
A1 Your internal audit activity is an independent objective assurance and consulting activity.
A6 Your internal audit activity proactively examines important inancial matters, risks, and internal controls.
A7 Your internal audit activity is an integral part of the governance process by providing reliable information to management.
4. Adding value to governance process.
A8 One way your internal audit activity adds value to the governance process is through direct access to the audit committee (or equivalent).
A13 Compliance with the International Standards for the Professional Practice of Internal Auditing (Standards) is a key factor for your internal audit activity to add value to the governance process.
A14 Compliance with The IIA’s Code of Ethics is a key factor for your internal audit activity to add value to the governance process.
5. Organizational status for an effective internal audit activity.
A9 Your internal audit activity has suficient status in the organization to be effective.
A12 Your internal audit activity is credible within your organization.
A15 Your internal audit activity meets/exceeds the requirements of The IIA’s Code of Ethics.
Perceived Contributions and Regions of Work
There are regional differences in the social, economic, regulatory, and cultural environments within which organizations operate. These differences would be expected to affect the way an internal audit activity functions and its perceived contribution to the organization. This section analyzes the relationship between the respondents’ perceived contribution and their regions of work based on The IIA’s classification of seven regions.3 Due to the ambiguity inherent in the Unanswered/Other category,
the following analyses do not include this category. The results are presented in Tables 2–3 through
2–9.
Internal Auditing as a Value-added Activity
As indicated in Table 2–3, the Latin America and Caribbean region has the highest percentage of respondents who “strongly agree” or “agree” that their internal audit activity adds value to its organization (A2) (95.5 percent). This is followed by the United States and Canada (94.4 percent) and Western Europe (94.0 percent). The Asia Pacific region has the lowest percentage (85.2 percent) of respondents who “strongly agree” or “agree.”
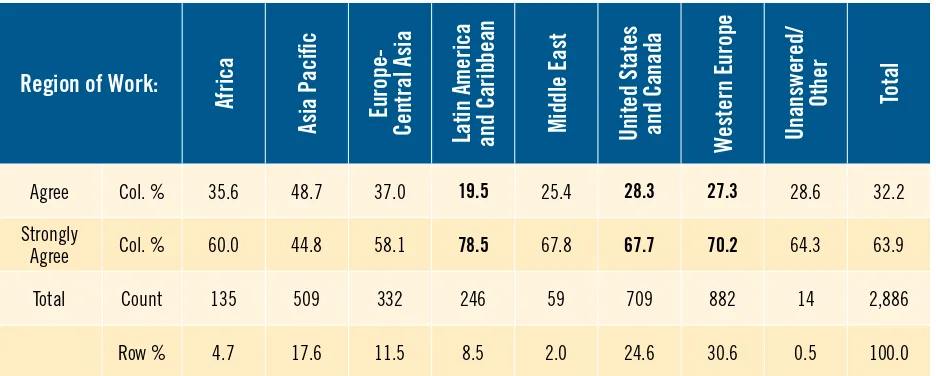
For statements A10 (independence) and A11 (objectivity), the differences in the levels of agreement across the regions are less significant. The Latin America and Caribbean region still has the highest percentage (96.3 percent and 98.0 percent), followed by Western Europe (93.8 percent and 97.5 percent) and the United States and Canada (91.7 percent and 96.0 percent). In addition, Europe-Central Asia and the Middle East have the lowest level of agreement on statements A10 and A11, respectively.
3 Where the respondent is working for a multinational company, the survey does not investigate the regions of operation for that
company. Therefore, our analysis is based only on the respondent’s region of work as identiied by the respondent.
Table 2–2
Sub-themes of the Value Statements Concerning Internal Audit Activity (continued)
Table 2–3
Regional Comparison of Value Added by the Internal Audit Activity
Region of Work:
Africa
Asia Paciic
Europe-
Central Asia
Latin America
and Caribbean
Middle East
United States
and Canada
Western Europe
Unanswered/
Other
Total
A2: Your internal audit activity adds value.
Strongly
Disagree Col. % 2.2 1.6 0.9 0.8 0.0 1.6 0.5 0.0 1.1
Disagree Col. % 1.5 1.6 0.9 2.0 3.4 0.9 0.5 0.0 1.0
Neutral Col. % 5.1 11.7 6.0 1.6 5.2 3.1 5.1 14.3 5.6
Agree Col. % 46.0 57.0 44.3 30.2 31.0 42.1 55.3 50.0 48.0 Strongly
Agree Col. % 45.3 28.2 47.9 65.3 60.3 52.3 38.7 35.7 44.2
Total Count 137 514 336 245 58 705 882 14 2,891
Row % 4.7 17.8 11.6 8.5 2.0 24.4 30.5 0.5 100.0
A10: Independence is a key factor for your internal audit activity to add value.
Strongly
Disagree Col. % 2.2 1.6 1.5 0.4 1.7 1.8 1.0 0.0 1.4
Disagree Col. % 0.7 2.0 1.5 0.4 1.7 2.1 1.2 0.0 1.5
Neutral Col. % 4.4 6.1 7.2 2.9 5.1 4.4 4.0 14.3 4.8
Agree Col. % 30.7 48.4 33.2 16.7 25.4 31.7 28.2 28.6 32.3 Strongly
Agree Col. % 62.0 42.0 56.6 79.6 66.1 60.0 65.6 57.1 60.0
Total Count 137 512 334 245 59 710 883 14 2,894
Row % 4.7 17.7 11.5 8.5 2.0 24.5 30.5 0.5 100.0
A11: Objectivity is a key factor for your internal audit activity to add value.
Strongly
Disagree Col. % 2.2 1.6 0.9 0.8 1.7 1.7 0.7 0.0 1.2
Disagree Col. % 0.0 1.8 0.0 0.4 0.0 0.3 0.2 0.0 0.5
Neutral Col. % 2.2 3.1 3.9 0.8 5.1 2.0 1.6 7.1 2.3
Region of Work:
Africa
Asia Paciic
Europe-
Central Asia
Latin America
and Caribbean
Middle East
United States
and Canada
Western Europe
Unanswered/
Other
Total
Agree Col. % 35.6 48.7 37.0 19.5 25.4 28.3 27.3 28.6 32.2 Strongly
Agree Col. % 60.0 44.8 58.1 78.5 67.8 67.7 70.2 64.3 63.9
Total Count 135 509 332 246 59 709 882 14 2,886
Row % 4.7 17.6 11.5 8.5 2.0 24.6 30.6 0.5 100.0
Systematic Approach to Evaluating Process Effectiveness
Based on The IIA’s definition, internal auditing helps an organization accomplish its objectives by bringing a systematic, disciplined approach to evaluate and improve the effectiveness of risk
management, control, and governance processes. Table 2–4 summarizes the respondents’ assessments by region of the level at which their internal audit activity contributes to the systematic evaluation of the effectiveness of risk management, internal control, and governance processes.
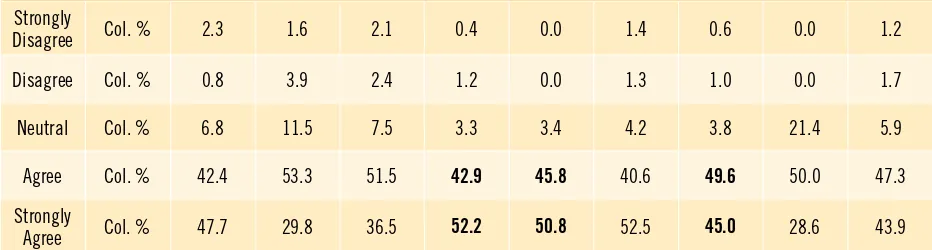
Respondents across all regions indicate that their internal audit activity contributes to the systematic evaluation of internal control, followed by a slightly lower assessment of the contribution of the internal audit activity to the effectiveness of risk management. In addition, there are higher percentages of neutral responses for the statement relating to governance processes. It implies that the respondents are less confident with their contributions to the systematic evaluation of the risk management and governance processes of their organizations than the contribution of the internal audit activity to the evaluation of internal controls (Table 2–4).
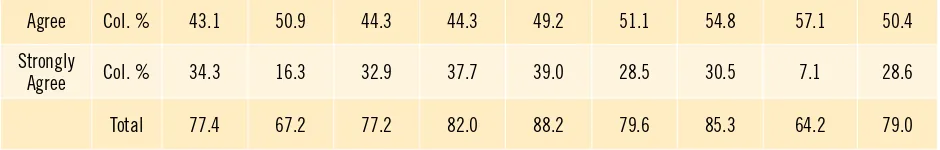
If a mature internal audit function is defined as being one where the perceived importance of
governance, risk management, and control is co-equal, then the organizational importance of internal auditing may be rated based on the three values in combination. With that in mind, Table 2–5 presents the levels of agreement with these three statements in combination by region. Among the regions, the Middle East has the highest average level of agreement (87.6 percent), followed by Latin America and the Caribbean (84.0 percent) and Western Europe (82.5 percent). The Asia Pacific region has the lowest average level of agreement (70.5 percent).
Effective Functioning of the Internal Audit Activity
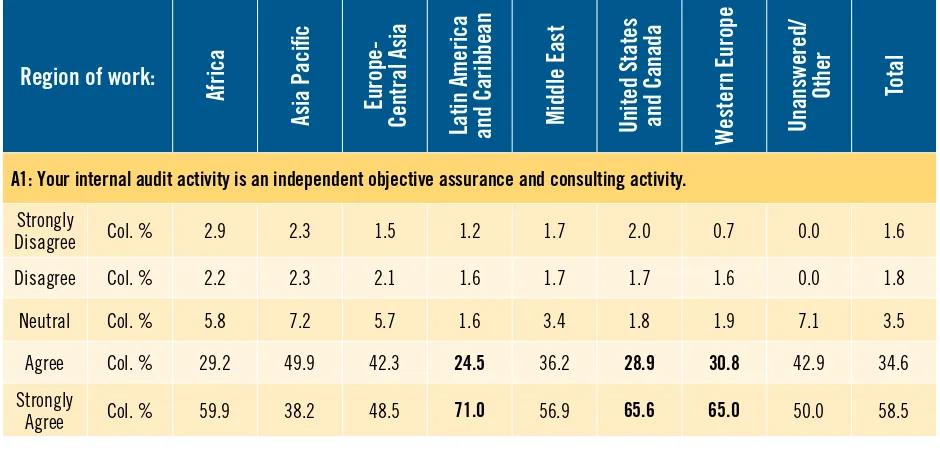
The majority of respondents from all regions “strongly agree” or “agree” that their internal audit activity is an independent objective assurance and consulting activity. The regions with the highest levels of
Table 2–3
Regional Comparison of Value Added by the Internal Audit Activity (continued)
agreement are Western Europe (95.8 percent), Latin America and Caribbean (95.5 percent), and United States and Canada (94.5 percent). (See Table 2–6.)
The perceived contribution of the internal audit activity in examining important financial matters, risks, and internal controls is highest among respondents from the Middle East (91.2 percent), followed by Latin America and Caribbean (89.4 percent) and Africa (86.7 percent). These regions also have the three highest levels of agreement on the contribution of the internal audit activity to providing reliable information to management (89.7 percent, 83.7 percent, and 82.4 percent). However, only 69.3 percent of the respondents from Europe-Central Asia perceive that their internal audit activity proactively examines important financial matters, risks, and internal controls, which is lower than the average percentage of 81.6 percent.
Table 2–4
Regional Comparison of Systematic Approach to Evaluating Process Effectiveness
Region of work:
Africa
Asia Paciic
Europe-Central
Asia
Latin America
and Caribbean
Middle East
United States
and Canada
Western Europe
Unanswered/
Other
Total
A3: Your internal audit activity brings a systematic approach to evaluate the effectiveness of risk management.
Strongly
Disagree Col. % 2.2 2.2 2.7 1.2 0.0 1.1 0.9 7.1 1.5
Disagree Col. % 5.1 5.7 5.4 2.9 5.1 5.1 3.3 0.0 4.5
Neutral Col. % 15.3 25.0 14.7 13.9 6.8 14.2 10.5 28.6 15.0
Agree Col. % 43.1 50.9 44.3 44.3 49.2 51.1 54.8 57.1 50.4
Strongly
Agree Col. % 34.3 16.3 32.9 37.7 39.0 28.5 30.5 7.1 28.6
Total Count 137 509 334 244 59 705 879 14 2,881
Row % 4.8 17.7 11.6 8.5 2.0 24.5 30.5 0.5 100.0
A4: Your internal audit activity brings a systematic approach to evaluate the effectiveness of internal controls.
Strongly
Region of work:
Africa
Asia Paciic
Europe-Central
Asia
Latin America
and Caribbean
Middle East
United States
and Canada
Western Europe
Unanswered/
Other
Total
Total Count 132 514 334 245 59 707 885 14 2,890
Row % 4.6 17.8 11.6 8.5 2.0 24.5 30.6 0.5 100.0
A5: Your internal audit activity brings a systematic approach to evaluate the effectiveness of governance processes.
Strongly
Disagree Col. % 1.5 1.8 3.6 1.6 1.7 1.0 0.7 0.0 1.4
Disagree Col. % 5.2 8.4 6.9 6.6 5.1 7.6 7.5 14.3 7.4
Neutral Col. % 23.7 28.5 18.7 16.9 15.3 25.6 24.2 28.6 23.9
Agree Col. % 46.7 46.3 48.9 47.7 49.2 48.2 49.5 50.0 48.3 Strongly
Agree Col. % 23.0 15.0 21.8 27.2 28.8 17.5 18.2 7.1 19.0
Total Count 135 512 331 243 59 707 885 14 2,886
Row % 4.7 17.7 11.5 8.4 2.0 24.5 30.7 0.5 100.0
Table 2–5
Regional Comparison of Systematic Approach to Evaluating Process Effectiveness (three statements combined)
Region of work:
Africa
Asia Paciic
Europe-
Central Asia
Latin
America and
Caribbean
Middle East
United
States and
Canada
Western
Europe
Unanswered/
Other
Total
A3: Your internal audit activity brings a systematic approach to evaluate the effectiveness of risk management.
Agree Col. % 43.1 50.9 44.3 44.3 49.2 51.1 54.8 57.1 50.4
Strongly
Agree Col. % 34.3 16.3 32.9 37.7 39.0 28.5 30.5 7.1 28.6
Total 77.4 67.2 77.2 82.0 88.2 79.6 85.3 64.2 79.0 Table 2–4
Regional Comparison of Systematic Approach to Evaluating Process Effectiveness (continued)
Region of work:
Africa
Asia Paciic
Europe-
Central Asia
Latin
America and
Caribbean
Middle East
United
States and
Canada
Western
Europe
Unanswered/
Other
Total
A4: Your internal audit activity brings a systematic approach to evaluate the effectiveness of internal controls.
Agree Col. % 42.4 53.3 51.5 42.9 45.8 40.6 49.6 50.0 47.3
Strongly
Agree Col. % 47.7 29.8 36.5 52.2 50.8 52.5 45.0 28.6 43.9
Total 90.1 83.1 88.0 95.1 96.6 93.1 94.6 78.6 91.2
A5: Your internal audit activity brings a systematic approach to evaluate the effectiveness of governance processes.
Agree Col. % 46.7 46.3 48.9 47.7 49.2 48.2 49.5 50.0 48.3
Regional Comparison of Effective Functioning of the Internal Audit Activity
Region of work:
Africa
Asia Paciic
Europe-
Central Asia
Latin America
and Caribbean
Middle East
United States
and Canada
Western
Europe
Unanswered/
Other
Total
A1: Your internal audit activity is an independent objective assurance and consulting activity.
Strongly
Regional Comparison of Systematic Approach to Evaluating Process Effectiveness (three statements combined) (continued)
Region of work:
Africa
Asia Paciic
Europe-
Central Asia
Latin America
and Caribbean
Middle East
United States
and Canada
Western
Europe
Unanswered/
Other
Total
Total Count 137 513 336 245 58 710 889 14 2,902
Row % 4.7 17.7 11.6 8.4 2.0 24.5 30.6 0.5 100.0
A6: Your internal audit activity proactively examines important inancial matters, risks, and internal controls.
Strongly
Total Count 136 511 333 245 57 707 883 14 2,886
Row % 4.7 17.7 11.5 8.5 2.0 24.5 30.6 0.5 100.0
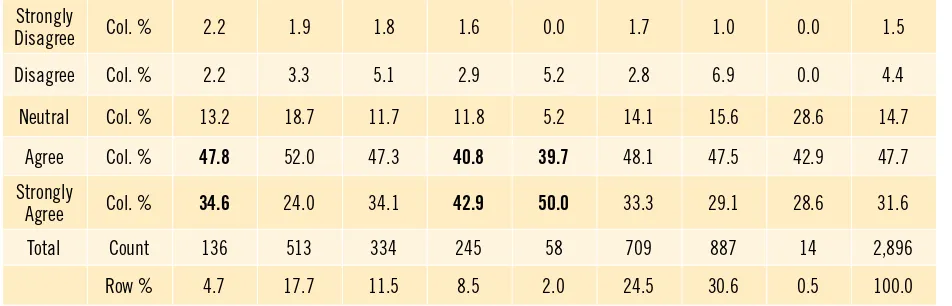
A7: Your internal audit activity is an integral part of the governance process by providing reliable information to management.
Strongly
Disagree Col. % 2.2 1.9 1.8 1.6 0.0 1.7 1.0 0.0 1.5
Disagree Col. % 2.2 3.3 5.1 2.9 5.2 2.8 6.9 0.0 4.4
Neutral Col. % 13.2 18.7 11.7 11.8 5.2 14.1 15.6 28.6 14.7
Agree Col. % 47.8 52.0 47.3 40.8 39.7 48.1 47.5 42.9 47.7
Strongly
Agree Col. % 34.6 24.0 34.1 42.9 50.0 33.3 29.1 28.6 31.6
Total Count 136 513 334 245 58 709 887 14 2,896
Row % 4.7 17.7 11.5 8.5 2.0 24.5 30.6 0.5 100.0
Adding Value to the Governance Process
More than 84 percent of the respondents from the United States and Canada “agree” or “strongly agree” that their internal audit activity adds value to the governance process through direct access to the audit committee (or equivalent), followed by Africa (77.1 percent) and the Middle East (76.3 percent). In contrast, only 54 percent of the respondents from Asia Pacific “agree” or “strongly agree” that their internal audit activity adds value to the governance process through direct access to the audit committee or equivalent (Table 2–7).
Table 2–6
Regional Comparison of Effective Functioning of the Internal Audit Activity (continued)
This result is not consistent with the reported appropriate access of the internal audit activity to the audit committee by region. As shown in Table 2–8, Western Europe ranked second for the appropriate access to the audit committee (20.3 percent) and is very close to the United States and Canada (20.5 percent). In contrast, only 61.1 percent of the respondents from Western Europe indicated that their internal audit activity adds value to the governance process through direct access to the audit committee (or equivalent), which is significantly lower than that of the United States and Canada (84.6 percent). This might suggest that the audit committee does not have the same role in Western Europe that it does in the United States and Canada.
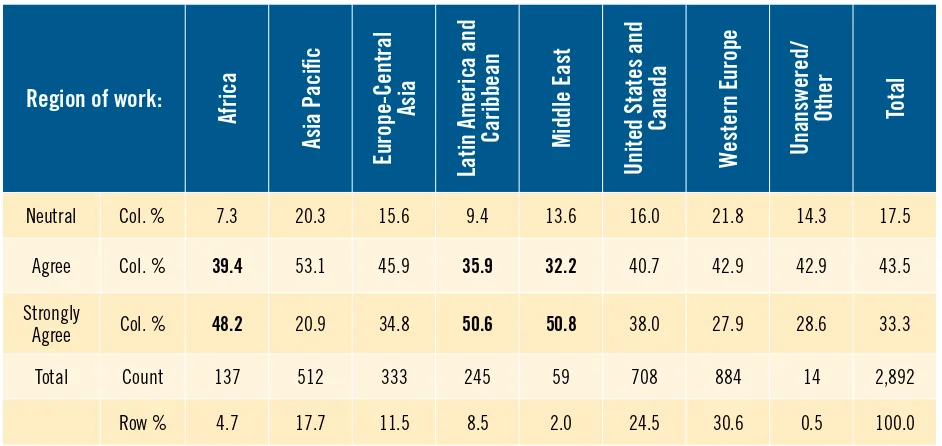
In Table 2– 7, the percentage of respondents that “agree” or “strongly agree” that compliance with the Standards is a key factor for their internal audit activity to add value to the governance process was highest in Africa (87.4 percent), Latin America (85.3 percent), and the Middle East (81.4 percent). Similarly, respondents from these regions that “agree” or “strongly agree” that compliance with The IIA’s Code of Ethics is a key factor for their internal audit activity to add value to the governance process was higher than any other region (87.6 percent, 86.5 percent, and 83 percent, respectively). Surprisingly, the United States and Canada has the lowest level of respondents that “agree” or “strongly agree” (62.8 percent) that compliance with the Standards is a key factor for their internal audit activity to add value to the governance process. Western Europe ranked last for the percentage of respondents that “agree” or “strongly agree” (70.8 percent) that compliance with The IIA’s Code of Ethics is a key factor in adding value to the governance process. Considering the efforts that The IIA has made in promoting the Standards and the Code of Ethics in these two regions, it may be worthwhile to explore the underlying reasons for these results. It might be, for example, that these are regarded as “foundational” in the two regions and that internal audit activities have higher expectations than stated in the Standards and Code of Ethics. This would cause respondents to downgrade their importance.
Organizational Status of an Effective Internal Audit Activity
As indicated in Table 2–9, more than 80 percent of the respondents from most regions “agree” or “strongly agree” with the statements on their internal audit activity’s sufficiency of status and credibility within the organization. The majority of the respondents in the Middle East (91.5 percent), Latin America (88.2 percent), and Western Europe (82 percent) “agree” or “strongly agree” that their internal audit activity has sufficient status in the organization to be effective. The same regions also ranked among the top three for the response that their internal audit activity is credible within their organization.
In general, the respondents believe that they have sufficient status and are credible in the organization. Both conditions are beneficial to the effectiveness of their internal audit activities. Asia Pacific has the lowest levels of agreement for both statements. This implies that effort may be needed to improve the status of the internal audit profession in this region.
Respondents from the United States and Canada have the highest level of agreement (85.6 percent) that their internal audit activity meets/exceeds the requirements of The IIA’s Code of Ethics, followed by the Middle East (84.2 percent) and Europe and Central Asia (78.2 percent). Again, Asia Pacific has the lowest level of agreement (63.7 percent).
Table 2–7
Regional Comparison of Ways to Add Value to the Governance Process by the Internal Audit Activity
Region of work:
A8: One way your internal audit activity adds value to the governance process is through direct access to the audit committee (or equivalent).
Strongly
Disagree Col. % 5.9 3.9 7.2 4.5 0.0 2.0 7.0 0.0 4.8
Disagree Col. % 4.4 10.0 10.9 5.3 3.4 3.1 9.5 0.0 7.4
Neutral Col. % 12.6 32.1 21.8 14.8 20.3 10.3 22.4 28.6 19.9
Agree Col. % 45.2 35.2 31.8 32.0 42.4 44.6 36.9 50.0 38.1 Strongly
Agree Col. % 31.9 18.8 28.3 43.4 33.9 40.0 24.2 21.4 29.8
Total Count 135 511 321 244 59 707 867 14 2,858
Row % 4.7 17.9 11.2 8.5 2.1 24.7 30.3 0.5 100.0
A13: Compliance with the International Standards for the Professional Practice of Internal Auditing (Standards) is a key factor for your internal audit activity to add value to the governance process.
Strongly
Disagree Col. % 1.5 2.0 1.5 1.6 1.7 2.8 1.9 7.7 2.1
Disagree Col. % 0.7 4.5 3.0 3.3 5.1 10.6 7.1 0.0 6.3
Neutral Col. % 10.4 24.9 20.1 9.8 11.9 23.8 22.5 38.5 21.2
Agree Col. % 42.2 51.3 46.4 40.2 40.7 38.5 45.8 23.1 44.2 Strongly
Agree Col. % 45.2 17.4 29.0 45.1 40.7 24.3 22.7 30.8 26.2
Total Count 135 511 334 246 59 709 883 13 2,890
Row % 4.7 17.7 11.6 8.5 2.0 24.5 30.6 0.4 100.0
A14: Compliance with The IIA’s Code of Ethics is a key factor for your internal audit activity to add value to the governance process.
Strongly
Disagree Col. % 2.2 2.1 1.5 1.2 1.7 2.1 1.7 7.1 1.9
Disagree Col. % 2.9 3.5 2.1 2.9 1.7 3.2 5.7 7.1 3.8
Region of work:
Africa
Asia Paciic
Europe-Central
Asia
Latin America and
Caribbean
Middle East
United States and
Canada
Western Europe
Unanswered/
Other
Total
Neutral Col. % 7.3 20.3 15.6 9.4 13.6 16.0 21.8 14.3 17.5
Agree Col. % 39.4 53.1 45.9 35.9 32.2 40.7 42.9 42.9 43.5
Strongly
Agree Col. % 48.2 20.9 34.8 50.6 50.8 38.0 27.9 28.6 33.3
Total Count 137 512 333 245 59 708 884 14 2,892
Row % 4.7 17.7 11.5 8.5 2.0 24.5 30.6 0.5 100.0
Table 2–8
Appropriate Access to the Audit Committee by the Internal Audit Activity
Region of work:
Africa
Asia Paciic
Europe-Central
Asia
Latin America
and Caribbean
Middle East
United States
and Canada
Western Europe
Unanswered/
Other
Total
Do you believe that you have appropriate access to the audit committee?
Not Answered Col. % 79.6 83.5 84.5 85.9 86.7 78.3 76.6 76.1 80.8
Yes Col. % 18.1 14.9 12.2 12.2 11.7 20.5 20.3 23.9 17.2
No Col. % 2.3 1.6 3.3 1.9 1.7 1.1 3.1 0.0 2.1
Total Count 598 2,099 1,074 1,595 412 3,231 2,798 46 11,853
Row % 5.0 17.7 9.1 13.5 3.5 27.3 23.6 0.4 100.0
Table 2–7
Regional Comparison of Ways to Add Value to the Governance Process by the Internal Audit Activity (continued)
Table 2–9
Regional Comparison of Organizational Status of the Internal Audit Activity
Region of work:
Africa
Asia Paciic
Europe-
Central Asia
Latin America
and Caribbean
Middle East
United States
and Canada
Western Europe
Unanswered/
Other
Total
A9: Your internal audit activity has suficient status in the organization to be effective.
Strongly
Disagree Col. % 2.9 2.7 3.0 1.2 0.0 2.8 2.0 0.0 2.4
Disagree Col. % 5.1 7.2 8.7 3.7 1.7 4.9 5.3 0.0 5.7
Neutral Col. % 15.3 17.2 11.0 7.0 6.8 11.6 10.6 14.3 11.9
Agree Col. % 39.4 48.1 43.0 35.7 52.5 43.2 43.6 64.3 43.7 Strongly
Agree Col. % 37.2 24.8 34.3 52.5 39.0 37.5 38.4 21.4 36.4
Total Count 137 513 335 244 59 709 887 14 2,898
Row % 4.7 17.7 11.6 8.4 2.0 24.5 30.6 0.5 100.0
A12: Your internal audit activity is credible within your organization.
Strongly
Disagree Col. % 1.5 2.0 1.5 0.4 0.0 1.6 0.5 0.0 1.1
Disagree Col. % 2.2 2.9 2.4 0.4 1.7 1.7 1.3 0.0 1.8
Neutral Col. % 9.5 16.3 11.5 2.4 1.7 7.1 5.6 21.4 8.4
Agree Col. % 51.1 56.1 47.7 31.8 48.3 42.6 46.9 42.9 46.5 Strongly
Agree Col. % 35.8 22.7 36.9 64.9 48.3 47.1 45.8 35.7 42.2
Total Count 137 510 331 245 58 705 879 14 2,879
Row % 4.8 17.7 11.5 8.5 2.0 24.5 30.5 0.5 100.0
A15: Your internal audit activity meets/exceeds the requirements of The IIA’s Code of Ethics.
Strongly
Disagree Col. % 1.5 2.2 2.7 0.8 0.0 1.4 1.4 0.0 1.6
Disagree Col. % 5.8 4.7 3.6 4.1 0.0 2.8 3.8 7.1 3.8
Neutral Col. % 21.2 29.4 15.5 18.7 15.8 10.1 23.4 28.6 19.7
Agree Col. % 43.8 49.0 57.0 47.6 54.4 42.8 44.9 35.7 46.8
Region of work:
Africa
Asia Paciic
Europe-
Central Asia
Latin America
and Caribbean
Middle East
United States
and Canada
Western Europe
Unanswered/
Other
Total
Strongly
Agree Col. % 27.7 14.7 21.2 28.9 29.8 42.8 26.5 28.6 28.2
Total Count 137 510 335 246 57 710 886 14 2,895
Row % 4.7 17.6 11.6 8.5 2.0 24.5 30.6 0.5 100.0
Perceived Contributions and Industry Groups
Organizations specializing or operating in different types of industry may face different kinds of technological, regulatory, and environmental challenges and opportunities. These differences, in turn, are likely to affect the way an internal audit activity functions and its perceived contribution to the organization. This section presents an analysis of the relationship between the perceived contribution and the organization’s industry type based on The IIA’s classification of eight industry groups. The results are presented in Tables 2–10 through 2-14.
Internal Auditing as a Value-added Activity
Table 2–10 indicates a high level of agreement by respondents from different industries that their internal audit activity adds value and that independence and objectivity are key factors for the internal audit activity to add value. Across all industries, statement A11 (objectivity) has the highest level of agreement.
Table 2–9
Regional Comparison of Organizational Status of the Internal Audit Activity (continued)
Table 2–10
Industry Comparison of Added Value by the Internal Audit Activity
Industry Type:
Financial
Manufacturing &
Construction
Public Sector/
Government
Raw Material &
Agriculture
Service
Transportation,
Communication,
Electric, Gas,
Sanitary Services
Wholesale & Retail
Trade
Other
Total
A2: Your internal audit activity adds value.
Strongly Disagree Col. % 1.0 0.4 2.6 0.0 1.6 1.7 0.0 0.5 1.1
Disagree Col. % 0.8 1.5 1.1 1.8 0.5 0.6 1.4 1.9 1.0
Neutral Col. % 5.6 7.0 3.8 4.4 4.9 5.2 5.0 7.7 5.6
Agree Col. % 45.7 51.7 51.9 41.2 45.6 47.8 49.6 51.4 48.0 Strongly Agree Col. % 46.9 39.5 40.6 52.6 47.4 44.8 43.9 38.5 44.2
Total Count 874 544 266 114 384 362 139 208 2,891
Row % 30.2 18.8 9.2 3.9 13.3 12.5 4.8 7.2 100.0
A10: Independence is a key factor for your internal audit activity to add value.
Strongly Disagree Col. % 1.4 1.3 2.3 0.0 1.8 1.9 0.0 0.5 1.4
Disagree Col. % 0.7 2.0 1.5 0.4 1.7 2.1 1.2 0.0 1.5
Neutral Col. % 1.3 2.0 1.9 0.0 1.3 0.8 1.4 3.4 1.5
Agree Col. % 26.5 39.3 32.0 30.7 31.9 34.6 34.0 35.3 32.3 Strongly Agree Col. % 67.7 50.5 59.4 64.0 60.8 57.7 59.6 54.1 60.0
Total Count 872 545 266 114 385 364 141 207 2,894
Row % 30.1 18.8 9.2 3.9 13.3 12.6 4.9 7.2 100.0
A11: Objectivity is a key factor for your internal audit activity to add value.
Strongly Disagree Col. % 1.1 0.7 2.3 0.0 1.8 1.9 0.0 0.5 1.2
Disagree Col. % 0.3 1.1 0.4 0.0 0.3 0.6 0.0 0.5 0.5
Neutral Col. % 1.4 3.3 3.4 0.9 1.8 1.7 1.4 5.3 2.3
Agree Col. % 27.3 39.4 29.9 25.7 30.4 34.2 37.1 36.4 32.2 Strongly Agree Col. % 69.8 55.4 64.0 73.5 65.7 61.7 61.4 57.4 63.9
Total Count 872 540 264 113 385 363 140 209 2,886
Row % 30.2 18.7 9.1 3.9 13.3 12.6 4.9 7.2 100.0
Systematic Approach to Evaluating Process Effectiveness
Table 2–11 summarizes the respondents’ levels of agreement with the three statements regarding their internal audit activity’s contributions to the systematic evaluation of the effectiveness of risk management, internal controls, and governance processes. The levels of agreement (strongly agree and agree) are highest for the statement on the evaluation of internal controls (A4) across all groups, followed by risk management (A3) and governance processes (A5). Similarly, there are higher percentages of “neutral” responses for the statement relating to governance processes.
More specifically, for statement A4, the financial industry (94.4 percent) has the highest level of
agreement, followed by the service industry (92.2 percent) and the raw material and agriculture industry (92.1 percent). Probably due to its nature of business and tight regulations, the financial industry leads the level of agreement for statement A3 (86.1 percent). Raw material and agriculture and service industries ranked second and third, with 83.2 percent and 78.3 percent, respectively. The levels of agreement for statement A5 are, on average, lower than those for the previous two statements. Most of the industry groups have a level of agreement below or close to 70 percent, except raw material and agriculture (78.6 percent).
Effective Functioning of the Internal Audit Activity
As indicated in Table 2–12, most of the respondents from all industry groups “strongly agree” or “agree” that their internal audit activity is an independent objective assurance and consulting activity (A1). The groups with the highest levels of agreement are financial (94.4 percent), service (94.3 percent), and raw material and agriculture (93.8 percent).
With respect to proactively examining important financial matters, risks, and internal controls (A6), the group with the highest level of agreement is service (85.1 percent), followed by raw material and agriculture (83.9 percent) and manufacturing and construction (82.1 percent). Financial has the top level of agreement (82.1 percent) that the internal audit activity is an integral part of the governance process by providing reliable information to management (A7), followed by service (81.3 percent) and transportation, communication, electric, gas, sanitary services (80.5 percent).
Table 2–11
Industry Comparison of Systematic Approach to Evaluating Process Effectiveness
Industry Type:
Financial
Manufacturing &
Construction
Public Sector/
Government
Raw Material &
Agriculture
Service
Transportation,
Communication,
Electric, Gas,
Sanitary Services
Wholesale &
Retail T
rade
Other
Total
A3: Your internal audit activity brings a systematic approach to evaluate the effectiveness of risk management.
Strongly
Disagree Col. % 0.9 1.5 2.2 1.8 1.8 2.2 0.0 1.9 1.5
Disagree Col. % 3.0 5.5 6.0 3.5 5.0 4.4 6.5 4.4 4.5
Neutral Col. % 10.0 20.9 14.2 11.5 14.9 16.3 17.4 19.4 15.0 Agree Col. % 52.6 51.2 50.2 52.2 44.9 48.3 50.7 52.4 50.4 Strongly
Agree Col. % 33.5 20.9 27.3 31.0 33.4 28.7 25.4 21.8 28.6
Total Count 871 541 267 113 383 362 138 206 2,881
Row % 30.2 18.8 9.3 3.9 13.3 12.6 4.8 7.2 100.0
A4: Your internal audit activity brings a systematic approach to evaluate the effectiveness of internal controls.
Strongly
Total Count 871 546 267 113 387 361 138 207 2,890
Row % 30.1 18.9 9.2 3.9 13.4 12.5 4.8 7.2 100.0
A5: Your internal audit activity brings a systematic approach to evaluate the effectiveness of governance processes.
Strongly
Disagree Col. % 1.1 1.3 3.0 0.9 1.3 1.7 1.4 1.0 1.4
Disagree Col. % 6.8 8.1 6.0 4.5 8.6 7.5 8.7 8.7 7.4
Neutral Col. % 22.1 27.2 20.6 16.1 26.3 21.9 26.8 27.9 23.9 Agree Col. % 49.3 47.6 49.1 53.6 42.2 49.9 47.8 50.5 48.3 Strongly
Agree Col. % 20.6 15.8 21.3 25.0 21.6 19.1 15.2 12.0 19.0
Total Count 872 544 267 112 384 361 138 208 2,886
Row % 30.2 18.8 9.3 3.9 13.3 12.5 4.8 7.2 100.0
Table 2–12
Industry Comparison of Effective Functioning of the Internal Audit Activity
Industry Type:
Financial
Manufacturing &
Construction
Public Sector/
Government
Raw Material &
Agriculture
Service
Transportation,
Communication,
Electric, Gas,
Sanitary Services
Wholesale &
Retail T
rade
Other
Total
A1: Your internal audit activity is an independent objective assurance and consulting activity.
Strongly
Total Count 875 547 267 113 387 364 141 208 2,902
Row % 30.2 18.8 9.2 3.9 13.3 12.5 4.9 7.2 100.0
A6: Your internal audit activity proactively examines important inancial matters, risks, and internal controls.
Strongly
Disagree Col. % 1.1 0.7 1.9 0.0 1.3 1.4 0.7 1.4 1.1
Disagree Col. % 3.8 3.5 3.8 4.5 4.2 3.8 2.9 5.8 3.9
Neutral Col. % 13.5 13.7 14.0 11.6 9.4 14.3 15.8 15.9 13.3 Agree Col. % 50.6 55.0 54.7 49.1 51.7 53.8 54.7 52.9 52.7 Strongly
Agree Col. % 30.9 27.1 25.7 34.8 33.4 26.6 25.9 24.0 28.9
Total Count 873 542 265 112 383 364 139 208 2,886
Row % 30.2 18.8 9.2 3.9 13.3 12.6 4.8 7.2 100.0
A7: Your internal audit activity is an integral part of the governance process by providing reliable information to management.
Strongly
Disagree Col. % 1.6 0.2 2.3 0.9 2.8 1.7 0.0 2.4 1.5
Disagree Col. % 4.4 4.4 4.5 5.3 3.4 5.0 5.0 4.8 4.4
Neutral Col. % 11.9 20.0 16.9 15.9 12.4 12.9 17.7 14.8 14.7 Agree Col. % 45.9 49.0 45.5 40.7 50.6 50.7 46.8 48.3 47.7 Strongly
Agree Col. % 36.2 26.4 30.8 37.2 30.7 29.8 30.5 29.7 31.6
Total Count 872 545 266 113 387 363 141 209 2,896
Row % 30.1 18.8 9.2 3.9 13.4 12.5 4.9 7.2 100.0
Adding Value to the Governance Process
Table 2–13 presents the industry comparison of the ways of adding value to the governance process. raw material and agriculture has the highest level of agreement (77.9 percent) on statement A8, followed by financial (73.2 percent) and wholesale and retail trade (69.5 percent). On the other hand, public sector/government (55.3 percent) has the lowest percentage, possibly because the audit committee (or equivalent) is not as common in this group.
As for statement A13, the groups with the highest levels of agreement are public sector/government (74.7 percent), raw material and agriculture (73.7 percent), and financial (72.3 percent). The public sector/government respondents also show the highest level of agreement (81.9 percent) on statement A14.
Organizational Status of an Effective Internal Audit Activity
As previously indicated, more than 80 percent of the respondents “agree” or “strongly agree” with the statements regarding their internal audit activity’s sufficiency of status (A9) and credibility (A12). However, for statement A9, only two groups have a level of agreement above 80 percent — financial (85.2 percent) and service (81.6 percent). This implies that the internal audit activities from other industry groups may not have the organizational status that they would like to have. Nevertheless, most of the respondents from all the industry groups “agree” or “strongly agree” that their internal audit activity adds value. Although some respondents feel that their activity does not have sufficient status, this does not necessarily affect its value to the organization.
The respondents’ levels of agreement on statement A12, in general, are higher than those for statement A9. The level of agreement for all respondents is more than 80 percent and there are three groups with a level of agreement more than 90 percent — service (92.4 percent), financial (91.6 percent), and wholesale and retail trade (90.1 percent). This implies that although some of the respondents feel that their internal audit activity does not have sufficient status, it is still able to maintain its credibility within the organization.
For statement A15, “Your internal audit activity meets/exceeds the requirements of The IIA’s Code of Ethics,” the levels of agreement for all groups are lower than 80 percent. There is room for improvement in meeting the requirements of the Code of Ethics.