IMPACT OF DEFORESTATION ON ENVIRONMENTAL CONDITION1
Herman Hidayat2
Abstrak
Rezim Orde Baru memulai kebijakan untuk mengeksploitasi hutan pada tahun 1967. Devisa negara yang diperoleh dari hasil hutan baik dari penjualan log kayu, industri plywood dan pulp menduduki nomer dua setelah pendapatan dari sektor minyak. Namun, penebangan log secara besar-besaran di areal konsesi log hutan (HPH) tidak disertai dengan penanaman massal kembali, penegakan hukum bagi mereka yang merusak hutan, dan komitmen yang konsisten mengenai ‘pengelolaan hutan’ yang telah diatur oleh Departemen Kehutanan. Fenomena di atas mendorong percepatan hancurnya hutan (Deforestation and Forest Degradation) di Indonesia.
Tulisan ini memfokuskan kajian mengenai kerusakan hutan di Indonesia, dengan melihat komentar forum-forum kajian seperti FAO, WRI dan Myers serta penulis sendiri. Dikemukakan juga dampak hancurnya hutan atas lingkungan seperti kebakaran hutan tahun 1997-1998, rusaknya spesis sumber hayati hutan, polusi air, perubahan cuaca dan panas bumi.
Introduction
Most of deforestation has occurred in this century, especially since the 1970s. In 1989, the annual rate of deforestation reached 142,200 square kilometers. This represents 1.8% of the 8 million square kilometers of the remaining forest, and the rate of deforestation is even accelerating (Myers, 1992; Palo & Vanhanen, 2000). Current rate of deforestation exceed 0.4 hectares per second (Repetto, 1990), and each hectare may contain millions of fauna representing thousands of species (Uhl and Parker 1986). As a result of habitat destruction, as many as 10,000 species may become extinct each year, unprecedented level in global history
1 This paper is a part of chapter two of Ph.D’ s Thesis in Lab. Of Forest Policy,
Division of Forest Science, Graduate School of Agricultural and Life Sciences, The University of Tokyo. It has presented and revised in November 2002. I would like to thank to Prof. Nagata, Shin and Inoue, Makoto for their comments on this paper.
2 The Writer is Researcher at The Research Center for Society and Culture,
(Raup, 1988; Wilson 1992; Whitemonre and Sayer 1992, Sponsel at al, 1996).
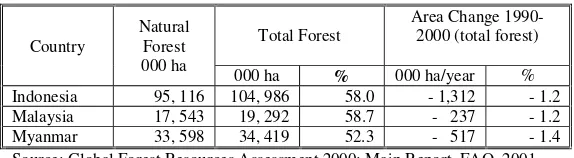
In the case of Indonesia, although Department of Forestry reported in 1997 that Indonesia had 123 million hectares of forest, forest cover at the end of 1990s actually ranged only from 92, 4 million to 113 million hectares (World Bank, 1998). FAO (2000) also reported that natural forest in Indonesia was 95 million hectares of total forest cover of 104 million hectares. At this time, the annual deforestation rates 1.3 million hectares (1.2%). In 1997, the World Resource Institute (WRI) warned that only about 53 million hectares of ‘frontier forest’ –relatively undisturbed areas of forest, large enough to maintain all of their biodiversity-remain in Indonesia. Although various sources had estimated the country’s annual deforestation rates between 0.6 million and 1.2 million hectares, a mapping effort carried out with support from the World Bank during 1999 concluded that the average annual deforestation rate since 1986 has increased to about 1.5 million ha, much of it is ‘caused by forest fires, excessive logging, illegal logging, conversion into agricultural land and transmigration sites, shifting cultivations, forest squatters’. Some 29 percent of Sumatra’s and 22 percent of Kalimantan’s forest cover vanished during this period (World Bank Report 1999, p. ). Therefore, the figure delivered by WRI seems to be more valid than earlier estimates. If the current trends continue, virtually all non-swampy lowland forests in Kalimantan and Sumatra will be destroyed by 2010.
As mentioned above, “mis-management of forest” was the main cause of deforestation during the Soeharto regime. There were three factors that played a large part in this high rate of deforestation. Firstly, the behavior of Indonesian politicians and attitudes of decision makers in the Soeharto government, with support from the international system,3 shaping and encouraging various factors that contributed to deforestation. Secondly, a lack of knowledge and inspection among forest apparatus, whether at the central, provincial or district level to implement sustainable forest management. Thirdly, a lack of law enforcement and sanctions against private businesses, whether international or domestic who break forestry industry regulations.
This paper discusses three main issues related to deforestation. Firstly, it discusses definition, area and causes of deforestation by FAO (2000), Myers (1991) and WRI (2000). Secondly, it describes several
3 The role of international finance such as the World Bank, the International
comments on deforestation. Here, my analysis and comment on deforestation is also delivered. Thirdly, the impact of deforestation on environmental condition such as fores fires, water pollution and famines, and species depletion.
Definition
In Food and Agricultural Organization’s (FAO’s, 2000) tropical defines forests as ‘lands more than 0.5 ha, with a tree canopy of more than 10 percent, which are not primarily under agricultural or urban land use’4. This definition includes both natural forests and forest plantations. Based on the consensus recommendation of the Intergovernmental Panel on Forest (IPF) in 1997, the same definition was used for all countries in Forest Resources Assessment (FRA) 2000. In FRA 1980 and FRA 1990, a 10 percent threshold was used for developing countries, but for industrialized countries a threshold of 20 percent was applied. Based on FAO (2000) explanatory notes, ‘forests are determined both by the presence of trees and the absence of other predominant land uses. The trees should be able to reach a minimum height of 5 meters in situ’. Areas under reforestation which have yet to reach a crown density of 10 percent or tree height of 5 meters are included, as temporarily unstocked areas, resulting from human intervention or natural causes, which are expected to regenerate. Meanwhile, Myers (1991) defines ‘tropical forests’ as partly evergreen forests, in areas receiving not les than 100 mm of precipitation in any month for two out of three years, with a mean annual temperature of 24-plus C and essentially frost-free.5
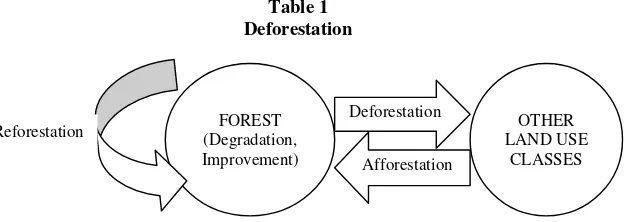
In this overview, ‘deforestation’ has been defined by FAO (2000) as the conversion of forest to another land use or the long-term reduction of tree canopy cover below the 10% threshold’. On the other hand, deforestation implies the long-term of permanent loss of forest cover. Such a loss can only be caused and maintained through a continued man-induced or natural perturbation. Deforestation includes, for example, areas of forest converted to agriculture (including agro forestry), pasture, water reservoirs and urban area (Table 1). Forest degradation and forest improvement occur within forests that continuously stay above the 10% canopy threshold. Reforestation occurs when forests attain re-growth after temporarily having below 10-canopy cover, but were still considered forests throughout that time. Deforestation and afforestation represent the transfer between forest and other land use classes.
4
For further information, regarding ‘definition of forest’, see Basic Definition for FRA (Forest Resources Assessment), 2000.
5 As for definition of ‘tropical forest’, see Myers (1991),
Table 1 Deforestation
Source: Forest Resources Assessment (2000), FAO.
The basic definition by FAO (2000) on ‘deforestation’ has been generally adopted by participating countries and is well known to experts of forest inventories and assessment. International terms and definitions are not static, but follow the general development of international processes. For example, the importance of forests as carbon sinks was not widely discussed several decades ago, yet this issue is now at the top of the international political agenda. On the other hand, forests change (degradation and deforestation) relatively slow, and it is necessary to compare estimates from several decades to establish reliable trends. For this purpose, FRA 2000 has tried to maintain a globally homogeneous set of definitions that allows comparisons with earlier global forest resources assessments.
The WRI (World Resources Institute) defines deforestation as ‘the conversion of forestland into agricultural land use’. This deforestation includes forestland used for infrastructure building, mining, residential use, pasture and shifting cultivation (World Resources, 2000-2001: 275). Meanwhile Myers (1991) defines deforestation as ‘the complete destruction of forest cover through clearing for agriculture of whatever sort’ (cattle ranching, smallholder agriculture whether planned or spontaneous, and large-scale commodity- crop production through, for example, rubber and oil palm plantations). It means that not a tree remains, and the land is given over to non-forest purposes.
It seems that these differences in definition not only affect the measurement of forest resources but also of annual deforestation in respective countries such as Indonesia. It is fair to estimate that Myers’ definition involves less area labeled as tropical forest cover than the FAO/WRI approach. At the same time, data on deforestation can be expected to be upwardly biased through the use of the more extensive definition suggested by Myers (Jepma, 1995: 8). Therefore, deforestation data according to Myers may not only become larger through the definition of deforestation itself, but also due to the fact that deforestation processes
FOREST (Degradation, Improvement)
Deforestation
OTHER LAND USE
CLASSES Afforestation
are related to a smaller area of forest cover to only that defined as tropical forest.
My personal view on three definitions as explained above by Myers (1991), FAO (2000) and by WRI (2000) based on two main levels evaluation. Firstly, I agree what FAO and WRI defined as ‘deforestation’. This definition is more appropriate on deforestation that has occurred in Indonesia in a large and medium scale. Large scale deforestation is caused by the conversion of natural forest to another land use or agricultural farming such as oil palm plantation, rubber, coffee, pepper, paddy rice fields. The Soeharto regime considered oil palm as a lucrative agro industry, so its development was very rapid. For example, in 1980s, 842,700 ha of oil palm was planted, rapidly increased in 1998 to 2,957,079 ha, with a planned total of 5.5 million ha of oil palm plantations by the year 2000 (World Bank, 1999). 46 percent of owners of these plantations were private companies, 40 percent belong to state companies and small holders hold the rest. An example of the rice field conversion is the million-hectare peat-swamp project run in Central Kalimantan. This project was aimed at converting more than 1,457,100 ha of forestland for agricultural purposes in 1995. In the medium term, this area was used for resettlement (local people and isolated communities) and transmigration sites. During the period of the New Order government (1968-1998), transmigration areas in outer islands such as Sumatra, Kalimantan, Sulawesi, Maluku and Irian Jaya have utilized 1.7-2 million hectares forestland, converted into agricultural and resettlement land for over 8 million people.
Secondly, logging holders and timber traders carried out excessive logging in both production and conservation forest and do not tend to carry out long-term replanting programs in forest areas. These actions can certainly motivate indigenous people to use this forestland for shifting cultivation, as has occurred in East Kalimantan, and as coffee and pepper plantations in Bengkulu. This action can also be categorized as ‘deforestation’. Therefore, Myers definition of ‘deforestation’ only refers to the complete destruction of forest cover through clearing for agricultural purposes, without taking into consideration the irreversible destruction of forest cover by both legal and illegal logging practices.
Area of Deforestation
like to compare recent data on tropical forests in terms of forest area and deforestation as provided by WRI, FAO and Myers.6
Both FAO and WRI sources indicate that the annual deforestation rate has relatively increased, but Myers’ (1991) data is still static based on data in 1991.
Table 2
Southeast Asia: Forest Resources and deforestation
Country
Natural Forest 000 ha
Total Forest
Area Change 1990-2000 (total forest)
000 ha % 000 ha/year %
Indonesia 95, 116 104, 986 58.0 - 1,312 - 1.2
Malaysia 17, 543 19, 292 58.7 - 237 - 1.2
Myanmar 33, 598 34, 419 52.3 - 517 - 1.4
Source: Global Forest Resources Assessment 2000: Main Report, FAO, 2001,
p. 174.
Table 2.1
Tropical Forests: Present Status and Deforestation Based on Myers 1991
Country
Original extent of forest cover
(km2)
Present extent of forest cover
(km2)
Present extent of primary forests
(km2)
Annual deforestation
(km2/yr %
Indonesia 1 220 000 860 000 530 000 12 000 (1.4%)
Malaysia 305 000 157 000 84 000 4 800 (3.1%)
Myanmar 500 000 245 000 80 000 8 000 (3.3%)
Source: Myers (1991), Tropical Forests: Present Status and Future Outlook, Climatic Change, Vol. 19, p. 6.
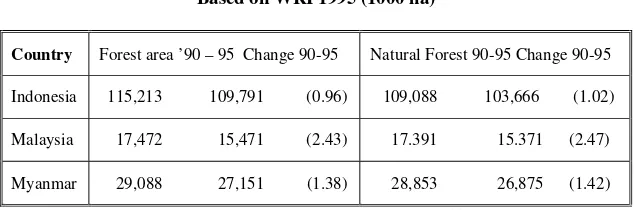
This WRI data is supported by the World Bank (see World Development Indicators, 2000, p. 127). This information shows that ‘average annual deforestation’ 1990-1995 was reached at 10, 844 km2 (1.0 %).
6 The country selection is based on their role in tropical timber production. The
Based on Myers’s explanation (1991), Indonesia is especially important to this survey on forest area and deforestation for the very reason of its high deforestation rate. As a result of the logging boom that began in the mid-1970s, the Transmigration Programme that was underway by the mid-1970s, and the recent expansion of plantation agriculture (especially oil palm, rubber, coffee, pepper, etc.), much forestland has been grossly degraded or destroyed outright (Myers, 1988; Hurst, 1990, World Bank, 1987). Nationswide the total area of remaining forest of any sort can be estimated to have decreased to no more than 1 million km2 and more likely as little as 914, 000 km2 by 1981-1982. Myers refers the World Bank (1988), that during 1980s, it reported an average annual deforestation rate of 9,000 km2/year (by contrast with the Food and Agriculture Organization’s 1988 estimate of 6,000 km2).7 This means that during 1983-1988 a further 54,000 km2 of forest were eliminated. As a result, there were only 860,000 km2 of forest left in 1988.
The estimation of 9,000 km2 destroyed on average each year is now considered to be a low estimation, according to Myers. The World Bank (1988) states that a ‘reasonable’ estimate for the late 1980s could be anywhere from 7000 km2 to 12 000 km2/year. Myers also made a presentation for the of Vice-President and eight cabinet ministers in August 1988 in Jakarta. He said, five of the nine agreed that in light of expanding logging and growing encroachment on forest by slash-and burn cultivators, it could well be corrected for 1988. Moreover the Indonesian development Plan for mid 1989 to mid 1994 (Ministry of Forestry, 1989) presents an estimate of 11 550 km2 of the forest non occurred per year. So a ‘deforestation’ rate of 12 000 km2 /year could be accepted as valid for the position today. It amounts to 1.4% of remaining forests.
Comment on deforestation
It seems that Myers’ opinion (1991) on forest cover and deforestation in Indonesia is speculative methodological base. The weakness of this methodology is based on three categories. Firstly, Myers did not carry out a survey based on accurate method. This survey is a combination of the involvement of team researchers for conducting field research in other tropical countries and in Indonesia. He did not also explore and review the primary sources on deforestation which have been written by many scholars. Secondly, discussion about deforestation measurement techniques, although highly valuable in itself, should not overshadow the main thrust of the problem, namely that irrespective of deforestation assessment approach, all sources clearly point out the
7 Regarding the discussion on average annual ‘deforestation’ resources between
alarming rate of annual deforestation. In this regard, the various sources have made clear that deforestation rates do differ substantially across the various tropical regions. Thirdly, to set of national estimates of forest cover and deforestation is necessary to use the recent technique of ‘remote sensing’ in order to obtain accurate data. It is generally recognized that despite ongoing improvements in remote sensing techniques both with respect to data collecting and interpreting, remotely sensed data still need to be accurately interpreted again. In this case, Myers did not utilize this technique and must be updated data from 1991 into 2000. But, he preferred to personal observation in a tropical country. As his impression on Borneo in the early of 1990s:
‘I remember seeing a tree felled by a commercial logger in a forest of Borneo. It stood, I guessed, about 70 meters tall, with 50 meters of clear bole. A stately specimen. The chainsaw toppled it in ten minutes, or one millionth parts, I reckoned, of the tree’s probable lifespan. Each day, many thousands of such trees are cut in Borneo’.8
On the other hand, the qualitative studies by FRA 2000 were extensively documented in FRA working paper. Deforestation has been a popular research subject in the past decade. A survey of scientific papers (FAO 2000) found over 1, 200 published papers on tropical deforestation since 1980, of which 825 contained findings related to ‘deforestation’ processes and were included in the analysis. For example, in 1980s, as concern about deforestation grew, the number of publications increased-from 8 in 1980 to 41 in 1989 and in 1990 increased between 45 and 60 publications per year. For this purpose, FAO’s team of survey on forestland area and deforestation review many publications in order to make these findings more accurate. In recent decades, the rate of forest conversion has been particularly high in the tropics. FRA (2000) estimated tropical deforestation at 14.2 million hectares per year during 1990-2000, which means that almost 1 percent of tropical forest is being lost per year (in Indonesia 1.2 percent or equivalent with 1, 300,000 ha annually).9 There are two types of qualitative study of forest area change were carried out. First, a review was made of all available documentation within the country, including grey literature; combine with interviews of key informants who are responsible for national inventories and assessments. Second, an intensive survey was carried out of scientific literature (peer reviewed papers published in journals of science) covering aspects of tropical deforestation.
How were these methods utilized by FAO? Several different methods were used to assess the extent of forest and deforestation.
8
For further information, see Myers, Norman (1985) The Primary Source: Tropical Forests and Our Future, London: WW. Norton & Company, Inc, pp. 91.
9 Regarding discussion on forest cover and deforestation based on FAO 2000, see
Apparently, for area statistics, FRA 2000 generated information at three scales country (based on surveys of national inventory and mapping reports), region (FRA 2000 remote sensing survey) and world (FRA 2000 global mapping. For the estimates of area and area change, only country-and regional-level information was used, as the global forest map did not provide sufficient precision. The global-level information was used to derive relation data such as the distribution of forests by ecological zones.
My critical comments on FAO’s survey 2000 method to decide forest cover and deforestation based on two evaluations level. First, there is strength method of FAO implementation in order to obtain accurate data. FAO’s officer combine to integrate researcher teams on conducting interview with key informants and also study of literatures review (books, papers, journals) concerning forest area and forest change processes. In this case, the data show by FAO regarding deforestation and forest land is considered to be more accurate and finally become reference for any person who study forest. Secondly, FAO also carries out ‘mapping’ through remote sensing survey in the level of country, regional and global. Certainly, this method can provide more accurate data regarding deforestation and forestland area.
Table 2.2
Present Status and Deforestation Based on WRI 1995 (1000 ha)
Country Forest area ’90 – 95 Change 90-95 Natural Forest 90-95 Change 90-95 Indonesia 115,213 109,791 (0.96) 109,088 103,666 (1.02) Malaysia 17,472 15,471 (2.43) 17.391 15.371 (2.47) Myanmar 29,088 27,151 (1.38) 28,853 26,875 (1.42) Source: World Resources 2000-2001, UNDP, UNEP, WRI, p. 266.
Causes of Deforestation
Deforestation is a result of natural and human activities. However, the majority of causes related to human development activities that have been increasing during the past three decades. In this study I will deal with deforestation directly or indirectly caused by human activities. The United Nations emphasized the significance of ‘deforestation’, when the organization took the lead in running a global Conference on the Environment and Development (UNCED) held in Rio de Janeiro, Brazil in June 1992. This ‘Earth Summit’, as it was called, coincided with UNEP’s twentieth anniversary (the United Nations Environment Programme). ‘Deforestation’ issues received a high priority in preparatory discussions as well as in the UNCED proposed plan of action, known as Agenda 21. The conference led to the holding of the Kyoto protocol in 1997, with an agenda specifically aimed at ‘Global Warming’ as a major detrimental effect of deforestation and in Johannesburg, South Africa in August 2002, the World Summit on ‘Sustainable Development’.
The term ‘deforestation’ describes the complete, long-term removal of tree cover. In a definition from FAO publication (2000): Tropical countries, ‘the term deforestation refers to the conversion of forest to another land use or the long-term reduction of tree canopy cover below the 10% threshold’. Changes within the forest class (from closed to open forest) which negatively affect the stand or site and, in particular, lower the production capacities are termed forest ‘degradation’. Many activities modifying forests can be accurately described as forest degradation. Apparently, the intensity of human intervention determines the degree of human impact on forest loss.10 Extreme degradation can lead to total forest replacement. In this context we should consider how to utilize forest resources in a sustainable method to prevent serious forest degradation.
Impact on Environmental Issues
As mentioned above, there is a close relationship between forest loss (degradation and deforestation) and the forest management of the Soeharto government with great environmental implications. These implications such as, forest fires, climatic changes, depletion of biological species, floods, droughts, water pollution and more, are causing high casualties in terms of economical, ecological and social damages. Certainly, it is the government’s responsibility to overcome this disaster as the government receives billion of US dollars from the forestry sector.
10 Regarding discussion ‘underlying causes of forest loss in the Asia-Pacific’, see,
The next part of the paper focuses on the discussion concerning the environmental implications from these proximate and root causes of forest loss (degradation and deforestation).
Forest Fires
Why do ‘forest fires’ occur in Indonesia, and what is the management system for forest fires? These critical questions are difficult to answer. This paper will discuss the characteristics of the 1982-1983 and 1997-1998 forest fires and their consequences. Many previous studies (Walhi, 1983; Wirawan, 1984; Brookfield and Byron, 1993, etc.),11 have look at the 1982-1983 forest fires that damaged 3.7 million ha, where the underlying cause was forest miss- management, due to: (1) most forest fires sites were in Forest Logging Concession (HPH) areas (70%), while (20%) were located in shifting cultivation areas and (10%) in primary forests and (2) a lack of inspections and sanctions for the provision of forest fire equipment among logging concession holders by Forestry apparatus, whether at the district or provincial level. In contrast, the 1997-1998 forest fires, which were considered the largest fires, damaging 5 million ha, was caused by “land clearing” performed by plantation holders, especially palm oil plantations in ‘conversion forest’.12 According to Walhi’s investigation, the 1997-1998 forest fires were begun systematically by plantation concession holders. This apparently occurred because of a government agricultural policy concerning palm oil plantation development, where a target expansion of sites was planned from 842,700 in 1980s to 1,310,996 in 12991, 2,957,079 in 1998 and 3,167,697 ha by the year 2001.It was mentioned such as, London Sumatra Company allocated 13,000 ha, in Jampang village, Kutai district, East Kalimantan; Borneo Indo Subur Company 7,028 ha and Karya Agung Company 200 ha in Sepan village, Long Ikis sub-district, Pasir district; Polypan Sejahtera and Kawedar companies in Harapan village, Jelai Hulu district, Ketapang district, West Kalimantan (Tanah Air, No. 5/1998). Ludwig Schindler, a GTZ researcher from Germany, criticized the forest fires in Indonesia. He said that, “The fires in Indonesia are 99% human- caused and mostly
11 For a further discussion on the patters of forest fire in 1982-1983, see, Wirawan,
Nengah (1984), ‘Can We afford to Lose More of the Rain Forest in Kutai? A Survey to the South-West Corner of Kutai National Park’, World Wildlife Fund, Bogor, Java. (Cited in Brookfield and Byron (1993), South-East Asia’s Environmental Future: The Search for Sustainability, Oxford Singapore, 1993, p. 242-258; See also, Tanah Air Journal, No. 5/1998, published by Walhi.
12
deliberately set for a variety of reasons.”13 Indonesia was again unprepared. Only East Kalimantan in 1997 managed to prevent and contain fires by abiding to an early warning system introduced by IFFM/GTZ. However, in the second phase, where a drought that struck East Kalimantan in 1998, the situation became hopeless. A fatal combination of a 10 month draught, economic crisis, and impoverishment drove people to the forests. Ludwig has suggested that the decisions and changes need to occur in order to contain fire problems are: (1) to start solving land tenure problems; (2) to enforce the law (which will only become possible by raising the salaries of public servants; (3) to set the course for a forestry policy that raises the awareness and interest of the general public, media and local communities to protect the forests; (4) to adjust (reduce) the annual allowable cutting of forests, particularly adapting forestry planning after the occurrence of fires; (5) to develop a binding fire management concept for forest logging concession holders (HPH) and (6) to stop conversion of natural forests into plantations.
Forest Fire in 1997
According to PHPH (Directorate General of Forest Protection) the 1997-forest fires destroyed a total of 383, 870 ha (Minister of Environmental report, 1998). Official records are lower than those of other, independent reports. According to Pangestu and Ahmad (1988), based on provincial reports and other independent resources, the total was closer to 627,280 hectares. This report covered on peat moss land (lahan gambut) fire. Meanwhile, Department of Agriculture stated that burned areas on plantation, especially oil palm was 121,626 ha. From that figure, among the largest forest fire areas occurred in Kalimantan 70%, Sumatra 19%, and the rest in Sulawesi, Jawa, Maluku, Nusa Tenggara and Irian Jaya. The burnt areas consisted of 41% peat moss, 26% small and large plantation, 16% national parks and conversation forests, 13% industrial forest plantations (HTI) and production forests and 4% in reforested land (lahan reboisasi). The following table is yet another estimate of the extent of the destruction caused by these fires (Table).
According to European Union Fire Response Group (EUFREG) cooperated with Department of Forestry was referred to August until September 1997, the most largest area of forest fires occurred in South Sumatra (2,2 million ha) and in Kalimantan (1,4 million ha). This report based on spot fires distribution in Eastern Jambi, Riau, Lampung, and East
13
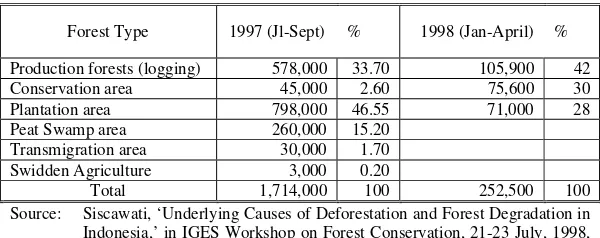
Kalimantan. As already mentioned, the writer prefer to agree that forest fire was 5 million ha, based on rational argument on the various economical and environmental damages. Another resource, Siscawati estimated that forest fire in 1997-1998 reached almost 2 million ha (Table 3).
Table 3
Areas affected by Fire during July-September 1997 And during January-April 1998 (ha)
Forest Type 1997 (Jl-Sept) % 1998 (Jan-April) %
Production forests (logging) 578,000 33.70 105,900 42
Conservation area 45,000 2.60 75,600 30
Plantation area 798,000 46.55 71,000 28
Peat Swamp area 260,000 15.20
Transmigration area 30,000 1.70
Swidden Agriculture 3,000 0.20
Total 1,714,000 100 252,500 100
Source: Siscawati, ‘Underlying Causes of Deforestation and Forest Degradation in Indonesia,’ in IGES Workshop on Forest Conservation, 21-23 July, 1998, pp. 56; See also Bobsien and Hoffmann (1998).
Another source estimated that forest fires, from 1997 to 1998 reached 9.7 million hectares, including areas other than woodlands, were destroyed. In Kalimantan alone 6.5 million hectares were consumed by fire (The Asahi Shimbun, 23 September 2002). Based on his reason, which ‘tropical forests are felled to develop oil palm plantations or plant fast growing trees such as acacias and albazias in accordance with a policy Jakarta has promoted since the 1990s’. He further commented, tropical forests are cut down. The stumps are then burned and the ground is cleared for planting. This operation not only releases vast amounts of ‘smoke’, but there is always the danger of the fire spreading to the neighboring forests or farms.
Rp. 394 billion on medical treatment in 8 provinces, based on a World Bank report in November 1997. However, in terms of long-term health problems and impacts, total financial cost could have reached three times that amount (Rp. 1.2 billion). According to Walhi’s investigation (1998), on five potential forest fires provinces such as South Sumatra, Lampung, East kalimantan, West Kalimantan and Middle Kalimantan, the total loss recorded at Rp. 465 billon.14
What was the effect on economical issues in terms of transportation? The Meteorological and Geophysical Agency (BMG) and Ministry of health were collected for six locations Sumatra and Kalimantan and correlated with meteorological parameters.
Table 4
Airport Out of Activities during Forest Fire in 1997 Provinces Closing Activities (Times)
West Sumatra 39
Riau 32
Jambi 35
South Sumatra 45
West Kalimantan 37
East Kalimantan 65
Middle Kalimantan 31
South Kalimantan 29
Total 313
Source: Department of Transportation, 1998; and see, Laporan Kebakaran Hutan dan Lahan di Indonesia (Forest Fire and Land Report in Indonesia), Vol. 1, Ministry of Environment the Republic of Indonesia and UNDP (United Nations Development Programme, 1998, pp. 60-63.
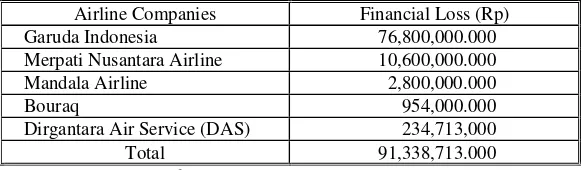
Table 5
Financial Loss on Airline Companies during Forest Fire 1997
Airline Companies Financial Loss (Rp)
Garuda Indonesia 76,800,000.000
Merpati Nusantara Airline 10,600,000.000
Mandala Airline 2,800,000.000
Bouraq 954,000.000
Dirgantara Air Service (DAS) 234,713,000
Total 91,338,713.000
Source: Department of Transportation, 1998.
14 For further information on forest fire cost in five provinces, see,
As Gerhard (1998)15 noted the most affected area by the hazes were central Kalimantan and Jambi, southern East Sumatra, where peak particle concentrations were 4,000 ug/m3. Those locations were downwind from dense, emission intense peat fire clusters in the coastal areas as wind predominantly originated from the south in Kalimantan and the southwest in eastern Sumatra, respectively. Relatively less affected area were East Kalimantan and the eastern and northern part of Sumatra where particle concentration remained below 800ug/m3TPM. Daily mean horizontal visibility during the haze episode was below 1 km within 80 days in Palangkaraya and on 60 days in Jambi. In almost all locations, daily mean visibility was below 3 km for at least 50 days. From this point, for example, in Jambi, Sultan Thoha Airport, daily financial loss occurred between Rp. 30 million up to Rp. 100 million. Therefore, if airport activities closed about 313 days (table), then the total financial loss in minimal Rp. 9,3 billion to Rp. 31,3 billion (Sriwijaya Post, 19 August 1997). As a result, if we combine the case of airplane companies and airport activities the financial loss would range from Rp. 100,78 billion up to 122,69 billion.
The most tragic plane accident due to fire smoke occurred in Sibolangit, North Sumatra in November 1997. Among all passengers, 200 died. One of the victim was identified as the vice General Manager of Riau Andalan Pulp industry (RAPP), under the banner of Raja Garuda Mass company. Ship accidents in the Malaka straits also occurred frequently.
Since April 1997, Indonesia has been involved in a ‘haze confrontation’ with neighboring countries such as Singapore, Malaysia, Brunei, Philippines and Thailand.16 This confrontation was due to the closure of airports and flights cancellation because of the haze. The rich families of Singapore and Malaysia preferred to become temporary refugees in Hongkong and Australia. It was funny, why among Malaysian and Singapore did not require compensation to the Indonesian government? The really is answer, because many oil palm holders belong to them as considered the main actors of fire through “land clearing” in Sumatra, Kalimantan, and Irian Jaya almost 1,2 million ha, which total investment US$ 2,2 billion (Tropis, No. 3, April 2001).
15 For a discussion of the correlation between haze and transportation system, see,
Gerhard Dieterile, “Impacts of Large Scale Forest and Land Fires in Indonesia 1997 on Regional Air Pollution”, in Tropical Forest Fire, Bappenas cooperation with JICA and ITTO, 7-8 December 1998, pp. 138.
16
Water Pollution and Famine
What was the implication of 1982-1983 forest fires on economic, water pollution, and biological species? However, the increase in occurrences of acid rain, floods and other changes in water chemistry, brought about by the ash from fires were apparently the factors that ‘triggered the explosions in population of Aeromonas hydrophila, Staphyloccus sp, and Pseudomonas sp that attacked and caused an epidemic skin infection among the fish population of the Mahakam River’ (Tempo, 4 August 1984). In addition, ‘the disease also attacked and caused serious health problems for the dolphin (Orcaella brevirostrist) unique to the central Mahakam area’ (Wirawan, 1986). ‘Serious floods were also experienced along major rivers in the province. Houses along the tributaries of the Mahakam River, for example, were submerged for several months during the 1983-1984 rainy seasons’ (Wirawan, 1984). A report stated that a bridge along the Bengalon River, just north of the Kutai National Park, was destroyed by flood.
The haze from the forest fires also seriously affected transportation systems. Widodo and Rahman (1984)17 noted that ‘thick smoke covered areas near the source of the fires for more than three months. Many pilots reported that the heavy smog reached up 5,000 meters. These circumstances caused flights to inland areas to be cancelled several times. Balikpapan airport was closed or used only between 2 and 5 p.m, when winds would lift the smog. Similar conditions affected other airports in Kalimantan, as well as impeding traffic at airports farther away, such as Surabaya, Sarawak, Sabah and Singapore. These cancelled flight caused a loss of income in the billions of rupiah by the government, private sectors, and workers in many segments of the industry. In contrast, traveling by land and water also affected. Traveling from Balikpapan to Samarinda, just 97 km away, was very dangerous, not only because of poor visibility but also because flaring fires often jumped across the road. Furthermore, ships had to wait in Samarinda and cancelled to traveling in Mahakam River to upstream such as Kutai, Long Bangun, Muara Pahu, etc. The consequence of this condition, prices of raw materials were increased and difficult to find by local people in hinterland’.
According to Judith Mayer (1989), that’implication of the effects of fire and drought in 1993 for rural populations was serious. Based on her survey in mid-1989 of 12 villages in the burned area north of the Mahakam River suffered their plants and agricultural plantations were damage’ (Paddoch and Peluso, 1996: 190-200). Survey data on crop destruction in
17
1982 and 1983 showed that fire and drought virtually wiped out the 1982 rice crop in 5 of the 12 villages surveyed: by fire in Pelawan, Long Segar, and Muara Danau, and by drought in Long Lees and Melan. Average proportions of 1982 household food crops damaged in other villages ranged between 58 per cent and 88 per cent. Fires and drought also devastated fruit production. Even in the vicinities of Long Bleh and Kalekat, where many fruit trees did not burn, trees failed to produce fruit for two seasons after the fires. Village heads reported that many people consumed their remaining seed grain during the drought, after their 1982 crops burned. Those who were unable to get alternative supply of padi (rice) seed could not plant in 1983-1984 season. The village head of Long Bleh mentioned that 37 families of his village-about one-sixth of the village households-had left the village during the fires to find food and work elsewhere. Apparently, this severe catastrophe invited Kutai District government to organize ‘emergency’ rice distribution twice week 2.5 kg kilogram per household for up to a year to villages in the Mahakam River basin. Almost the greatest part of survey respondents said this emergency food action was very significant to prevent of mass starvation among local people.
Species Depletion
What about the loss of biological resources? The island of Borneo (Kalimantan) has ‘the richest flora, with some 3,000 species of trees, 2,000 species of orchids, and 1,000 species of ferns. Borneo covers less than 0.2 per cent of the earth’s land surface, yet 1 in 25 of all known plants are found here as well as 1 in 25 of all known plants are found here as well as 1 in 20 of all known fauna such as birds and mammals. There are 37 endemic birds (compared to only 20 on Sumatra island) and 44 endemic land mammals (compared to 8 on mammals Sumatra and its offshore islands)’ (Padock &Peluso, 1996: 60)18. Based on a relatively short period of ground and aerial survey in the affected area, Lennertz and Panzer (1984) ‘recognized three classes of damage. Class 1 areas received only drought damage and 10 per cent of canopy trees died; class 2 areas suffered both drought and fire damage and 10-50 per cent canopy trees died; and class 3 areas suffered severe burns, and more than 50 per cent of the canopy trees died’. It was reported that ‘the affected areas covered some 3.5 million hectares, including 800,000 hectares of primary forest, 1,400,000 hectares of logged forest, 750,000 hectares of secondary forest, shifting cultivation and settlements, as well as 550,000 hectares of peat swamps and peat-swamp forest’ (Brookfield and Byron, 1993:247). Further study indicated that the most affected areas had class 2 or 3 damage; Wirawan (1984)
18 For a further information on biodiversity in terms of flora and fauna of Kalimantan
found that ‘the number of dead canopy trees (up to 71 per cent) was found to be the result of drought only’. Wirawan (1985) also reported that after the fire, ‘live remnants of the forests varied from scattered individual trees, through to pockets or stands of a few unburned hectares, to largely undamaged areas several thousand hectares in size’. As an illustration, ‘the fire-affected Kutai National Park, 306,000 hectares wide was found by Pearson (1975)19, to be rich in bird species before the forest fires. Based on a survey in the area, he listed some 300 species belonging to 47 families and sub-families, including 239 species of 33 families and sub-families or 83 per cent of the forest birds of Borneo’. Cokburn and Sumardja (1979) ‘observed 7 species of ungulates (including the Malayan sun bear, leopard cat, binturong, civets, mongooses, weasel and otters), 11 species of primates (including the Orang-Utan, macaques, proboscis and leaf monkeys, Bornean Gibbon, slow Loris and Tearsier) and 25 species of rodents (including the porcupine, mice, rats and 15 species of squirrels)’. However, after the fire, further studies by Wirawan (1985), Leighton and Wirawan (1986), Azuma (1988), Dio (1988), Suzuki (1988)20 indicated that ‘most of the big mammals (except the Sumatran rhinoceros) were still in the area. While smaller animals are more difficult to see and it needed more intensive fieldwork, major concerns were raised on the population status of the various birds and rodents’, as noted by Leighton and Wirawan (1986) in the Menkoto study area. The fire ‘killed 52 per cent of the fruit trees belonging to Meliacecese and Myrtaceae, which were highly preferred by the 6 species of hornbills; 2 of the territorial hornbills were no longer observed in the area during the fieldwork in September 1983 and August 1984’ (Brookfield and Byron, 1993:252). Although, the fire affected half of its 200,000-hectare area, Kutai National Park is still considered to be the only large reserve in the world that contains such as assortment of biological resources.
19
Cited in Brookfield and Byron (1993), For information the various birds in Kutai National Park, see, Pearson, D,L (1975), ‘ A Preliminary survey of the Birds of the Kutai Reserve, Kalimantan Timur, Indonesia’, Research Note No. 2, Treubia, 28, 4: p.151-162.
20 For a discussion in terms of forest fire and biological species, see, Tagawa and
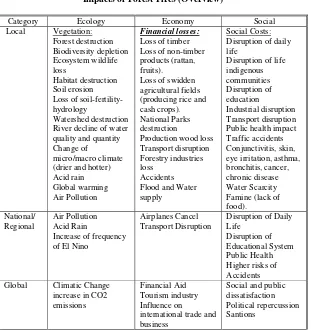
Table 6
Impacts of Forest Fires (Overview)
Category Ecology Economy Social
Local Vegetation:
Source: Siscawati, cf Bobsien and Hoffmann (1998),’Plantation Forest Fires in Indonesia,’ NGOs Forum, May 4-6, 1990, Bonn, Germany.
Concluding Remarks
Underlying factors on ‘deforestation’ are more political and economical factor than proximate causes in Indonesia.
Other actors including international financial institutions such as World Bank, Asian Development Bank, IMF (International Monetary Fund) and importers countries of tropical timber also have contribution to encouraging ‘deforestation’ in Indonesia. For example, concerning their loans, grants upon transmigration projects, oil palm plantation, pulp and paper, dam projects have taken many forestlands conversion into agricultural land and other uses. On the other hand, the excessive logging for seeking lucrative orientation among developing countries, particularly Indonesia in order be able to pay their debts to donor countries such as Japan, United States, European, and several countries, is considered as negative side on forest exploitation.
The consequence of forest (degradation and deforestation) on environmental issues such as forest fires, depletion of biological species, water pollution and famines, climatic changes, and other unexpected consequences, have widely occurred in Indonesia. For example, forest fires in 1997-1998 which caused estimated 5 million ha of damage to forest cover, on top of ecological, economic and social impacts, making them the greatest ‘national disaster’ for Indonesia in recent decades.
REFERENCES Books
Brown, K. and Pearce, D (eds.) (1994). The Causes of Tropical Deforestation, UCL Press, London.
Brookfield and Byron (1993).South-East Asia’s Environmental Future: The Search for Sustainability, Oxford Singapore Press.
Dauvergne, Peter (2001). Loggers and Degradation in the Asia-Pacific: Corporations And Environmental management.United Kingdom: Cambridge University Press.
Hurst, Philip (1990). Rainforest Politics: Ecological Destruction in Southeast-Asia, United Kingdom: Zed Books Ltd.
Jepma, CJ (1995). Tropical Deforestation: A Socio-Economic Approach. London: Earth scan Press.
Kinnon, Mac and Philips, K (1993). A Field Guide to the Birds of Borneo, Sumatra, Java and Bali, London: Oxford University Press.
Myers, Norman (1989). Deforestation Rates in Tropical Forests and their Climatic Implications. London: Friends of the Earth.
Myers, Norman (1985). The Primary Source: Tropical Forests and Our Future. New York: W.W. Norton.
Moll, H.A.J (1987).The Economics of Oil Palm, Netderlands: Pudoc Wageningen Press.
Nusantara, G. Hakim (eds.) (1995). Atas nama Pembangunan: Bank Dunia dan hak Asasi Manusia di Indonesia (On be half of Development: World Bank and Human-Rights in Indonesia, Jakarta: Elsam Press. Park, Chris C (1992). Tropical Rainforests. London: Routledge Press. Palo, Matti and Vanhanen, Heidi . eds. (2000). World Forests From
Deforestation to Transition?. London: Kluwer Academic Publishers.
Potter, Lesley (1996). “Forest Degradation, Deforestation, and Reforestation in Kalimantan: Toward a Sustainable Land Use?” in Padoch Christine and Nancy Lee Peluso, eds. (1993). Borneo in Transition: People, Forests, Conservation, and Development, Kuala Lumpur: Oxford University Press.
Raup, David M (1988). Diversity crises in the geological past. In Biodiversity,E. O. Wilson and Frances M. Peter, eds., pp. 51-57. Washington, D.C.: National Academy Press.
Rietbergen, Simon (eds.) (1993).Tropical Forestry, London: Earthscan Publication Ltd.
Sponsel, Leslie E. Headland, Thomas N. and Bailey, Robert C. eds. (1996).Tropical Deforestation: The Human Dimension New York: Columbia University Press.
Sharma, Narendra P., ed., (1992). Managing the World’s Forests: Looking forBalance Between Conservation and Development (Washington DC: World Bank).
The Third IGES International Workshop on Forest Conservation Strategies for The Asia And Pacific Region, The University of Tokyo, Tokyo, 7-9 September 1999.
UNEP (UN Environment Program) (1996), UNEP’s forest Policy and a Proposed Action Programme for the Period 1996-2000 (Nairobi: UNEP).
Whitmore, T.C. and J.A. Sayer, eds. (1992). Tropical Deforestation and Species Extinction. New York: Chpaman and Hall.
Journal/Newspaper/Report
Barber, Charles Victor & Schweithelm, James (eds.) (2000). Trial By Fire: Forest Fires And Forest Policy in Indonesia’s Era of Crisis and Reform, Washington: World Resource Institute (WRI) Report.
Bobsien and Hoffmann (1998),’Plantation Forest Fires in Indonesia,’ NGOs Forum Paper, 4-6 May 1990, Bon-Germany.
Common, M (1995). Economists don’t read Science. Ecological Economics 15, 101-103.
The Ecologist Vol. 22, No. 4 (July/August 1992).
The Ecologist, Vol. 16, No.2/3, 1986.
FAO (Food and Agriculture Organization) (2000). Global Forest Resources Assessment 2000: Main Report.
Far Eastern Economic Review (FEER), 1 April 1993.
Global Environmental Change, Vol. 1, Number 1, December 1990.
Goldschmidt, E., N. Hildyard, and P. Bunyard, eds. (1987). Save the Forests: Save the Planet-A Plan for action. Ecologist 17 (4/5): 129-204.
Jakarta Post, 12 August, 1995.
Jakarta Post, 27 October 1999.
Jakarta Post, 3 July 1995.
Japan Views Quarterly, Autumn/Winter 1992.
Jurnal Lingkungan Hidup (Journal of Environment), Jakarta: Walhi, Volume 1, 1996.
Kompas, 5 June 1984.
Leahy, Joe, (1999)”Wood-Processing Industry under Scrutiny,” Financial Times, 17 December.
Laporan kebakaran Hutan dan Lahan di Indonesia (Forest Fire and Land in Indonesia) Volume, published by Ministry of Environment Office and United Nations Development Programme (UNDP), Jakarta, 1998.
Myers, Norman, ‘Tropical Forests: Present Status and Future Outlook,’ in Climatic Change, Vol. 19, September 1991.
Pacific Affairs, 1993-1994, Vol. 66, No. 4, pp. 516.
Peluso, (1995),’Whose Woods Are These? Counter Mapping Forest Territories in Kalimantan, Indonesia, in Antipode 27, No. 4, pp. 403.
Peluso, Nancy Lee (1993), ‘The Political Ecology of Extraction and Extractive Reserves in East Kalimantan, Indonesia,’ in Development and Change, Vol. 23, No. 4, October, pp. 50.
Repetto, R (1990). Deforestation in the tropics. Scientific American 262 (4): 36-42.
Repetto, R (1986) “Soil Loss and Population Pressure on Java,” Ambio (Sweden), Vol. 15, No. 1.
SKEPHI: A Call for International Solidarity on Indonesian Tropical Forest Issue, No. 10 (January-June 1993, No. 11 (July-September) 1993.
Secrett, Charles (1986). “The Environmental Impact of Transmigration,” The Ecologist, Vol. 16. No. 2/3.
Statistic of Reformation Program, Report Paper in Directorate General of Reforestation And Rehabilitation Land, in Department of Forestry.
Turner, B.L (et al.) ‘Two types of Global Environmental Change,’ in Global Environmental Change, Vol. 1, Number 1, December, 1990.
Tanah Air Jurnal (Journal of Mother Land), Walhi, No. 5/1998, No. 1, 1996.
Thompson, Herb (1999). “Social Forestry: An Analysis of Indonesian Forestry Policy,” Journal of Contemporary Asia 29 (May): 187-201.
Walhi (1995).’Kembalikan Dana Pelestarian Hutan’ (Sustainable Forest Fund Have to returned). Report paper.
Walton, Thomas and Derek Holmes (2000). “Indonesia’s Forests Are Vanishing Faster Than Ever,” International Herald Tribune, 25 January.
World Bank report (1999) on ‘Oil Palm’ Plantation in many Provinces in Indonesia’.