Media Trend
Berkala Kajian Ekonomi dan Studi Pembangunanhttp://journal.trunojoyo.ac.id/mediatrend
Understanding The Asean-5 Tourism Sector Based On Australia
Out-bound Tourism
Petrus Jerry Pardomuan1*, Dias Satria2
A B S T R A C T
Informasi Artikel
Many studies have been conducted with the aim at investigating the relationship between the tourism performance and macroeconomic variables. However, only few studies investigated the regional tourism performance based on a specific origin country. This study investigated the relationship between ASEAN-5 international tourism receipts as the dependent variable and macroeconomic variables as the independent variables namely the exchange rates to Australian Dollar, Australia GDP per capita, international tourism expenditure, and transportation costs. The method used to investigate this study is panel data regression model to determine the influence among the explanatory variables to the dependent variable. The results denote that the exchange rates, GDP per capita, and the transportation cost are significant to the tourism receipts. Meanwhile, the international tourism expenditure variable shows an insignificant result to the tourism receipts.
Sejarah artikel:
Diterima Februari 2018 Disetujui Februari 2018 Dipublikasikan Maret 2018
Keywords: Tourism Economics, Tourism Receipts, Exchange Rate, GDP per Capita, International Tourism Ex-penditure,
Transportation Cost, Panel Data Regression.
© 2018 MediaTrend
Penulis korespondensi:E-mail: [email protected]
DOI: http://dx.doi.org/10.21107/mediatrend.v13i1.3594
Introduction
In the era of modern economics, most countries around the world cannot rely only on exploiting their natural resources to boost the economics. The world is be-ing shifted to the era of creative economy
where people must find creative ways to earn an income. The first terms of creative
economy was invented by Howkins in 2001 (Cited in Kyung Sung 2015). He stated that a creative economy is the situation where the businesses promote creativity, knowledge convergence, and advance
scientific technology based on structured
learning to invent new markets and new jobs. Furthermore, the presence of unpre-dicted economic challenges around the world has forced many nations and so-cial activists to adapt in new ways which include promoting the creative economy (Flew, 2012). For instance, the most ba-sic economic problem is the scarcity when human have unlimited needs but they are constrained by the limited resources.
Due to the world’s problem of
re-source scarcity, hence countries must find
another sector as an alternative sector to maintain their national income. One of the sectors that can be expanded as an in-come for a country is the tourism sector. According to World Tourism Organisation (WTO), the sector of tourism has experi-enced gradually growth to be the fastest growing sector in the world. The Word Travel and Tourism council estimate that tourism sector assist 9.2 percent of global GDP and forecast that this growth will con-tinue to grow at over 4 percent per annum during the next ten years to be around 9.4 per cent of GDP (Cited in Dwyer & Spurr 2011). According to Satria (2011), the
de-mand of an efficient economy affects a
high need for innovation and tourism is one of the sectors that can be developed to
full-fill this demand.
According to the data published by ASEAN (2015) revealed that the tourism arrivals in the selected countries
from Southeast Asia region, respectively Indonesia, Malaysia, Singapore, Thailand, and Philippines gradually increased and some were relatively stagnant from 2010 to 2014. For instance, Indonesia had ad-ditional 400,000 arrivals in average per an-num. This annual additional average per-formed higher compared to what Malaysia had even though its annual tourist arrival number was bigger. The highest incremen-tal arrivals were from Thailand in which by December 2013 they recorded 4 million in-creasing in their arrivals which made them the most top perform tourism sector during that year with more than 26 million tourists both local and foreign.
Australia outbound tourism has
possessed a superb form for the last five
years. Data published by Visa (2015) ex-plained that Australia is among the top
five spenders in 2015 along with Saudi
Arabia, Egypt, China, and Brazil with median spending for travelling reached $3603 for each trip. This number was not even a surprise because the results in 2012 showed that 8.2 million residents left Australia borders. This meant 31 out of 100 Australian residents travelling overseas (Australia Post 2016). Furthermore, the data in Australia Post (2016) revealed that based on the top 10 of Australia destina-tions, four of ASEAN countries were men-tioned, namely Indonesia with 11.1% (2nd), Thailand visited by 7.6% of total Australia citizens in 2012 (4th), Singapore with 3.7%(8th), and Malaysia with 3.2% of total Australia outbound tourisms (9th). In addi-tion, the similar data was published by the Australia Bureau Statistics (2012). More-over, according to Australia Post (2016), there are several reasons why Australians go for travelling. It was said that 57 percent of the people travelled abroad for holiday, while 23 percent travelled to visit friends and family, lastly following with 10 percent on business purposes.
sec-tor performance, the author of this study has certain gap between this study and the previous studies. This research will focus on the tourism receipts, while some previous studies used tourism arrivals in
a specific country. Moreover, this study
will concentrate on the regional tourism performance based on the tourism re-ceipts within the ASEAN-5 region, namely Indonesia, Malaysia, Singapore, Thailand, and Philippine while in contrast most of the previous studies focused on one destina-tion country to numerous origin countries.
Furthermore, this research put the influ -ence of transportation cost in term of jet fuel consumption to determine the rela-tionship between dependent and
indepen-dent variables. In addition, tried to figure
out whether the Australian citizens are attracted to travel to the Southeast Asia regions not only through the relationship of exchange rates between the Australian dollar and the ASEAN-5 currencies but also the income of the Australian. Besides, this study also addressed to determine
which variable is the most influential to the
regional tourism performance in ASEAN-5 and even though this research is a repli-cation of the previously conducted studies, this research has divers gap mentioned before as some new evidence of the es-sential of the tourism performance to the economy of a country.
Literature Review
In this paper, the author found several references related to the topic discussed. Before the term of creative economy existed in public, Uysal and John L. Crompton (1984) analysed the determi-nants of demand for international tourist
flows of Turkey. This research used per
capita income from origin countries, rela-tive price, exchange rate, transportation cost, and promotional expenditure. There were eleven foreign countries from 1960 to 1980 observed as the target generating countries namely Austria, Canada, France,
Greece, Italy, Spain, Switzerland, FR Germany, UK, USA, and Yugoslavia. The results show that all the variables
mea-sured are significant to the Turkey inter
-national tourist flow. However, in the ex -change rate variable, even though most of the origin countries shows the positive role
in stimulating international tourist flows of
Turkey, Italy showed the only exception with a negative sign. Further, the promo-tional expenditure variable only shows a positive role on the demand for interna-tional tourism for six countries not for all eleven countries observed.
At the beginning of 21st centu-ry, two researchers, Lindsay Turner and Stephen Witt (2001) analysed the similar
research as Muzaffer and John (1984)
conducted based on New Zealand case.
This paper aimed to examine tourist flows
divided into holidays, business travel and visit to friends and relatives (VFR) for each origin country-destination country to dis-cover whether the various demand had a
difference impact depending upon the pur -pose of visit consideration. The method used was the Structural Equation Modelling (SEM) with time series analysis, while the data observed were taken from the tourist
flows over the four origin countries to New
Zealand from 1978 to 1997. The explana-tory variables were origin country popula-tion, origin country personal disposable income, and the cost of living in destina-tion country adjusted by the exchange rate between two countries. The additional vari-ables observed were the presence of
air-fare cost and the influence of international
trade between New Zealand and the tar-get countries, respectively Australia, USA, Japan, and the UK.
The empirical results showed that international trade plays the major part in
influencing business tourism demand, re
study has shown that international trade (in the form of trade openness) is the major determinant of business tourism demand, and that new private car registrations, re-tail sales and domestic loans are also
important influences in term of the trade
between two countries.
Tourism Research Australia in 2011
investigated the factors affecting inbound tourism in Australia with the specific focus
on the roles, impacts and implications of the Australian dollar. The study continued to put income as one of the key determinants of decision by tourists to travel in addition to exchange rate. The empirical results of the study revealed that in the short-run, in-come is responsible for the strongest cau-sality in relation to tourism demand. In par-ticular, one percent additional in in-bound source market incomes caused tourism demand increase of 0.8%. In the long-run term, the causality was even found to be stronger. The study also explained that exchange rate volatility had an impact on Australia’s inbound tourism. In addition, there was nonlinear relationship between the strength of the Australian dollar and the demand for inbound tourism. The apprecia-tion of the Australian dollar against the cur-rencies of the source markets for inbound tourists entails that tourists have either to spend more on their tourism budgets or reduce the number of days of the visits.
Moreover, Shuhada and Ismail (2012) conducted a research about the demand factors of international tourism in Malaysia. This work covered data spanning from 2002 to 2010 with tourism receipts in Malaysia as the dependent variable and the independent variables observed were personal disposable income for the des-tination country, personal disposable in-come for origin countries, relative price in term of CPI, exchange rates, population from origin countries, and the distance between Malaysia and the origin countries. The results showed that all the variables
were significant to the model.
The different research was con -ducted by Emmanuel, et al. (2013) as the inbound tourism target. The explanatory variables used were the domestic tourism per capita and international tourism per
capita while the difference is the method
used. The author used the Johannsen Cointegration approach in addition. The
final results showed the exact conclusion
like the previous research where all the
explanatory variables were significant and
can explain the model.
Glauco (2014) conducted research entitled “The Long-run Impact of Exchange Rate Regimes on International Tourism Flows”. The explanatory variables used were the trade between the source and the destination countries, the GDP per capita for both origin and destination countries, population of origin and destination coun-tries, the real exchange rate volatility, the distance between two countries and the
effective real relative prices. In addition,
there were some dummy variables such as whether the source and destination coun-tries shared the same language, the exis-tence of free trade agreement between two countries, the colonial relationship, and the exchange rata regimes, whether both ori-gin and destination countries were
mem-bers of the same currency at specific time, the fixed exchange rate, or whether one
country was in a currency union and the
other floated its currency. The empirical re
-sults showed although the short-run effects
were beyond the scope of this investiga-tion, this model works for across three
clas-sifications of the exchange rate regimes in
the long-run. Further, the results showed that the trade variable had a positive
corre-lation to the tourism flows. Suggesting this will promote inbound tourist flows and the
GDP per capita and the population of the source countries were found have a larger
impact on tourism flows compared to the
In the same year, Jana (2014) in her study “The Determinants of Interna-tional Tourism Demand” analysed the
fac-tors influencing the tourism in Czech Re -public from 2000 to 2012. The independent variables used were personal income for source country, the relative price in term of CPI of origin and destination coun-tries, the exchange rates, trade openness, population from origin countries, promotion expenditure, and the dummy variables in term of peak season and the political con-dition of the destination countries. In addi-tion, this research used the lagged of the
dependent variable to analyse the effect of
word-of-mouth (WOM) and repeated visit as a result of habit formation. The method approach was the Arellano-Bond GMM. The results showed that income, trade
openness, and the WOM effect showed the
positive correlated to the model whereas the relative price and the dummy variable were found to be negatively correlated.
In 2015, Richard, in his study “Macroeconomics Determinant of Tourism Sector Performance in Malawi” explain the
macroeconomics factor that influenced Malawi tourism industry that affects eco -nomic growth. Both short-run and long-run impacts were covered in the Malawi case. This research used four independent vari-ables namely, the exchange rate, the level of investment in Malawi, and the income per capita of origin countries. Besides, this research covered the dummy variable in term of political and economic stability in Malawi’s neighbouring states. Therefore, the dummy variable measured in term of political instability. The results show that in the explanatory variables were able to ex-plain the model in the long-run, but in the short-run, the author concluded that there is another factor that explain the model outside the variables investigated in his study. Further, the political and economic instability could be the only factor that might lead to tourists to postpone or even withhold their decision to visit Malawi and
choose another destination in the short-run.
Jewoo & Choong-Ki Lee (2016) in their study analysed the role of ism price in attracting international tour-ist for Japan based on South Korea out-bound tourists. They developed six models
among the first three models there was no
living cost included, but they managed to put that variable in the last three models. The dependent variable was the number of South Korean tourists divided by its
population. The first model used exchange
rates, real price in term of CPI, GDP per capita of Korean tourists, and several dum-my variables measured. The results of this research showed that all six models ex-plained more than 70% percent in Korean
tourist arrivals to Japan. However, the first
three model which treated relative price and exchange rate separately appeared to
provide a better fit model. Further, the re -sults appeared to show that the removal of the transportation cost variable did not
sig-nificantly change the explained variance
in Japanese inbound tourism for South Korea.
In the same year, Peter and Ronald (2016) analysed the economics of tourism growth for small island countries based on the impact of changes in foreign in-come tourism source countries on the growth of tourism dependent small island economies. The variables used were the elasticity of demand of tourism goods and services, the competition among hotel, and services and income elasticity of foreign income of countries tourist source. This
research was under assumption a fixed
capture other important aspects such as the role of land property laws, spatial land planning, capital controls, tax policies and public infrastructure.
Method
The research type used in this re-search is the explanatory rere-search with the quantitative method. This method methodi-cally examines the relationship between dependent and independent variables by regressing them with mathematical equation. Indeed, this type of approach requires a high organized measurement process because it describes the rela-tionship between observed phenomenon and the results of regression explained by mathematical model.
In this research, the author uses one dependent variable and several inde-pendent variables. The deinde-pendent variable
(Y) is a variable influenced by the indepen -dent variables whereas indepen-dent
vari-ables (X) are expected to affect the depen -dent variable. This research encompassed
five countries in Southeast Asia, namely
Indonesia, Malaysia, Singapore, Thailand, Philippines. Those countries were the limited variables used in this research. Fur-ther, the data are taken from 1999-2014.
These countries are chosen due to the high performance in their tourism sector in Southeast Asia compared to the other Southeast Asia countries.
This research will provide a regres-sion from panel data based on panel data corrected standard error (PCSE) model. The equation for this model is :
TOURCPit= β0 + β1EXCijt +β2GDPPERCAPjt + β3EXPit + β4JETFCONjt + εit
Where TOURCP= Tourism Re-ceipts ASEAN-5 Countries, β0= Constant, β1, β2 ,β3, β4 & β5= Coefficients regression, ε= Error or disturbance, i= country destina-tion, t= country of origin, EXC= ASEAN-5 Countries exchange rates to Australian Dollar, GDPPERCAP= Australia GDP Per Capita, EXP= International tourism ex-penditure for destination countries, JETF-CON= transportation cost which is the jet fuel consumption.
Finding and Discussion
The Results of Panel Data Regression With Panel Corrected Standard Error (PCSE)
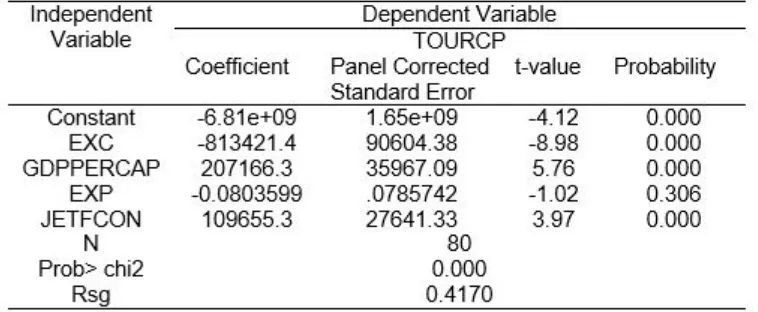
Tabel 1.
Panel Data Regression With Panel Corrected Standard Error (PCSE)
The value of EXC (ASEAN-5 Ex-change Rates to AUD) indicates a negative
but statistically significant to the interna -tional tourism receipts. The negative sign is in line with Uysal and John L. Crompton (1984) while the exchange rates are
sig-nificant but negatively affects the tourism
performance. In addition, the exchange rates play an important role to attract the international tourists. This pictures the
de-gree of confidence of the citizens of origin
countries to the destination countries. For
example, the citizen of Australia figure out
that their currency has a strong rate to the desired destination country and hence they will decide to travel and make a visit to that destination country. In contrast, if the cur-rency of a destination country seems to be higher compared to the origin countries, it may cancel the travelling decision to make a visit. Furthermore, the exchange rates are able to determine the living cost within the destination country. If the destination country’s currency keeps appreciating to the origin, it indicates that the living cost spent for travel will be higher than it used to be and vice versa. To sum up, these are the explanation of how exchange rates af-fect the the tourism receipts based on its demand for international tourists (Chumni, 2001).
The interpretation of GDPPERCAP which represents the term of Australian
in-come is both significant and have a posi -tive mark. Jana (2014) study in the tourism performance in Turkey showed a similar
result while the inbound tourism is affected by the fluctuation of origin countries’ in -comes. This fact is based on the degree of people who are willing to spend their income for travelling purposes. This re-search used the Australian GDP percapita to determine the Australian preference on spending to travel to ASEAN-5 tourisms. For instance, when a huge increase oc-cured in the Australia GDP percapita in
2011, the tourism receipts of Indonesia ex-perienced a linear outcome by increasing their tourism receipts approximately 2 bil-lion US$ in the same year. The similar re-sults took place for all ASEAN-5 members where all of their receipts from tourism went up as a results of a moderate incline in the Australian income. These results are consistent to the statement from Vanegas and Croes (2000) that premised that the more the real income increases, the more the people are likely to travel and tourists expenditure is a positie function of income
The other significant variable is the
transportation cost in which is represented by the value of Jet fuel consumption. Fur-ther, a positive sign showed indicates that a possible increase in jet fuel consumption of an origin country in barrel would lead to an increase of the destination countries’ tourism receipts based on a fact that jet fuel consumption in barrel has counted the price of the oil itself
The only insignificant variable is the
International Tourism Expenditure (EXP) which provides a negative sign and insig-nifcant value. The possible interpretation is the ASEAN-5 countries expenditures on international tourism in term of
promo-tion and developing are not effective yet
to boost the international tourism receipts in their country. The case of ASEAN-5 similarly corresponds to the case in Turkey
(Muzaffer and Crompton, 1984) when the
promotional expenditure was likely to have positive impact on the international tourism sector in Turkey. Furthermore, this may in-dicate that the destination country should not spend a high amount budget for pro-moting expenditure and instead should develop more tourist destinations. Satria (2009) suggested that encouraging the lo-cal people surrounding the tourism desti-nations will be more essesential and more
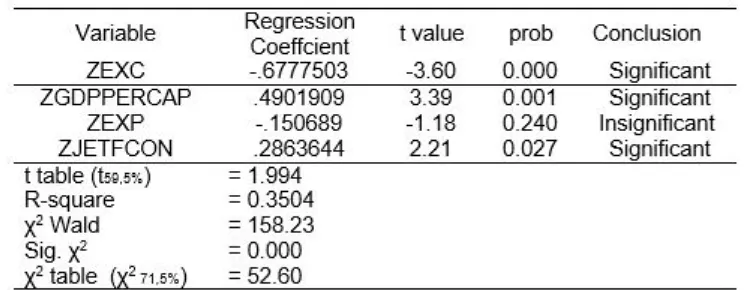
Standardized Coefficient Test
Standardized coefficient regres -sion test is useful to determine the robust relationship between the dependent and independent variables. To decide which
independent variable is the most influ -ence to the international tourism receipts is by looking at the value of the regression
coefficient. Based on the table above, the
variables name are changed with an addi-tional word ‘Z’ after thet were standardized (after their own value has been eliminat-ed). Futhermore, it shows that the highest value after the variables have been stan-dardized are the exchange rates with the value of 0.677503 with a negative sign.
The second most influence is the GDP per
capita following by the jet fuel consumption and the international tourism expenditure.
Conclusion
After regressing and analyzing the tourism receipts in ASEAN-5 countries based on the Australia outbond tourisms from 1999 to 2014, there are several conclusions drawn:
The purpose of this research is
to analyse the factors that influence the
tourism sector in form of the tourism receipts in the ASEAN-5 countries. This includes
the effect of the exchange rates to AUD,
Australia GDP per capita, the international tourism expenditure, and the jet fuel con-sumption on tourism receipts and the level
of the influence of these variables on
tourism receipts.
Only three explanatory variables namely the ASEAN-5 exchange rates to Australian dollar, Australia GDP per capita, and jet fuel consumption are statistically
significant to the ASEAN-5 tourism re -ceipts even though the exchange rates show a negative mark. This fact denotes that if there is an increase in exchange rates to AUD (appreciation), the tourism receipts will decrease and vice versa when the currencies of ASEAN-5 countries de-preciate to AUD, it will by chance increase the tourism receipts. Conversely, when the Australia GDP per capita and the jet fuel
consumption increase, it will affect to an in -cline of the tourism receipts. This indicates a positive impact from tourism income in ASEAN-5 countries.
Among all variables, only the inter-national tourism expenditure is not
statisti-cally significant and has a negative sign to
the model. This indicates that tourism ex-penditure should be minimised due to
inef-ficiency in generating income from tourism
receipts. The decreasing rate in the model indicates that there is a decrease in tourism receipts when an increase occurs in the tourism expenditure.
As tourism becomes more es-sential as an income for a country, this sector must be developed especially for ASEAN-5 country member in order to at-Table 2.
tract the Australian tourists. It is necessary for all parties to collaborate to develop the tourism sector in ASEAN- countries. With Thailand which possessed the highest tourism receipts in the given year, the rest of ASEAN-5 countries should be able to compete in the development and promo-tion for the tourism sector.
The most influence factor to the in -ternational tourism receipts of the ASEAN-5 countries is the exchange rates with the negative relationship. Thus the presence of a stable exchange rate currency is es-sential.
The government should maintain the exchange rates to the origin country, to prevent extreme appreciation or depre-ciation in order to be able to attract the in-ternational tourists because it represents whether the inbound tourism in a region will be chosen by an outbond tourists from their origin country.
The government is suggested to make policies to minimize the cost for en-rolling travelling visa or tax holiday, so peo-ple from other countries will be interested to visit ASEAN. Consequently, there will be an increase in the tourism sector.
The government should conduct
a promotion efficiently thus in the follow -ing year, so the expenditure for tourism will positively impact to the international tourism sector.
For Indonesia, it is prominent to add more tourism objects instead of Bali to attract the international tourists. With an intense promotion with Australia and improve the infrastructure available, it will be possible for Indonesia to be the highest country in ASEAN with the biggest international tourism receipts.
Bibliography
Ajija, Shochrul R. 2011. Cara Cerdas
Menguasai Eviews. Selemba Empat,
Jakarta.
Andergassen, R. and Candela G. 2009.‘Less
Developed Countries, Tourism Investments and Local Economic Development’, Working Paper No. 676, Department of Economics, University of Bologna.
Arikunto, Suharsimi. 2006. Prosedur Pene-litian Suatu Pendekatan Praktik. Edisi Revisi VI. Cetakan Ketigabelas. PT. Rineka Cipta. Jakarta.
ASEAN (2015) Tourism Statistics, ASEAN. org, viewed 11 September 2016. <http:// www.asean.org/storage/2015/11/tour-ism/Table_28.pdf >
Australia Bureau of Statistic 2012, Interna-tional Movements 2012, cat. no. 3401.0, viewed 3 November 2016. <http://www. abs.gov.au/Ausstats/[email protected]/0/D6F5 1C99013EF448CA257B26000BC1F6 ?OpenDocument >
Bailey, D. And Katz, Jonathan N. 2011.
Implementing Panel-Corrected Stan-dard Error in R : The PCSE Package, California Institue of Technology, pp.1-10
Balaguer, J. and Cantavella-Jorda M. 2002. ‘Tourism as a long-run economic growth factor: The Spanish case’, Applied Economics, vol. 34, pp. 877–884.
Baltagi, Badi. 2004. Econometric Analysis of Panel Data, John Wiley & Sons, Ltd.
Blanchard,O & Johnson, D .2015, Macroeco-nomics, 6th edn , Pearson, New York
Boshoff, Willem. 2012. ’Gasoline, Diesel Fuel
and Jet Fuel Demand in South Africa’,
Journal for Studies in Economics and Econometrics, vol.36, p.1-5
Chumni, Maeta. 2001. ‘Tourism Demand Model: Determinants of Thailand’s Interational Tourism Receipts’, Mas-ter Thesis , Faculty of Economics Chulalongkom University Thailand.
to Australia: A Regression Analysis’,
Tourism Management Journal, Vol. 13, pp.196-208.
Dwryer, L, Forsyth P. 2006. International Handbook on the Economics of Tourism , Cheltenham. p.71.
Dwyer, L., & Spurr, R. 2011. Tourism eco-nomics summary. QLD 4222 Australia: STCRC Centre for Economics and
Policy, Gold Coast Campus, Griffith
University.
Edgell, D.L, 1990. International Tourism
Policy. New York: Van Nostrand
Re-inhold.
Flew, T. 2012, The Creative Industries: Culture and Policy. Sage Pub : London.
Ghozali. 2001. Aplikasi Analisis Multivariate Dengan Program SPSS (Edisi Kedua). Semarang: Universitas Diponegoro.
Greenway-McGrevy,Han Chirok, & Sul Donggyu. 2012. ‘Standardization and Estmation of the Number of Factors for Panel Data’, Journal of Economic Theory and Econometrics, vol.23(2), pp.79-88
Gudono. 2011. Analisis Data Multivariat, Edisi Pertama, Universitas Gadjah Mada Yogyakarta.
Gupta, D. 1990. The Economics of Political
Instability: The Effect of Political Insta -bility on Economic Growth. New York: Praeger.
Hall, C. M. 1996. Tourism and Politics: Policy, Power and Place. England: John Wiley & Son Ltd.
Havi, Emmanuel D.K and Enu, M. Phil Patrick. 2013. ‘The Impact of Tourism Economics Performance In Ghana’,
European Scientific Journal, vol.9, pp.242-257.
Helpman, E. and Krugman, P.R. 1985.
Market Structure and Foreign Trade: Increasing Returns, Imperfect
Competi-tion, and the International Economy, Cambridge: MIT Press.
IMF. 1993. Balance of Payment Manual, 5th edition, Washington DC.
International Tourism Report 2013. The Geography of Transport System, viewed 28 October 2016. <https:// people.hofstra.edu/geotrans/eng/ ch7en/appl7en/ch7a3en.html >
Jones,Gavin. 2013. The Population of Southeast Asia. Global Asia Institute. National University of Singapore. Pp. 3
Judge, George. G, E. William, Hill R. Carter, Lutkepohl Helmut. 1985. The Theory and Practice of Econometrics, Paper-back, International Edition.
Kim,J.,&Lee,C.K, 2016, ‘Role of tourism price in attracting international tourists : The case of Japanese inbound tourism from South Korea’, Journal of Destination Marketing & Manage-ment <http://dx.doi.org/10.1016/j. jdmm.2016.03.002i >
Kosnan, Siti Shuhada & Ismail, Normaz Wana. 2012. ‘Demand Factors For International Tourism In Malaysia’,
Prosiding PERKEM VII Jilid 1, pp. 44-50
Krueger, A.O. 1980. ‘Trade Policy as an Input to Development’, American Economic Review, 70(2): pp. 288-292.
Kulendran, N. and Dwyer L. 2009. ‘Measuring the Return from Australian Tourism Marketing Expenditure’, Journal of Marketing, Vol. 47, pp. 275-284.
Kyung Sung,Tae. 2015. ‘The Creative Economy in Global Competition’,
Technological Forecasting and
So-cial Change Journal, Department of
MIS,Kyonggi University, Suwon, South Korea, 23 April 2015 , pp.89-91.
Ledesma-Rodriguez, F. J., Navarro-Ibanez, M. and Perez-Rodriguez, J. V. 2001. ‘Panel Data and Tourism: A Case Study of Tenerife’, Tourism Economics Jour-nal, Vol. 7, pp. 75-88.
Matias, A., Nijkamp, P. and Neto, P. (eds) 2007. Advances in Modern Tourism Research: Economic Perspectives,
Heidleberg: Physica-Verlag. <http:// books.google.co.uk/books?id=eEncjd qnKZsC&pg=PA9&dq=Advances+in+ Modern+Tourism+Research:+Econom ic+Perspectives&hl=en&ei=lvWoS9mI BMiOjAf8usnYAQ&sa=X&oi=book_re sult&ct=result&resnum=1&ved=0CDc Q6AEwAA#v=onepage&q=&f=false >
Minciu R., Baron P., Neacsu N. - Economia Turismului - curs litografiat, Universi
-tatea Independentă Dimitrie Cantemir
- Facultatea de Management Turistic si Hotelier, Bucuresti, 1991 si 1993.
O’Connor,J. 2009. ‘Creative Industries : A new direction?’, International Journal of Cultural Policy, vol.54, no.4, pp. 387-402.
O’Sullivan, V. and C. M. Hall. 1996. Tourism, Political instability and violence.” In A. Pizam and Y. Mansfeld (eds.) Tourism, Crime and International Security Issues . London: John Wiley & Sons Ltd.
Rodrigue, Jean-Paul. 2013. The Geography
of Transport System, 3rd edn, New
York: Routlegde.
Samimi, A.J., Sadeghi, S., and Sadeghi, S. 2011. ‘Tourism and Economic Growth in Developing Countries: P-VAR Approach’, Middle-East Journal of
Scientific Research, vol.10, pp.28-32. Satria, Dias, and Prameswari, Ayu. 2011. Strategi Pengembangan Industri Kreatif Untuk Meningkatkan Daya Saing Pelaku Ekonomi Lokal, Jurnal Aplikasi Manaje-men, vol.9(1), pp.301-308. Available at : <http://www.jurnaljam.ub.ac.id/index.
php/jam/article/view/296>
Satria, Dias. 2012. Strategi Pengembangan Ekowisata Berbasis Ekonomi Lokal Dalam Rangka Program Pengentasan Kemiskinan Di Wilayah Kabupaten Malang, Journal of Indonesian Applied Economics, vol.3, pp.37-47, Available at: <http://jiae.ub.ac.id/index.php/jiae/ article/view/136>. Date accessed: 09 Des. 2016.
Selvanathan, S., Selvanathan, E.A. and Viswanathan, B. 2012. ‘Causality between Foreign Direct Investment and Tourism: Empirical Evidence from India’, Tourism Analysis, vol.17(1), pp.91-98.
Sinclair, M.T. and Stabler, M. 2002. The Eco-nomics of Tourism, London: Routledge.
Sonmez, S. F. 1998. ‘Tourism, Terrorism, and Political Instability’, Annals of Tourism Research, vol.25(2), pp.416- 456.
Stauvermann, Peter Joseph and Kumar, Ronald Ravinesh. 2016. “Economics of Tourism & Growth For Small Island Countries”, Journal of Tourism Manage-ment, vol.55, pp.272-275.
Theocharous, A. L and H R. Seddighi. 2000.
Political Instability and Tourism: A Cross- Cultural Examination, pp.48-51.
Tourism Research Australia, 2011. Factors
affecting the in-bound tourism sector-
the impact and implications of the Aus-tralian Dollar, Canberra: Department of Resources, Energy and Tourism.
Tourism Research Australia 2014. National Survey Results For The Year Ending September 2000 to September 2013,
viewed 9 September 2016,
United Nations, 2013 . Creative Economy Report in 2013. United Nations, Geneva and New York
United Nations Population Division, 2010.
World Population Prospects : the 2010 Revision, New York, United Nations.
UNWTO, 2012. Methodological Notes to the Tourism Statistics Database available at: <http://dtxtq4w60xqpw.cloudfront. net/sites/all/_les/docpdf/2012noteseng. pdf>
UNWTO, 2015. Tourism Highlights, available at: <http://www.e-unwto.org/doi/ pdf/10.18111/9789284416899>
Uysal,Muzaffer and Crompton, John L.
1984.‘Determinants of Demand for International Tourism Flows to Turkey’,
Tourism Management Journal , pp.288-297.
Turner, Lindsay W., Witt, Stephen F.
2001.‘Factors Influencing Demand of
International Tourism: Tourism Demand Analysis Using Structural Equation Modelling, Revisited’, Journal of Tour-ism Economics, vol.7, pp.21-38.
Vanegas, M and Croes, R.R. 2000. Evalua-tion of Demand, US Tourists to Aruba,
Annals of Tourism Research, vol.27, pp.946-963.
Vanhove, N., 2005. The Economics of Tour-ism Destinations, Business & Econom-ics , Taylor & Francis, 251 pages
Vencovska, Jana .2014. ‘The Determinants of International Tourism Demand’, bachelor thesis, Charles University in Prague.
Vicini,Valery. 2005. General Guideline for the Development of Foreign Direct Investment Indicators on the Tourism Sector, World Tourism Organisation, Department of Statistic and Economic Measurement, Madrid.
Vita, Glauco De .2014. ‘The Long-Run Im-pact of Exchange Rates Regimes on International Tourism Flows’ , Tourism
Management Journal , vol.45, pp.
226-233
Visa 2015, Visa Global Travel Intentions Study 2015, viewed 3 November 2016. <http://www.visamiddleeast.com/ae/ enae/aboutvisa/research/travelinten-tions.shtml >
Webber,K. 2001. Outdoor adventure tourism : A review of research approaches. An-nals of Tourism Research, vol. 28(2), 360–377.
Zhang, H., Chong, K. and Ap, J.1999. ‘An analysis of tourism policy development in modern China’, Tourism Manage-ment, vol.20, pp.471-485.