Summary Needle dimensions, needle surface area, needle dry weight per area (LWA) and needle density (ND, needle weight per volume) were measured in terminal current-year shoots in a natural canopy of variably sized Picea abies (L.) Karst. trees growing along a light gradient. Needle shape was described as a rhomboid. Needle width (D2) increased with increasing diffuse site factor, ad (relative amount of penetrating diffuse solar radiation), whereas needle thickness (D1) re-mained nearly constant, resulting in an inverse relationship between D1/D2 and ad and an increase in the ratio of total (TLA) to projected needle surface area (PLA) with increasing ad. Because of the variations in needle morphology with respect to light availability, the shoot parameters used in present can-opy models are also expected to be light-sensitive, and studies involving shoot morphology should also consider the variabil-ity in needle geometry. Needle dimensions and total tree height were not correlated. However, LWA increased with both in-creasing ad and total tree height. When LWA was expressed as the product of ND and needle height (NH, height of the rhomboidal transverse section of a needle), LWA appeared to increase with irradiance, because of changing NH, and with total tree height, because of changing needle density. Keywords: conifers, leaf area estimation, leaf area index, leaf density, leaf morphology, leaf thickness, leaf weight per area, Norway spruce, tree dimensions.
Introduction
Estimates of leaf area index (LAIp, projected leaf surface area per ground area) are often used to derive total leaf surface area index (LAIt). With broad-leaved species, a simple conversion factor of two is employed to calculate LAIt from LAIp, because leaf surface area is not influenced significantly by leaf thick-ness. However, in coniferous species with needle-shaped leaves, total needle surface area is a function of needle thick-ness (Witkowski and Lamont 1991). To further complicate matters, environmental factors also affect needle morphology (Tucker and Emmingham 1977, Greis and Kellomäki 1981, Jordan and Smith 1993). Consequently, estimates of the
sur-face area of assimilative organs of coniferous species are not possible without considering the developmental responses of needle morphology to local microclimate conditions.
Recent models of conifer photosynthesis examining the influence of shoot structure on photosynthetic production (e.g., Oker-Blom 1985, Wang and Jarvis 1993) are based on the assumption that needle structure is constant throughout the tree. However, Jordan and Smith (1993) have shown that variation in needle geometry can result in variation in photo-synthetic rates as a result of changes in the surface area for interception of light. Thus, estimates of light interception by shoots may be improved if the environmental factors responsi-ble for variation in needle structure are identified, and needle geometry is characterized.
Although qualitative differences in foliage properties with respect to long-term changes in light availability have been examined in broad-leaved species (e.g., Lichtenthaler 1985), little is known about how spatial variation in needle morphol-ogy is related to canopy light gradients. In general, rates of physiological processes are higher in trees in sunny than in shady habitats, especially when calculated on a foliage area basis (Björkman 1981), because sun trees access more solar energy, which speeds up light-dependent metabolic reactions, and foliar structure is adapted to the prevailing light conditions so that the capacity for light utilization is dependent on the growth radiation regime (Prioul and Bourdu 1973, Björkman 1981). Because leaf dry weight per area (LWA) increases linearly (Gulmon and Chu 1981, Jurik 1986, Oren et al. 1986, ermák 1989, Kull and Niinemets 1993) and its reciprocal, specific leaf area (SLA), decreases hyperbolically (Drew and Ferrell 1977, Tucker and Emmingham 1977, Del Rio and Berg 1979, Kellomäki and Oker-Blom 1981, Koppel and Frey 1984, van Hees and Bartelink 1993) with irradiance during leaf growth, they are frequently used to characterize effects of light on leaf structure. Moreover, there is often a strong positive correlation between LWA and leaf photosynthetic capacity (light-saturated photosynthesis) per area (Björkman 1981, Ju-rik 1986, Oren et al. 1986), which has been interpreted as evidence that plant resources are invested where photosyn-thetic returns are highest (Gutschick and Wiegel 1988). Thus,
Effects of light availability and tree size on the architecture of
assimilative surface in the canopy of Picea abies: variation in needle
morphology
ÜLO NIINEMETS
1,2and OLEVI KULL
11 Institute of Ecology, Estonian Academy of Sciences, 40 Lai Str., EE 2400 Tartu, Estonia
2 Present address: LS Pflanzenökologie, BITÖK, Universität Bayreuth, Postfach 10 12 51, 95448 Bayreuth, Germany
Received July 10, 1994
variation in LWA with light is adaptive. However, in addition to variation with irradiance, LWA correlates with plant age and dimensions (Hager and Sterba 1985, Linder 1985, Chazdon 1986, Steele et al. 1989, Leuning et al. 1991, Kull and Niine-mets 1993), leaf aging and development (Del Rio and Berg 1979, Hager and Sterba 1985, Oren et al. 1986, Wang et al. 1990), season (Lewandowska and Jarvis 1977, Smith et al. 1981, Reich et al. 1991), water availability (Rascio et al. 1990), altitude (Körner et al. 1986), and nutrient availability (Araki 1971, Dijkstra 1990, Witkowski and Lamont 1991). In an attempt to partition the variation in LWA between different environmental factors, Witkowski and Lamont (1991) defined LWA as the product of leaf density (dry weight per volume) and thickness (LWA = density × thickness). Although the factors affecting LWA may influence each of these variables, density and thickness often respond independently (Witkowski and Lamont 1991). Consequently, partitioning the variation in LWA between its components can be more useful than the examination of LWA--environment relationships only. To un-derstand better the dependence of LWA and other needle char-acteristics on environmental factors, we examined needle morphology in relation to light climate and total tree height in a Picea abies (L.) Karst. canopy.
Material and methods
The study was performed in the nemoral spruce forest at Voore Ecological Station, Estonia (58°44′ N, 26°45′ E, elevation 90 m above sea level), at the beginning of August 1989. The forest is located on a plateau-like crest of a drumlin with brown pseudopodzolic soil. A detailed description of the study site is given by Frey (1977).
Current-year shoots at terminal positions were taken from the southern aspect of six trees with variable exposure. Total height of sampled trees ranged from 1.60 to 35.5 m, whereas tree age was estimated to range from 8 to 105 years. Every sample consisted of four to seven shoots. To ensure sampling along the vertical light gradient, shoots were collected at three to five different canopy heights per tree. Sample and total tree heights were also measured. The highest relative sampling height (sampling height per total tree height) per tree ranged from 0.78 to 0.96. Means were calculated for all parameters from all sampled shoots per sampling location.
Relative irradiances in the sampling locations were esti-mated by a hemispherical (‘‘fish-eye’’) photographic technique (Anderson 1964) as modified by Nilson and Ross (1979). Several photographs were taken per sampling location, and from every photograph, the proportion of canopy gaps was measured with respect to zenith angle. The diffuse site factor, ad (relative amount of penetrating diffuse solar radiation), was calculated as the mean for all photographs from a sampling location: ad = 1.0 corresponds to the diffuse irradiance above the stand, and ad = 0.0 to complete shade with no canopy gaps. Estimated this way, ad provides comparable estimates to other light sensors, especially if long-term variation in irradiance is of interest (Salminen et al. 1983). Because the sampling loca-tions were always on the southern aspect, no correction for
differences in direct solar radiation associated with sample compass direction was necessary.
Total tree height, a second independent variable, was hy-pothesized to cause changes in foliage structure as a result of changes in tree water balance and stronger gradients of envi-ronmental factors in the crowns of taller trees.
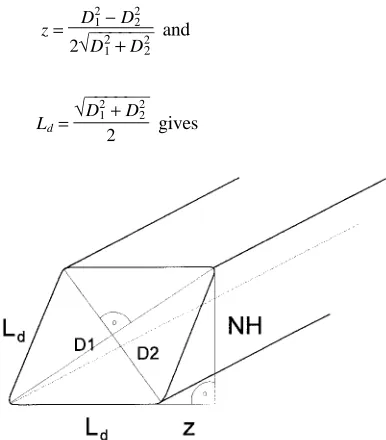
Ten needles from the central part of a shoot were randomly taken for the measurement of total needle area (TLA) (Frey 1981, Steele et al. 1989). Needle thickness (D1), width (D2) in the center of each needle, and needle length (Ln) were meas-ured with a micrometer, and the total surface area was calcu-lated by the formula of Ivanov (Gulidova 1959, Figure 1):
TLA = 2Ln√D12+D22. (1)
Equation 1 describes the needle shape as a rhomboid. The variables D1 and D2 are given in anatomical terms, i.e., upper and lower surface, and accordingly, thickness and width of a leaf are determined by the disposition of leaf xylem and phloem. In P. abies, needle thickness (1.15--1.5 mm) is usually larger and less variable than needle width (0.4--1.5 mm) (Aussenac 1973, Frey 1981), and the needles are oriented in space so that the mean angle between the largest projections and the horizon is less for D1 than for D2. Therefore, needle thickness and width, defined in this way, are homologous to leaf width and thickness of broad-leaved species, respectively. One measure of projected needle surface area (PLA) was calculated as:
PLA1= Ln(Ld+ z), (2)
where Ld is needle side length, and Ld + z is equal to projected D1 (Figure 1). Assuming D1 > D2, and substituting
z = D1
2− D2
2
2√D12+ D22 and
Ld=
√ D1
2+ D2
2
2 gives
Figure 1. Geometrical model of a needle: D1 = needle thickness, D2 =
needle anatomical width, Ld = side length, NH = needle height, and
PLA1= Ln
D1 2
√D12+ D22
. (3)
Another measure for PLA was calculated as:
PLA2 = Ln D1. (4)
The value of PLA2 is always larger than the value of PLA1. The geometric estimate, PLA1, was considered to be closer to the PLA in the natural needle position on a shoot and was therefore used in our study (except as noted). Nevertheless, no qualita-tive differences in relationships occurred when Equation 4 was used instead of Equation 3. Steele et al. (1989) found that measurements made with a photoelectric planimeter signifi-cantly underestimated PLA in Picea sitchensis (Bong.) Carr. when compared to a geometric model. Accordingly, we ex-pected PLA, measured directly by a video device or photoelec-tric planimeter, for needles spread on a flat surface to be in between the geometric estimates PLA2 and PLA1, because needles are often curved or twisted in shape. Furthermore, as D2 or D1 change, probabilities for arranging the needles on D1 or on projected D1 and consequently, measuring PLA in the direction of Ld + z or D1 also change. To test this assumption, calculations based on Equations 3 and 4 were compared to estimates of PLA measured with a video areameter (DIAS, Delta-T Devices, Cambridge, U.K.) that was previously cali-brated as described by Diebolt and Mudge (1988). On average, Equation 3 underestimated projected needle area (PLAm) by 9.5%, and Equation 4 overestimated PLAm by 13% (Figure 2), indicating that PLA measurements were sensitive to the vari-ability in needle morphology.
Needle volume (V) was calculated as:
V = Ln
D1 D2 2
.
(5)
Needle weight (Mn) was determined after oven-drying the
needles at 85 °C for 48 h, and needle dry weight per TLA and PLA1 (LWAt and LWAp, respectively), and needle density (ND) were calculated. Because LWAt is the product of leaf density and thickness (Witkowski and Lamont 1991), or for P. abies, of ND and needle height (NH, projection of needle width, Figure 1), it can be computed as:
LWA t = Mn TLA =ND
V TLA
,
where (6)
V
TLA=
D1 D2
4√D12+ D 2 2 =
NH 4 .
(7)
Often, shoot structure is characterized by the ratio of shoot silhouette area to total needle surface area (STAR), where shoot silhouette area is defined as the total shadow cast by a shoot when the radiation beam is perpendicular to the shoot axis (e.g., Boyce 1993). Assuming that all needles lie in the same plane, side by side, then the possible maximum value, STARcal, can be calculated when needle number per shoot (N), shoot length (Ls), needle thickness (D1), PLA and TLA are known:
STARcal= PLA2 TLA× SF ,
(8)
where SF is a factor accounting for possible space limitations due to the variation in needle number per shoot length. If D1N/(2Ls) > 1, there are more needles per shoot than can be accommodated according to the definition of STARcal, result-ing in needle overlap and shadresult-ing between needles, and SF = D1N/(2Ls). However, if D1N/(2Ls) ≤ 1, all needles can theoreti-cally be placed in the same plane, side by side, and SF = 1. The variable PLA2 is used because the maximum value of STARcal is of interest.
Linear correlation and regression techniques were used to analyze the data. Statistical relationships were considered sig-nificant if P < 0.05. All abbreviations and respective units are listed in Appendix 1.
Results
Total tree height and ad were not correlated (P > 0.2). Relative sampling height (Rh) was significantly correlated with light availability (P < 0.001), and ad decreased nonlinearly with decreasing Rh. Total tree height and Rh were not significantly related. Thus, the effects of total tree height and ad on needle structure could be studied independently.
Needle dimensions and surface area
Needle thickness was not significantly related to irradiance (Figure 3A). In contrast, needle width increased significantly with ad (P < 0.00001, Figure 3B). As a result, D1/D2 decreased (Figure 3C) and TLA/PLA increased (Figure 3D) linearly as irradiance increased (P < 0.00001).
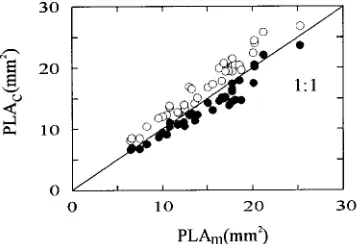
Figure 2. Comparison between projected needle surface area measured by a video areameter, PLAm (mm2), and PLAc (mm2) calculated from
measured needle parameters using Equations 3 (PLA1, d) and 4
(PLA2, s): PLAm = 1.02PLA1 + 1.00 (r2 = 0.934, P < 0.001, n = 36), and PLAm = 0.89PLA2 − 0.38 (r2 = 0.958, P < 0.001, n = 36). For both
There was a tendency for PLA1/PLAm (Figure 2) to decrease with D1/D2 (PLA1/PLAm = 1.34 − 0.19D1/D2, r2 = 0.315, P < 0.001, n = 36), and PLA2/PLAm to increase with D1/D2 (PLA2/PLAm = 0.76 + 0.08D1/D2, r2 = 0.127, P < 0.05, n = 36). Consequently, with respect to measured PLA, underestimation of PLA1 increased with decreasing D1/D2 (higher ad), and overestimation of PLA2 increased at higher D1/D2 values (lower ad) compared with measurements made with a video areameter.
Total and projected needle surface areas (TLA and PLA) and needle length were not significantly related to irradiance. No correlations were found between total tree height and meas-ured needle dimensions. There was a tendency for needle length to increase with total tree height, but this was not significant at P < 0.05.
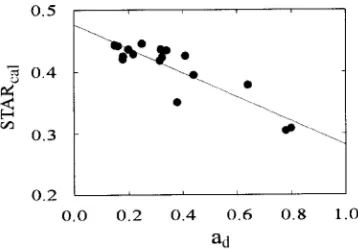
The ratio of computed shoot silhouette area to total needle surface area (STARcal) decreased significantly with increasing ad (Figure 4). Tree height did not influence STARcal.The quan-tity D1N/(2Ls) (Equation 8) increased with increasing light and tree height (r2 = 0.748, P < 0.0001).
Needle weight per area, volume, density and height
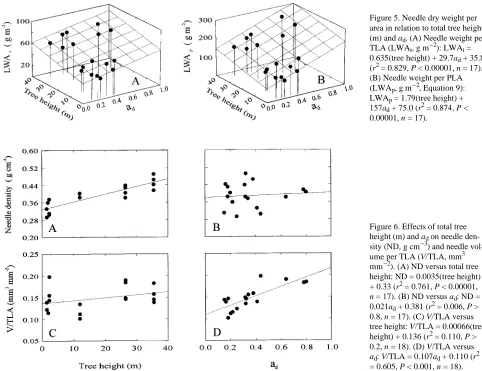
Needle volume and surface area of needle transverse sections (0.5D1 × D2) were significantly correlated with ad (r2 = 0.272 and 0.315, respectively, P < 0.05). Needle dry weight per total surface area (LWAt) and per projected surface area (LWAp) increased with increasing ad and tree height (P < 0.00001, Figures 5A and 5B). The value of LWAp, equal to
LWA p=LWA t
TLA PLA
,
(9)
was more strongly related to ad than LWAt as a result of the relationship between TLA/PLA and ad.
Variation in LWA with increasing total tree height and ad was examined in more detail by considering the components of LWA, needle density and needle height (Equations 6 and 7). Needle density increased with total tree height (P < 0.00001, Figure 6A) but was not correlated with ad (Figure 6B). The ratio of needle volume to TLA (Equation 7) was linearly related to ad (P < 0.00001, Figure 6D), but it was independent of total tree height (Figure 6C). Both LWAt and LWAp were correlated positively with NH and ND. Thus, the dependence of LWA on ad can be attributed to changes in needle height, whereas increases in LWA with total tree height can be attrib-uted to increasing needle density. The correlation between needle height and density was not significant (r2 = 0.009, P > 0.95).
Discussion
Needle dimensions and surface area
Because of the complex nature of needle geometry in P. abies (e.g., Kerner et al. 1977), needle morphology was only ap-proximated by a rhomboid. Frey (1981) evaluated many geo-metrical formulas for P. abies and found that the rhomboidal model (Equation 1) gave the most reliable estimates of TLA
Figure 3. Effects of relative irradi-ance (ad) on needle dimensions
and surface area. (A) Needle thickness (D1, mm) versus ad: D1
= 0.17ad + 1.06 (r2 = 0.085, P >
0.2, n = 18). (B) Needle anatomi-cal width (D2, mm) versus ad: D2
= 0.68ad + 0.46 (r2 = 0.730, P <
0.00001, n = 18). (C) D1/D2
ver-sus ad: D1/D2 = −1.11ad + 2.05 (r2
= 0.829, P < 0.00001, n = 18). (D) Total leaf area to projected leaf area ratio (TLA/PLA) versus
ad: TLA/PLA = 2.40 + 1.06ad (r2
= 0.719, P < 0.00001, n = 18).
Figure 4. Calculated (Equation 8) shoot silhouette area to total needle surface area ratio (STARcal) versus ad. The value of STARcal combines
the changes in projected to total leaf area ratio and needle number per unit shoot length. STARcal = −0.174ad + 0.456 (r2 = 0.529, P < 0.001,
over a wide range of D1/D2 ratios. However, compared to TLA calculated as the product of needle perimeter and length, Ivanov’s formula (Equation 1) underestimated TLA by a factor of 0.94 in Picea rubens Sarg. (Boyce 1993) and 0.92--0.95 in P. abies (Frey 1981), because the real needle perimeter was longer than that predicted from the rhomboidal model. Never-theless, precise estimation of TLA was not critical for the qualitative relationships presented here, because the error due to underestimated TLA was less than the variation due to total tree height and ad. Moreover, because PLA, measured for detached needles laid out on a flat surface varies systematically with changing D1/D2, estimation of projected area based on a geometrical model may be more explicit.
There is, at least up to a certain age, a strong relationship between height and age of woody plants, thus tree height could serve as an estimate of tree age. Although needle parameters, except for needle weight per area and needle density, were not dependent on total tree height, many needle morphological traits correlate with tree age, e.g., SLA, D1, TLA and Mn in P. sitchensis (Steele 1984, Steele et al. 1989) and Pinus radiata D. Don (M. Steele, personal communication). Variation in needle morphology with age in P. sitchensis was nonlinear, whereas needle structure changed more rapidly in younger
plants (1 to 10 years old) than in older plants (over 10 years old). Large spatial extensions and the long life spans of trees make it difficult to study the effects of light availability and tree age on foliage structure independently in the same stand, but with grafted conifer scions placed in approximately the same irradiance, variations in several needle parameters, e.g., Ln and Mn in Pinus taeda L. (Greenwood 1984), and Ln in Larix laricina (Du Roi) K. Koch (Greenwood et al. 1989), were related only to scion age. Thus, our a priori assumption that variation in total tree height and associated changes in water relations are the mechanistic reason for variation in needle parameters with tree age may not be fully justified.
Leverenz and Jarvis (1980) reported that sun needles of P. sitchensis had greater D1 and PLA than shade needles. No relationships between ad and needle surface area (PLA and TLA) or D1 were found in our study, whereas D2 was signifi-cantly correlated with ad. Because pronounced gradients of light and needle development exist within a conifer shoot, the morphological parameters vary considerably (Frey 1981, Frey and Ivask 1983, Chandler and Dale 1990, Brewer et al. 1992, Powell 1992), and 10 randomly taken needles per shoot may not be sufficient to detect all structural differences caused by the light environment. However, Brewer et al. (1992) reported
Figure 6. Effects of total tree height (m) and ad on needle
den-sity (ND, g cm−3) and needle vol-ume per TLA (V/TLA, mm3 mm−2). (A) ND versus total tree height: ND = 0.0035(tree height) + 0.33 (r2 = 0.761, P < 0.00001,
n = 17). (B) ND versus ad: ND =
0.021ad + 0.381 (r2 = 0.006, P >
0.8, n = 17). (C) V/TLA versus tree height: V/TLA = 0.00066(tree height) + 0.136 (r2 = 0.110, P > 0.2, n = 18). (D) V/TLA versus
ad: V/TLA = 0.107ad + 0.110 (r2
= 0.605, P < 0.001, n = 18). Figure 5. Needle dry weight per area in relation to total tree height (m) and ad. (A) Needle weight per
TLA (LWAt, g m−2): LWAt =
0.635(tree height) + 29.7ad + 35.8
(r2 = 0.829, P < 0.00001, n = 17). (B) Needle weight per PLA (LWAp, g m−2, Equation 9):
LWAp = 1.79(tree height) +
157ad + 75.0 (r2 = 0.874, P <
that, in Abies fraseri (Pursh) Poir., D1 and D2 were relatively constant at different positions within the shoot. Furthermore, Powell (1992) found that in Tsuga canadensis (L.) Carr., several structural parameters of needles were related to shoot length, which characterizes shoot vigor rather than light avail-ability. Accordingly, one might conclude that several modifi-cations in needle morphology may in fact be unrelated to irradiance.
Koch (1976) reported that D2/D1 is dependent on irradiance, and a quasi-linear relationship between D1/D2 and relative irradiance, as was found in our study, has been found pre-viously in P. abies (Aussenac 1973, Greis and Kellomäki 1981). Similarly, Jordan and Smith (1993) reported that needle thickness was significantly lower in shade leaves than in sun leaves of Abies lasiocarpa (Hook.) Nutt., and the ratio of needle thickness to width was greater for sun needles, corre-sponding to our results (Figures 3B and 3C) (cf. Material and methods). Recalculation of the data reported by Aussenac (1973) for Abies nordmanniana (Steven) Spach. and Pseudot-suga menziesii (Mirb.) Franco resulted in a similar relation-ship. A constant value for TLA/PLA has been used to calculate TLA or PLA in conifers when only one of them is measured. Values reported include 2.429 for Abies balsamea (L.) Mill. (Boyce 1993), 2.26 for Abies concolor (Gord.) Lindl. ex Hildebr., 2.41 for Abies magnifica A. Murr. (Westman 1987), 2.57 for Pinus sylvestris L. (Roberts et al. 1982), 2.714 for P. rubens (Boyce 1993), and 2.5 (Oren et al. 1986), 2.6 (Zim-mermann 1990), 2.61 (Münster-Swendsen 1987) and 2.74 (Riederer et al. 1988) for P. abies. However, because of the relationship between D1/D2 and irradiance, the ratio of total to projected needle area also changes with light conditions in the canopy. Consequently, TLA may be substantially underesti-mated in the upper canopy and overestiunderesti-mated in the lower canopy when calculated based on a constant ratio of TLA/PLA. Furthermore, changing patterns of TLA/PLA with irradiance implies that the shoot silhouette area to total needle area ratio (STAR), a parameter often used exclusively to char-acterize shoot structure, is likely to vary with needle morphol-ogy and ad (Figure 4). However, changes in STAR, resulting from changing PLA/TLA of needles, can be influenced by variation in the distribution of needles on a shoot (Niinemets and Kull, unpublished results), e.g., increases in D1N/(2Ls) with increasing ad results in decreasing STARcal with increas-ing ad even if TLA/PLA is constant.
There are methodological problems associated with the use of different quantities in calculating physiological parameters (Verduin 1959, Charles-Edwards and Ludwig 1975, Öquist et al. 1982, ermák 1989, Smith et al. 1991, Jordan and Smith 1993). For example, photosynthetic capacity per needle dry weight is equal to (photosynthetic capacity per needle area)/LWA. The value of LWAp contains variations both in TLA/PLA and LWAt (Equation 9). Additionally, the rates of physiological processes based on different denominators, e.g., PLA, TLA, V and Mn, are not readily comparable when respec-tive irradiances are not known. Moreover, when different spe-cies are compared, interspecific differences in needle mor-phology versus light relationships may need to be considered.
Needle weight per area, volume, density and height
The independent components of LWAt, needle height and needle density, showed qualitatively different behavior with respect to total tree height and irradiance. An increase in needle height (projected needle width, D2) with ad is comparable to an increase in leaf thickness with light in broad-leaved species, thus characterizing the effect of light on cell size and division (Jackson 1967, Nobel 1977, Nobel and Hartsock 1981, Malkina 1983, Nygren and Kellomäki 1983). Because of the dependence of needle height on light, other parameters, e.g., V and the area of a needle transverse section (Figures 3B and 6D), were also correlated with ad. Similarly, in Picea schren-kiana Fisch. et C.A. Mey., needles from the southern aspect (higher irradiance) had more and larger mesophyll cells, result-ing in a significantly higher needle transverse section area (Baidavletova 1984), than those from the northern aspect (lower irradiance). Frey (1981) reported that sun needles of P. abies have six to eight layers of mesophyll cells and shade needles two to three layers in the direction of needle width (D2), whereas for D1, the number of cell layers was similar (seven to nine). Thus, the increase in needle height and V/TLA with increasing irradiance could be attributed to a change in needle width (D2). In an ecological context, enhanced leaf thickness may be advantageous, resulting in an increase in leaf mesophyll area per surface area and consequently, increasing the diffusive conductance of the mesophyll to CO2 (Nobel 1977). Moreover, greater light absorptance, due to increasing path length, is expected in thick leaves compared to thin leaves (Öquist et al. 1982).
(Hellkvist et al. 1974). These gradients may be sufficiently large to cause differences in needle morphology.
Acknowledgments
Dr. Ron J. Ryel (Dept. Range Science, Utah State University, USA) and Prof. Dr. John D. Tenhunen (LS Pflanzenökologie, BITÖK, Uni-versität Bayreuth, Germany) are gratefully acknowledged for their invaluable comments on earlier drafts of this manuscript.
References
Anderson, M.C. 1964. Studies of the woodland light climate. I. The photographic computation of light conditions. J. Ecol. 52:27--41. Araki, M. 1971. The studies on the specific leaf area of forest trees. I.
The effects of RLI, season, density and fertilization on the specific leaf area of larch (Larix leptolepis Gord.) leaves. J. Jpn. For. Soc. 53:359--367.
Aussenac, G. 1973. Effets de conditions microclimatiques différentes sur la morphologie et la structure anatomique des aiguilles de quelques résineux. Ann. Sci. For. 30:375--392.
Baidavletova, S. 1984. Some comparative data on needle structure in
Picea schrenkiana in different climatic regions. In
Strukturno-funktsionalnyye osobennosti nekotoryh komponentov lesnyh eko-sistem Priissykkulya. Ed. R.R. Krinitskaya. Ilim, Frunze, pp 22--36 (in Russian).
Björkman, O. 1981. Responses to different quantum flux densities. In Physiological Plant Ecology, Vol. I. Eds. O.L. Lange, P.S. Nobel, C.B. Osmond and H. Ziegler. Encyclopedia of Plant Physiology, Vol. 12A. Springer-Verlag, Berlin, Heidelberg, New York, pp 57--107.
Boyce, R.L. 1993. A comparison of red spruce and balsam fir shoot structures. Tree Physiol. 12:217--230.
Brewer, J.F., L.E. Hinesley and L.K. Snelling. 1992. Foliage attributes for current-year shoots of Fraser fir. HortScience 27:920--925. Chandler, J.W. and J.E. Dale. 1990. Needle growth in Sitka spruce
(Picea sitchensis): effects of nutrient deficiency and needle position within shoots. Tree Physiol. 6:41--56.
Charles-Edwards, D.A. and L.J. Ludwig. 1975. The basis of expres-sion of leaf photosynthetic activities. In Environmental and Bio-logical Control of Photosynthesis. Ed. R. Marcelle. Dr. W. Junk Publishers, The Hague, pp 37--44.
Chazdon, R.L. 1986. The costs of leaf support in understory palms: economy versus safety. Am. Nat. 127:9--30.
ermák, J. 1989. Solar equivalent leaf area: an efficient biometrical parameter of individual leaves, trees and stands. Tree Physiol. 5:269--289.
Del Rio, E. and A. Berg. 1979. Specific leaf area of Douglas-fir reproduction as affected by light and needle age. For. Sci. 25:183--186.
Diebolt, K.S. and K.W. Mudge. 1988. Use of a video-imaging system for estimating leaf surface area of Pinus sylvestris seedlings. Can. J. For. Res. 18:377--380.
Dijkstra, P. 1990. Cause and effect of differences in specific leaf area.
In Causes and Consequences of Variation in Growth Rate and
Productivity of Higher Plants. Eds. H. Lambers, M.L. Cambridge, H. Konings and T.L. Pons. SPB Academic Publishing, The Hague, pp 125--140.
Drew, A.P. and W.K. Ferrell. 1977. Morphological acclimation to light intensity in Douglas-fir seedlings. Can. J. Bot. 55:2033--2042. Frey, J.M. 1981. Ecomorphological analysis of the spruce needle and
spruce stand. Cand. Biol. Dissertation, Tartuskii Gosudarstvennyi Universitet, 160 p (in Russian).
Frey, J.M. and M.M. Ivask. 1983. Morphological variability and cal-oricity of Picea abies needles along an annual twig. Lesovedeniye. 0(4):63--67.
Frey, T. 1977. IBP Research at the Vooremaa forest ecology station. In Spruce Forest Ecosystem Structure and Ecology, Vol. 1. Introduc-tory Data on the Estonian Vooremaa Project. Ed. T. Frey. Estonian IBP Report 11, Academy of Sciences of the Estonian S.S.R., Esto-nian Republican Committee for IBP, Tartu, pp 21--36.
Greenwood, M.S. 1984. Phase change in loblolly pine: shoot develop-ment as a function of age. Physiol. Plant. 61:518--522.
Greenwood, M.S., C.A. Hopper and K.W. Hutchison. 1989. Matura-tion in larch. I. Effect of age on shoot growth, foliar characteristics, and DNA methylation. Plant Physiol. 90:406--412.
Greis, I. and S. Kellomäki. 1981. Crown structure and stem growth of Norway spruce undergrowth under varying shading. Silva Fenn. 40:86--93.
Gulidova, I.V. 1959. Estimation of the needle surface area in spruce. Soobshts. Instituta lesa AN SSSR 11:49--50 (in Russian). Gulmon, S.L. and C.C. Chu. 1981. The effects of light and nitrogen on
photosynthesis, leaf characteristics, and dry matter allocation in the chaparral shrub, Diplacus aurantiacus. Oecologia 65:214--222. Gutschick, V.P. and F.W. Wiegel. 1988. Optimizing the canopy
photo-synthetic rate by patterns of investment in specific leaf mass. Am. Nat. 132:67--86.
Hager, H. and H. Sterba. 1985. Specific leaf area and needle weight of Norway spruce (Picea abies) in stands of different densities. Can. J. For. Res. 15:389--392.
Hellkvist, J., G.P. Richards and P.G. Jarvis. 1974. Vertical gradients of water potential and tissue water relations in Sitka spruce trees measured with the pressure chamber. J. Appl. Ecol. 11:637--667. Jackson, L.W.R. 1967. Effect of shade on leaf structure of deciduous
tree species. Ecology 48:498--499.
Jordan, D.N. and W.K. Smith. 1993. Simulated influence of leaf geometry on sunlight interception and photosynthesis in conifer needles. Tree Physiol. 13:29--39.
Jurik, T.W. 1986. Temporal and spatial patterns of specific leaf weight in successional northern hardwood tree species. Am. J. Bot. 73:1083--1092.
Kellomäki, S. and P. Oker-Blom. 1981. Specific needle area of Scots pine and its dependence on light conditions inside the canopy. Silva Fenn. 15:190--198.
Kerner, H., E. Gross and W. Koch. 1977. Structure of the assimilation system of a dominating spruce tree (Picea abies (L.) Karst.) of closed stand: computation of needle surface area by means of a variable geometric needle model. Flora 166:449--459.
Koch, W. 1976. Blattfarbstoffe von Fichte (Picea abies (L.) Karst.) in Abhängigkeit vom Jahresgang, Blattalter und-typ. Photosynthetica 10:280--290.
Koppel, A.T. and J.M. Frey. 1984. Variability of Norway spruce nee-dles related to radiation regime within the crown. Lesovedeniye 0(3):53--59 (in Russian).
Kull, O. and A. Koppel. 1987. Net photosynthetic response to light intensity of shoots from different crown positions and age in Picea
abies (L.) Karst. Scand. J. For. Res. 2:157--166.
Kull, O. and Ü. Niinemets. 1993. Variation in leaf morphometry and nitrogen concentration in Betula pendula Roth., Corylus avellana L. and Lonicera xylosteum L. Tree Physiol. 12:311--318.
Körner, C., P. Bannister and A.F. Mark. 1986. Altitudinal variation in stomatal conductance, nitrogen content and leaf anatomy in differ-ent plant life forms in New Zealand. Oecologia 169:577--588. Leuning, R., R.N. Cromer and S. Rance. 1991. Spatial distributions of
Leverenz, J.W. and P.G. Jarvis. 1980. Photosynthesis in Sitka spruce (Picea sitchensis (Bong.) Carr.). IX. The relative contribution made by needles at various positions on the shoot. J. Appl. Ecol. 17:59--68.
Lewandowska, M. and P.G. Jarvis. 1977. Changes in chlorophyll and carotenoid content, specific leaf area and dry weight fraction in Sitka spruce, in response to shading and season. New Phytol. 79:247--256.
Lichtenthaler, H.K. 1985. Differences in morphology and chemical composition of leaves grown at different light intensities and quali-ties. In Control of Leaf Growth. Eds. N.R. Baker, W.J. Davies and C.K. Ong. Soc. for Exp. Biol. Seminar Series 27, Cambridge University Press, Cambridge, London, New York, New Rochelle, Melbourne, Sydney, pp 201--221.
Linder, S. 1985. Potential and actual production in Australian forest stands. In Research for Forest Management. Eds. J.J. Landsberg and W. Parsons. CSIRO, Melbourne, pp 11--35.
Malkina, I.S. 1983. Relationships between photosynthesis of oak leaves and their structure and age of trees. Lesovedeniye 0(4):68--71 (in Russian).
Münster-Swendsen, M. 1987. Index of vigor in Norway spruce (Picea
abies Karst.). J. Appl. Ecol. 24:551--561.
Nilson, T. and V. Ross. 1979. Characterization of the transparency of a forest canopy by fish-eye photographs. In Spruce Forest Ecosys-tem Structure and Ecology, Vol. 2. Basic Data on the Estonian Vooremaa Project. Ed. T. Frey. Estonian IBP Report 12, Academy of Sciences of the Estonian S.S.R., Estonian Republican Committee for IBP, Tartu, pp 114--130.
Nobel, P.S. 1977. Internal leaf area and cellular CO2 resistance:
pho-tosynthetic implications of variations with growth conditions and plant species. Physiol. Plant. 40:137--144.
Nobel, P.S. and T.L. Hartsock. 1981. Development of leaf thickness for Plectranthus parviflorus----influence of photosynthetically ac-tive radiation. Physiol. Plant. 51:163--166.
Nygren, M. and S. Kellomäki. 1983--1984. Effect of shading on leaf structure and photosynthesis in young birches, Betula pendula Roth. and Betula pubescens Ehrh. For. Ecol. Manage. 7:119--132. Oker-Blom, P. 1985. Photosynthesis of a Scots pine shoot: simulation
of the irradiance distribution and photosynthesis of a shoot in different radiation fields. Agric. For. Meteorol. 34:31--40. Oren, R., E.-D. Schulze, R. Matyssek and R. Zimmermann. 1986.
Estimating photosynthetic rate and annual carbon gain in conifers from specific leaf weight and leaf biomass. Oecologia 70:187--193. Öquist, G., L. Brunes and J.-E. Hällgren. 1982. Photosynthetic effi-ciency of Betula pendula acclimated to different quantum flux densities. Plant Cell Environ. 5:9--15.
Powell, G.R. 1992. Patterns of leaf size and morphology in relation to shoot length in Tsuga canadensis. Trees 7:59--66.
Prioul, J.L. and R. Bourdu. 1973. Graphical display of photosynthetic adaptability to irradiance. Photosynthetica 7:405--407.
Rascio, A., M.C. Cedola, M. Toponi, Z. Flagella and G. Wittmer. 1990. Leaf morphology and water status changes in Triticum durum under water stress. Physiol. Plant. 78:462--467.
Reich, P.B., M.B. Walters and D.S. Ellsworth. 1991. Leaf age and season influence the relationships between leaf nitrogen, leaf mass per area and photosynthesis in maple and oak trees. Plant Cell Environ. 14:251--259.
Riederer, M., K. Kurbasik, R. Steinbrecher and A. Voss. 1988. Surface areas, lengths and volumes of Picea abies (L.) Karst. needles: determination, biological variability and effect of environmental factors. Trees 2:165--172.
Roberts, J., R.M. Pitman and J.S. Wallace. 1982. A comparison of evaporation from stands of Scots pine and Corsican pine in Thetford Chase, East Anglia. J. Appl. Ecol. 19:859--872.
Salminen, R., T. Nilson, P. Hari, L. Kaipiainen and J. Ross. 1983. A comparison of different methods for measuring the canopy light regime. J. Appl. Ecol. 20:897--904.
Smith, R.B., R.H. Waring and D.A. Perry. 1981. Interpreting foliar analyses from Douglas-fir as weight per unit of leaf area. Can. J. For. Res. 11:593--598.
Smith, W.K., A.W. Schoettle and M. Cui. 1991. Importance of the method of leaf area measurement to the interpretation of gas ex-change of complex shoots. Tree Physiol. 8:121--127.
Steele, M.J. 1984. The development of quantitative indices relating to the physiological age of Sitka spruce. In Report on Forest Research. Her Majesty’s Stationery Office, London, pp 65--66.
Steele, M.J., M.P. Coutts and M.M. Yeoman. 1989. Developmental changes in Sitka spruce as indices of physiological age. I. Changes in needle morphology. New Phytol. 113:367--375.
Tucker, G.F. and W.H. Emmingham. 1977. Morphological changes in leaves of residual western hemlock after clear and shelterwood cutting. For. Sci. 23:195--203.
van Hees, A.F.M. and H.H. Bartelink. 1993. Needle area relationships of Scots pine in the Netherlands. For. Ecol. Manage. 58:19--31. Verduin, J. 1959. Photosynthesis in conifers computed per unit leaf
area, dry weight, volume, chlorophyll content and respiratory rate. Ecology 40:738.
Wang, Y.P. and P.G. Jarvis. 1993. Influence of shoot structure on the photosynthesis of Sitka spruce (Picea sitchensis). Funct. Ecol. 7:443--451.
Wang, Y.P., P.G. Jarvis and M.L. Benson. 1990. Two-dimensional needle area density distribution within the crowns of Pinus radiata. For. Ecol. Manage. 32:217--237.
Westman, W.E. 1987. Aboveground biomass, surface area, and pro-duction relations of red fir (Abies magnifica) and white fir (A.
concolor). Can. J. For. Res. 17:311--319.
Witkowski, E.T.F. and B.B. Lamont. 1991. Leaf specific mass con-founds leaf density and thickness. Oecologia 88:486--493. Zimmermann, R. 1990. Photosynthese und Transpiration von Picea
abies (L.) Karst. bei unterschiedlichem Ernährungszustand im
Appendix 1. Abbreviations and units.
Abbreviation Definition Unit
ad Diffuse site factor
D1 Needle thickness mm
D2 Needle width mm
Ld Needle side length mm
Ld + z Projected D1 mm
Ln Needle length mm
Ls Shoot length mm
LWAt Mn per TLA g m−2
LWAp Mn per PLA1 g m−2
Mn Needle dry weight µg
SF Factor of needle spacing
N Needle number per shoot
ND Needle density g cm−3
NH Needle height (projected D2) mm
PLA Projected needle surface area mm2
PLAc Calculated PLA (PLA1, PLA2) mm2
PLA1 PLAc (Equation 3) mm2
PLA2 PLAc (Equation 4) mm2
PLAm Measured PLA mm2
Rh Relative sampling height
TLA Total needle surface area mm2
V Needle volume mm3