Summary An existing model of light and water use by crops (RESCAP) was adapted and evaluated for trees. In the model, growth on any given day is determined either by the amount of intercepted radiation (by means of the light utilization coeffi-cient, ε) or by the maximum rate of water extraction by roots (a function of root biomass and soil water content). In either case, transpiration and growth are related by the water-use efficiency (q), which is inversely proportional to the daily mean saturation vapor pressure deficit (D). The model was applied to two Pinus radiata (D. Don) stands (control (C) and fertilized (F)) growing near Canberra, Australia, using data collected during the Biology of Forest Growth experiment (1983--1988). For both stands, predicted and measured soil water contents were in close agreement (r2 > 0.9) over a 4-year period involv-ing several wet--dry cycles. The parameter combination ε/qD was estimated to be 0.28 and 0.26 kg H2O (MJ total)−1 kPa−1
for the C and F stands, respectively. Because of the close physiological link between water use and CO2 uptake, the
results suggest that tree growth may be realistically simulated by simple models based on conservative values for ε and qD. Keywords: growth, light utilization coefficient, RESCAP model, water-use efficiency.
Introduction
A key objective of many forest models is the prediction of tree growth and water use at the stand scale. The physiology under-lying the exchange of CO2 and water vapor between the
atmos-phere and individual leaves is relatively well understood. However, a major challenge lies in applying this knowledge at the canopy scale (Jarvis 1995). Several detailed physiological models exist that explicitly represent leaf-scale fluxes of CO2
and water and their variation within plant canopies (e.g., Wang and Jarvis 1990, McMurtrie et al. 1992, Sellers et al. 1992). However, two sets of observations indicate that the emergent behavior of growth and transpiration at the canopy scale may be more simply represented.
First, it is well documented for many crop and tree species that the amount of dry matter produced per unit of radiation intercepted by the canopy (i.e., the light utilization coefficient, ε) is approximately constant during vegetative growth when water supply is not limiting (e.g., Monteith 1977, Gallagher and Biscoe 1978, Linder 1985, Landsberg et al. 1996). Second, extensive growth data for crops (e.g., Tanner and Sinclair
1983) show that the amount of dry matter produced per unit of water transpired (i.e., the water-use efficiency, q) is approxi-mately inversely proportional to the mean saturation vapor pressure deficit (D), whether water is limiting or not. Short-term gas exchange measurements suggest that this relationship may also apply to trees (Baldocchi et al. 1987, Baldocchi and Harley 1995, Cienciala and Lindroth 1995, Lindroth and Cien-ciala 1995).
Some progress has been made in understanding the physi-ological basis of these observations. The constancy of qD can be understood in terms of the conservative nature of the inter-cellular [CO2] of foliage, although several empirical
assump-tions are needed to derive canopy-scale values of qD from the gas exchange properties of individual leaves (Bierhuizen and Slatyer 1965, Tanner and Sinclair 1983, Sinclair et al. 1984, Monteith 1990). The relationship between q and D is expected to be particularly strong for aerodynamically rough canopies, such as forests, for which transpiration is relatively insensitive to solar radiation (Jarvis and McNaughton 1986). More re-cently, the conservative nature of ε has been interpreted as the outcome of an optimal balance between photosynthesis and maintenance respiration (Dewar 1996). This interpretation leads to the theoretical prediction of ε as a function of several physiological and environmental factors, although further ex-perimental work is needed to evaluate this as well as other interpretations (e.g., Landsberg et al. 1996). Models founded on the conservative quantities ε and qD are attractive because they summarize plant physiology directly at the canopy scale while remaining relatively simple.
The RESCAP (RESource CAPture) model (Monteith 1986, Monteith et al. 1989) combines ε and qD within a simple framework in which growth on a given day is either light-lim-ited or water-limlight-lim-ited. The type of limitation that applies de-pends on the availability of these resources and the plant’s ability to capture them, equal emphasis being placed on the role of leaves in light interception and the role of roots in supplying water. RESCAP was originally developed for cereal crops. However, this simple, balanced approach to modeling light and water use appears to have received little attention from forest modelers.
The objective of this paper is to introduce a simplified version of RESCAP suitable for trees, and to evaluate it for Pinus radiata (D. Don) stands growing near Canberra, Austra-lia, using data collected during the Biology of Forest Growth experiment (Benson et al. 1992). For this evaluation, the basic
A simple model of light and water use evaluated for
Pinus radiata
RODERICK C. DEWAR
School of Biological Science, University of New South Wales, Sydney, NSW 2052, Australia
Received April 12, 1996
assumptions for light and water use in RESCAP were com-bined with a simple soil water balance model appropriate to these stands.
Model assumptions
Light and water use in RESCAP
A list of symbol definitions and units is given in Table 1. The central assumption of the RESCAP model (Monteith et al. 1989) is that daily growth (G), defined as total (above- and below-ground) dry matter production, is either light-limited or water-limited. For either type of limitation, it is assumed that daily transpiration (T) is proportional to G,
T=G
q, (1)
where q, the water-use efficiency, is inversely proportional to daily mean saturation vapor pressure deficit of the atmosphere (D),
q=qo
D, (2)
with qo, the normalized water-use efficiency, a constant.
Light-limited growth (GL) is calculated from the amount of radiation
intercepted by the canopy. Using a Beer’s law approach,
GL=εSo(1−exp(−kLc)), (3)
where ε is the light utilization coefficient, So is the daily
incident (total) solar radiation, k is the canopy light extinction coefficient and Lc is the projected leaf area index (LAI) of the
canopy.
Water-limited growth (Gw) is determined by the maximum
rate of water extraction by roots (E). In RESCAP, E is calcu-lated from the vertical distribution of root length density and extractable soil water content. This degree of resolution is appropriate for annual crops, where the rate of descent of the root system after sowing critically determines the seasonal pattern of water extraction (Monteith 1986, Robertson et al. 1993a, 1993b). For perennials with an established root system, it may be more appropriate to adopt a coarser resolution. In adapting the model for trees, a single-layer approximation is used in which E is a function of the root biomass (R) and soil water content (Q) within a homogeneous rooting zone of effective depth ds,
E=σR(Q−Qmin), (4)
where σ is a constant and Qmin is the minimum
(non-ex-tractable) soil water content to depth ds. Although a multi-layer
description of the rooting zone might be more realistic, the single-layer approximation must be evaluated, ultimately, in terms of its predictive success. Transpiration during water-lim-ited growth is equal to E, and Equation 1 then determines Gw
as
Gw=qE. (5)
Daily growth is then taken as the lesser of the two limiting rates,
G=min(GL,Gw), (6)
and daily transpiration is given by
T=min
GL
q ,E
. (7)
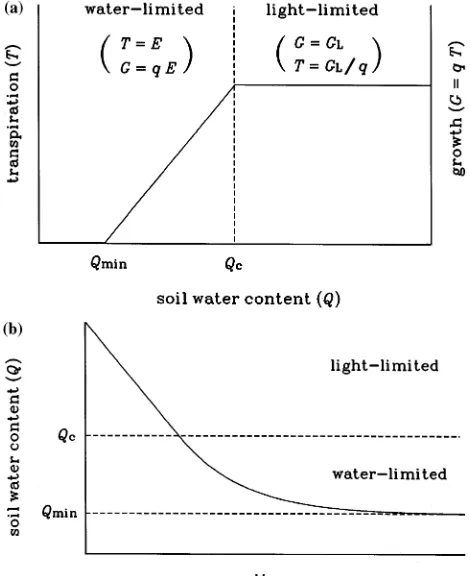
Figure 1a shows the general dependence of G and T on soil water content.
Soil water balance
Following McMurtrie et al. (1990a), daily maximum rainfall interception by the canopy (Imax) is assumed to be proportional
to canopy LAI,
Imax=sLc, (8)
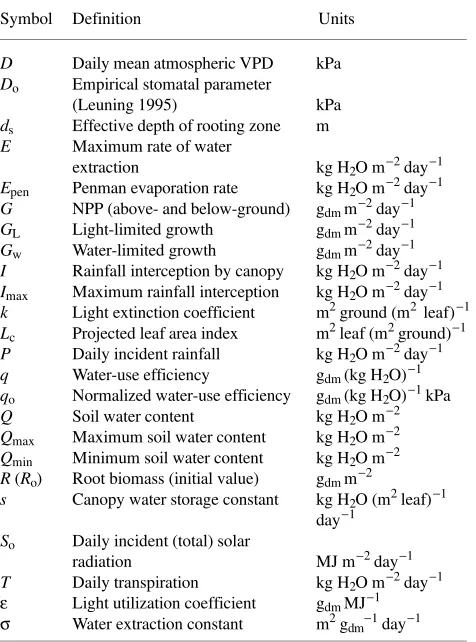
Table 1. Definitions and units of symbols used in text (dm = dry matter, NPP = net primary productivity, VPD = vapor pressure deficit).
Symbol Definition Units
D Daily mean atmospheric VPD kPa
Do Empirical stomatal parameter
(Leuning 1995) kPa
ds Effective depth of rooting zone m
E Maximum rate of water
extraction kg H2O m−2 day−1 Epen Penman evaporation rate kg H2O m−2 day−1 G NPP (above- and below-ground) gdm m−2 day−1 GL Light-limited growth gdm m−2 day−1 Gw Water-limited growth gdm m−2 day−1 I Rainfall interception by canopy kg H2O m−2 day−1 Imax Maximum rainfall interception kg H2O m−2 day−1 k Light extinction coefficient m2 ground (m2 leaf)−1
Lc Projected leaf area index m2 leaf (m2 ground)−1
P Daily incident rainfall kg H2O m−2 day−1 q Water-use efficiency gdm (kg H2O)−1 qo Normalized water-use efficiency gdm (kg H2O)−1 kPa Q Soil water content kg H2O m−2 Qmax Maximum soil water content kg H2O m−2 Qmin Minimum soil water content kg H2O m−2 R (Ro) Root biomass (initial value) gdm m−2
s Canopy water storage constant kg H2O (m2 leaf)−1
day−1
So Daily incident (total) solar
radiation MJ m−2 day−1
T Daily transpiration kg H2O m−2 day−1
ε Light utilization coefficient gdm MJ−1
where s is a storage constant. The canopy interception rate is then taken as the lesser of Imax and daily incident rainfall (P),
I= min(Imax,P). (9)
The reduction in canopy transpiration due to wet foliage was incorporated using the method described by McMurtrie et al. (1990a) (see Discussion), but was found to have a negligible effect on the predicted water balance of the two P. radiata stands to which the model was applied; this feature is therefore ignored here. Similarly, understory evapotranspiration was es-timated to be a minor component of water balance for these stands (Myers and Talsma 1992) and is also ignored. The daily rate of change of soil water content is then given by
dQ
dt =P−I−T, (10)
with drainage occurring at field capacity (Q = Qmax). Figure 1b
shows a hypothetical soil drying curve obtained from Equation 10 with P = I = 0 and with Lc, R, So and D held fixed. Initially,
growth is light-limited and soil water content decreases at a constant rate (given by GL/q). Below a critical value (Qc, which
is a function of Lc, R, So and D and is therefore fixed in this
example), growth becomes water-limited and soil water con-tent declines exponentially with a rate constant given by σR (see Equation 4). In reality, the value of Qc will change on a
daily basis because of variations in incident radiation and vapor pressure deficit, and on longer time-scales because of variations in leaf area and root biomass.
Materials and methods
The model was evaluated using data collected during the Biology of Forest Growth (BFG) experiment (1983--88) on the effects of fertilization and irrigation on P. radiata stands grow-ing near Canberra, Australia. In 1983, trees were 10 years old and stocking density was approximately 700 ha−1. Experimen-tal treatments applied were irrigation (I), solid fertilizer (F), irrigation plus solid fertilizer (IF), irrigation plus liquid fertil-izer (IL); a control (C) stand received no treatment. Data from the C and F stands were used to evaluate the present model (soil water content in the I, IF and IL stands being maintained at, or close to, field capacity). The F treatment was applied in two doses in September and October 1983, with a total addi-tion of 400 kg ha−1 of nitrogen and 200 kg ha−1 of phosphorus. A detailed description of the site and experiment is given in Benson et al. (1992).
Raison et al. (1992) estimated the pattern of leaf area devel-opment in each stand from 1983 to 1987. Their data corre-spond well with leaf areas predicted for these stands by the BIOMASS model (McMurtrie and Landsberg 1992, McMur-trie et al. 1992); BIOMASS was therefore used to extrapolate the leaf area data to 1988 to cover the period over which soil water contents were measured (Myers and Talsma 1992). Pro-jected LAI (Lc) was approximately 2 before treatment,
increas-ing to maximum values of 5 and 5.5 for the C and F stands, respectively (Figure 2). The linearly interpolated LAI data were used in conjuction with measured daily incident solar radiation (So) to calculate light-limited growth (GL,
Equa-tion 3), and in conjuncEqua-tion with measured daily incident rain-fall (P) to calculate rainrain-fall interception (I, Equation 9).
Following the method described by McMurtrie et al. (1990a), the mean daily vapor pressure deficit (D) was calcu-lated using a sinusoidal pattern of temperature over a 24-h cycle, with the assumption that air is saturated at the daily minimum temperature. No root biomass data were available to estimate the maximum water extraction rate (E, Equation 4) directly. As the simplest reasonable hypothesis, it was assumed that the ratio of root biomass to LAI remained constant throughout the experiment; the sensitivity of the model to this assumption is discussed below.
Myers and Talsma (1992) measured soil water content to a depth of 2 m at 2-week intervals in each stand. Their data for the C and F stands were compared with soil water contents
Figure 1. (a) Schematic relationship between transpiration (T), growth (G) and soil water content (Q) assumed in the model. The vertical axes are calibrated in terms of water or dry matter, related by water-use efficiency (q). In the water-limited phase (Qmin < Q < Qc), T and G are
determined by the maximum rate of water extraction by roots (E, Equation 4). In the light-limited phase (Q > Qc), T and G are deter-mined by intercepted radiation (GL is light-limited growth, Equa-tion 3). The critical water content (Qc, given by Qc = Qmin + GL/qσR) is a function of canopy LAI, root biomass, solar radiation and vapor pressure deficit; the value of Qc therefore changes on a daily basis. (b) Hypothetical soil drying curve predicted by the model with no rainfall input and Qc held fixed. Soil water content declines at a constant rate (GL/q) in the light-limited phase, and exponentially (with rate constant
predicted by numerical integration of Equation 10 from July 1, 1984 to July 1, 1988 on a daily timestep, assuming a rooting zone of effective depth ds = 2 m. Using previous estimates for
P. radiata stands, the light extinction coefficient was set to k = 0.5 (McMurtrie et al. 1992) and the storage constant was set to s = 0.5 mm day−1 (McMurtrie et al. 1990a). For each stand, Qmax was set equal to the maximum observed soil water
content. As discussed by McMurtrie et al. (1990b), a run-off of 50 mm from the C stand was assumed to occur following the single rainfall event of 130 mm that broke the summer drought of 1984--85.
The remaining parameters of the model determine daily transpiration (T) according to Equation 7. With the ratio R/Lc
constant, T depends on three independent parameter combina-tions: ε/qo, the ratio of the light utilization coefficient to the
normalized water-use efficiency; σRo, the initial value of the
rate constant for water extraction on July 1, 1984; and Qmin, the
minimum soil water content. These parameters determine dif-ferent characteristics of the soil drying curve, as the hypotheti-cal example in Figure 1b illustrates. For each stand, the values of σRo and Qmin were adjusted to obtain the best fit to the
observed soil water contents in the water-limited phase of the first drying cycle. The value of ε/qo, which determines water
use on light-limited days, was then adjusted to obtain the best agreement between predicted and measured soil water con-tents over the entire simulation period. Note that ε and qo
cannot be estimated separately by this procedure.
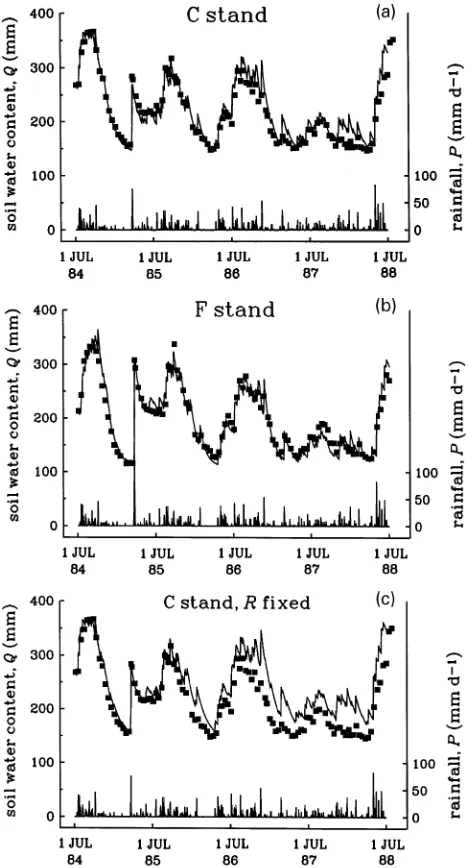
Results
The model gave good agreement with measured soil water contents over a 4-year period involving several wet--dry cycles, for both the C and F stands (r2 = 0.93 and 0.96, Figures 3a and 3b, respectively; the goodness of fit did not vary significantly with season). The fitted values of σRo and ε/qo (Table 2) are
physiologically reasonable. The value of σRo for both stands
(0.02 day−1) compares with values of 0.015 day−1 and 0.05 day−1 for sorghum growing on a vertisol and alfisol, respec-tively (Monteith 1986). I am unaware of other estimates of this parameter for trees.
The value of ε/qo (0.26--0.28 kg H2O MJ−1 kPa−1) is
inter-mediate between those reported by Monteith (1989) for tem-perate cereals (about 0.4 kg H2O MJ−1 kPa−1) and for C4
cereals and tropical/sub-tropical legumes (about 0.17 kg H2O
MJ−1 kPa−1). There are few published data on ε/qo for trees;
most estimates of ε and q are on incomparable timescales, and
Figure 2. Seasonal changes in projected leaf area index estimated by Raison et al. (1992) for control (C, m) and fertilized (F, j) P. radiata
stands; the last three data points for each stand were estimated by the BIOMASS model (McMurtrie et al. 1990a) and reflect the summer drought of 1987--88. The interpolated data (lines) were used to esti-mate light-limited growth (GL, Equation 3) on a daily basis.
qo values are rarely quoted. An exception is the study by
Baldocchi et al. (1987), who estimated short-term (half-hour) canopy values of ε and qo in a relatively well-watered
oak--hickory forest (Quercus and Carya spp.) using eddy correla-tion techniques. Their estimates of ε (4--8% photosynthetically active radiation conversion efficiency, or about 1.75--3.5 g CO2
MJ−1 total radiation) and qo (10.9 g CO2 kg−1 H2O kPa) imply
ε/qo = 0.16--0.32 kg H2O MJ−1 kPa−1, with a mid-range value
(0.24) comparable to the present estimate for P. radiata. The assumption that root biomass increased in proportion to leaf area was important in obtaining close agreement between predicted and measured soil water contents throughout the 4-year period. When the rate constant for water extraction was held fixed at its initial value (σRo), predicted soil water
con-tents were consistently higher than measured values, particu-larly during the last two years of the simulation (Figure 3c), as a result of the underestimation of water use on water-limited days.
Discussion
Alternative approaches
McMurtrie and Landsberg (1992) and McMurtrie et al. (1992) applied a more detailed model of canopy photosynthesis and water use (BIOMASS, McMurtrie et al. 1990a) to the same stands. They also obtained a good fit between predicted and measured soil water contents over the same 4-year period. In their simulations, the canopy was represented by three layers, each divided into sunlit and shaded fractions, and the soil was represented by two layers. Calculations of leaf CO2 exchange
were based on the detailed physiological model of Farquhar and von Caemmerer (1982) together with the empirical sto-matal conductance model of Ball et al. (1987). It was assumed that conductance was unaffected by soil water deficit until plant-available water declined to 40% of that at field capacity; below that point, conductance was assumed to decline linearly with plant-available soil water (McMurtrie et al. 1990a).
My results indicate that water use by these P. radiata stands can also be predicted successfully by a simpler scheme. Light-limited growth is calculated directly from intercepted radia-tion, rather than by integrating leaf-scale photosynthesis through the canopy. The effects of soil and air water deficits are expressed directly in terms of transpiration and growth and their relationship in terms of water-use efficiency, rather than in terms of stomatal conductance explicitly. The canopy and soil are each represented as a single layer, rather than several layers. Given that about 85% of the fine root system in these stands was found in the A horizon (0--40 cm depth), the apparent success of a single-layer soil model with effective depth ds = 2 m may reflect the importance of water extraction
by the remaining 15% of the root system during summer droughts (Myers and Talsma 1992).
Root /foliage allocation
The present simulations used measured (and BIOMASS-esti-mated) leaf areas as inputs to evaluate the basic assumptions of the RESCAP model. Clearly, it is desirable to predict Lc from
the model itself, on the basis of additional assumptions for growth allocation. RESCAP places equal emphasis on the role of leaves in light interception and the role of roots in supplying water, so that root /foliage allocation plays a key functional role in the RESCAP approach.
The assumption that R/Lc was constant resulted in
approxi-mate co-limitation of growth by light and water over the 4-year simulation; the proportion of days on which predicted growth was water-limited was 54 and 49% in the C and F stands, respectively. A more functional approach, and one that fits naturally into the RESCAP model, would be to assume that root/foliage allocation is a positive function of GL/Gw, the ratio
of light- to water-limited growth on any given day. By incor-porating the role of roots in nutrient uptake, this approach could be extended to include nutrient-limited growth. Experi-mental studies (e.g., Linder 1985, Dalla-Tea and Jokela 1991) and theory (Dewar 1996) suggest that nutrient limitations on forest productivity may operate primarily through allocation to foliage growth and light interception, rather than through the efficiency of light utilization (ε).
Validity of q ∝ 1/D
The assumption that vapor pressure deficit is the main deter-minant of water-use efficiency is expected to be valid more often for forests than for crops. For aerodynamically rough canopies that are well coupled to the atmosphere, transpiration is relatively insensitive to solar radiation (Jarvis and McNaughton 1986), as is the case for P. radiata canopies (Kelliher et al. 1990).
The physiological basis for q ∝ l/D may be understood at the leaf scale in terms of the conservative nature of the ratio ci/ca
of intercellular to atmospheric [CO2] (e.g., Sinclair et al. 1984).
However, because stomata close in response to increasing vapor pressure deficit, the ratio ci/ca is not strictly constant as
D varies. Future applications of RESCAP might consider the modified assumption q ∝ (l/D + l/Do), where Do is an empirical
constant, as suggested in the Appendix on the basis of a recent
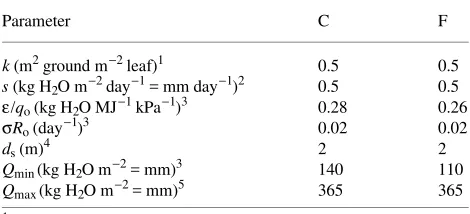
Table 2. Parameter values for the C and F stands, giving r2 = 0.93 and 0.96, respectively (Figures 3a and 3b). See Table 1 for parameter definitions.
Parameter C F
k (m2 ground m−2 leaf)1 0.5 0.5
s (kg H2O m−2 day−1 = mm day−1)2 0.5 0.5
ε/qo (kg H2O MJ−1 kPa−1)3 0.28 0.26
σRo (day−1)3 0.02 0.02
ds (m)4 2 2
Qmin (kg H2O m−2 = mm)3 140 110 Qmax (kg H2O m−2 = mm)5 365 365 1 McMurtrie et al. (1992).
2 McMurtrie et al. (1990a). 3 Best fit values.
4
Myers and Talsma (1992).
model for stomatal conductance (Leuning 1995). This modifi-cation takes into account the stomatal response to D and its effect on ci/ca, and implies that q approaches a non-zero value
as D increases.
A central assumption in RESCAP is that q has the same value whether water is limiting or not. The physiological basis for this assumption at the leaf scale is that the ci/ca ratio is
independent of water supply. McMurtrie et al. (1992) observed this to be the case for the P. radiata stands in the BFG experi-ment. In the context of Leuning’s (1995) stomatal model (Ap-pendix), one interpretation is that bimodal (i.e., patchy) stomatal closure occurs when the supply of water is limiting, resulting in a proportional decline in stomatal conductance and photosynthesis.
Applicability of the model to other stands
The reduction in canopy transpiration caused by wet foliage was ignored in the present application. Following McMurtrie et al. (1990a), this effect may be incorporated into Equation 10 by replacing T with max(0,1−I/Epen)T, where Epen is the
Pen-man rate of evaporation from a wet surface (Monteith 1965). The value of I/Epen, the fraction of the day during which the
canopy is wet, was estimated to be small for these P. radiata stands, but may be significant when rainfall occurs as frequent showers. Understory evapotranspiration was also ignored, but can be a major component of the water balance of open stands (Kelliher et al. 1990, Whitehead and Kelliher 1991). These components of water balance may need to be included when applying RESCAP to other stands.
Conclusion
In view of the close physiological link between water and CO2
uptake, the results of this study suggest that stand growth may be realistically simulated by relatively simple models based on conservative values for the light utilization coefficient (ε) and the normalized water-use efficiency (qo). The physiological
basis for this approach can be explored with more detailed models that explicitly represent leaf-scale fluxes of CO2 and
water; both approaches are useful and complementary.
Acknowledgments
I am indebted to Ross McMurtrie for supplying the BFG data, the BIOMASS leaf area estimates for 1988, and for many valuable discus-sions.
References
Baldocchi, D.D., S.B. Verma and D.E. Anderson. 1987. Canopy pho-tosynthesis and water-use efficiency in a deciduous forest. J. Appl. Ecol. 24:251--260.
Baldocchi, D.D. and P.C. Harley. 1995. Scaling carbon dioxide and water vapor exchange from leaf to canopy in deciduous forest. II. Model testing and application. Plant Cell Environ. 18:1157--1173. Ball, J.T., I.E. Woodrow and J.A. Berry. 1987. A model predicting stomatal conductance and its contribution to the control of photo-synthesis under different environmental conditions. In Progress in Photosynthesis Research, Vol. IV. Ed. J. Biggins. Martinus Nijhoff, Dordrecht, Netherlands, pp 221--224.
Benson, M.L., J.J. Landsberg and C.J. Borough. 1992. The Biology of Forest Growth experiment: an introduction. For. Ecol. Manage. 52:1--16.
Bierhuizen, J.F. and R.O. Slatyer. 1965. Effect of atmospheric concen-tration of water vapor and CO2 in determining
transpiration--photo-synthesis relationships of cotton leaves. Agric. Meteorol. 2:259--270.
Cienciala, E. and A. Lindroth. 1995. Gas-exchange and sap flow measurements of Salix viminalis trees in short-rotation forest. Trees 9:295--301.
Dalla-Tea, F. and E.J. Jokela. 1991. Needlefall, canopy light intercep-tion, and productivity of young intensively managed slash and loblolly pine stands. For. Sci. 37:1298--1313.
Dewar, R.C. 1996. The correlation between plant growth and inter-cepted radiation: an interpretation in terms of optimal plant nitrogen content. Ann. Bot. 78:125--136.
Farquhar, G.D. and S. von Caemmerer. 1982. Modelling of photosyn-thetic response to environmental conditions. In Physiological Plant Ecology. II. Water Relation and Carbon Assimilation. Encycl. Plant Physiol., New Ser., Vol. 12B. Eds. O.L. Lange, P.S. Nobel, C.B. Osmond and H. Ziegler. Springer-Verlag, Berlin, Germany, pp 549--587.
Gallagher, J.N. and P.V. Biscoe. 1978. Radiation absorption, growth and yield of cereals. J. Agric. Sci. 91:47--60.
Jarvis, P.G. 1995. Scaling processes and problems. Plant Cell Environ. 18:1079--1089.
Jarvis, P.G. and K.G. McNaughton. 1986. Stomatal control of transpi-ration: scaling up from leaf to region. Adv. Ecol. Res. 15:1--49. Kelliher, F.M., D. Whitehead, K.J. McAneney and M.J. Judd. 1990.
Partitioning evapotranspiration into tree and understorey compo-nents in two young Pinus radiata D. Don stands. Agric. For. Me-teorol. 50:211--227.
Landsberg, J.J., S.D. Prince, P.G. Jarvis, R.E. McMurtrie, R. Lux-moore and B.E. Medlyn. 1996. Energy conversion and use in forests: the analysis of forest production in terms of radiation utilization efficiency (ε). In The Use of Remote Sensing in the Modeling of Forest Productivity. Eds. H.L. Gholz, K. Nakane and H. Shimoda. Kluwer Academic Press, Dordrecht, Netherlands, pp 273--298.
Leuning, R. 1995. A critical appraisal of a combined stomatal--photo-synthesis model for C3 plants. Plant Cell Environ. 18:339--355.
Linder, S. 1985. Potential and actual production in Australian forest stands. In Research for Forest Management. Eds. J.J. Landsberg and W. Parsons. CSIRO, Australia, pp 11--35.
Lindroth, A. and E. Cienciala. 1995. Water use efficiency of short-ro-tation Salix viminalis at leaf, tree and stand scales. Tree Physiol. 16:257--262.
Lohammer, T., S. Larsson, S. Linder and S.O. Falk. 1980. FAST----Simulation models of gaseous exchange in Scots pine. Ecol. Bull. 32:505--523.
McMurtrie, R.E., D.A. Rook and F.M. Kelliher. 1990a. Modelling the yield of Pinus radiata on a site limited by water and nitrogen. For. Ecol. Manage. 31:381--413.
McMurtrie, R.E., M.L. Benson, S. Linder, S.W. Running, T. Talsma, W.J.B. Crane and B.J. Myers. 1990b. Water/nutrient interactions affecting the productivity of stands of Pinus radiata. For. Ecol. Manage. 30:415--423.
McMurtrie, R.E., R. Leuning, W.A. Thompson and A.M. Wheeler. 1992. A model of canopy photosynthesis and water use incorporat-ing a mechanistic formulation of leaf CO2 exchange. For. Ecol.
Manage. 52:261--278.
Monteith, J.L. 1965. Evaporation and environment. In The State and Movement of Water in Living Organisms. Ed. G.E. Fogg. Symp. Soc. Exp. Biol. No. 19, Academic Press, London, pp 205--234. Monteith, J.L. 1977. Climate and the efficiency of crop production in
Britain. Philos. Trans. R. Soc. Lond. B Biol. Sci. 281:277--294. Monteith, J.L. 1986. How do crops manipulate water supply and
demand? Philos. Trans. R. Soc. Lond. A Math Phys. Sci. 316:245--259.
Monteith, J.L. 1989. Steps in crop climatology. In Challenges in Dryland Agriculture----A Global Perspective. Eds. P.W. Unger, W.R. Jordan, T.V. Sneed and R.W. Jensen. Texas Agricultural Experiment Station, College Station, Texas, USA, pp 273--282.
Monteith, J.L. 1990. Conservative behaviour in the response of crops to water and light. In Theoretical Production Ecology: Reflections and Prospects. Eds. R. Rabbinge, J. Goudriaan, H. van Keulen, F.W.T. Penning de Vries and H.H. van Laar. Pudoc, Wageningen, pp 3--16.
Monteith, J.L., A.K.S. Huda and D. Midya. 1989. RESCAP: a re-source capture model for sorghum and pearl millet. In Modelling the Growth and Development of Sorghum and Pearl Millet. Eds. S.M. Virmani, H.L.S. Tandon and G. Alagarswamy. ICRISAT Re-search Bulletin 12, Patancheru, India, pp 30--34.
Myers, B.J. and T. Talsma. 1992. Site water balance and tree water status in irrigated and fertilised stands of Pinus radiata. For. Ecol. Manage. 52:17--42.
Raison, R.J., P.K. Khanna, M.L. Benson, B.J. Myers, R.E. McMurtrie and A.R.G. Lang. 1992. Dynamics of Pinus radiata foliage in relation to water and nutrient stress. II. Needle loss and temporal changes in total foliage mass. For. Ecol. Manage. 52:159--178. Robertson, M.J., S. Fukai, S. Ludlow and G.L. Hammer. 1993a. Water
extraction by grain sorghum in a humid environment. I. Analysis of the water extraction pattern. Field Crops Res. 33:81--97.
Robertson, M.J., S. Fukai, S. Ludlow and G.L. Hammer. 1993b. Water extraction by grain sorghum in a humid environment. II. Extraction in relation to root growth. Field Crops Res. 33:99--102.
Sellers, P.J., J.A. Berry, G.J. Collatz, C.B. Field and F.G. Hall. 1992. Canopy reflectance, photosynthesis, and transpiration. III. A reana-lysis using improved leaf models and a new canopy integration scheme. Remote Sens. Environ. 42:187--216.
Sinclair, T.R., C.B. Tanner and J.M. Bennett. 1984. Water-use effi-ciency in crop production. Bioscience 34:36--40.
Tanner, C.B. and T.R. Sinclair. 1983. Efficient water use in crop production: research or re-search? In Limitations to Efficient Water Use in Crop Production. Eds. H.M. Taylor, W.R. Jordan and T.R. Sinclair. Am. Soc. Agron., Madison, WI, USA, pp 1--27.
Wang, Y.-P. and P.G. Jarvis. 1990. Description and validation of an array model----MAESTRO. Agric. For. Meteorol. 51:257--280. Whitehead, D. and F.M. Kelliher. 1991. A canopy water balance model
for a Pinus radiata stand before and after thinning. Agric. For. Meteorol. 55:109--126.
Appendix----Leaf-scale water-use efficiency
Let Aleaf, Tleaf and g denote net leaf CO2 exchange,
transpira-tion and stomatal conductance for CO2, respectively. For a leaf
that is well coupled to the atmosphere (i.e., boundary layer conductance much greater than g), the leaf-scale WUE is
qleaf=
where ci and ca are the intercellular and atmospheric [CO2],
respectively. Leuning (1995) proposed a stomatal conductance model that combines the correlation between g and Aleaf (Ball
et al. 1987) with the hyperbolic function of Lohammer et al. (1980) describing stomatal response to humidity deficit:
g=al
Aleaf
ca (
1 +D/Do)−1, (A2)
where al and Do are empirical constants (the parameters go and
Γ in Leuning’s model have been set to zero for simplicity). With Aleaf=g(ca−ci), Equation A2 implies that
and substituting this expression into Equation A1 gives
qleaf =
From this analysis it may be seen that the assumption q ∝ 1/D of RESCAP is equivalent, at the leaf scale, to neglecting the stomatal response to humidity deficit and its effect on ci. The
effect of including the humidity response is that qleaf